《微观经济学:利润最大化与竞争性供给》问答与练习(英文版含答案)
微观经济学习题和答案
判断
1、X商品价格下降导致Y商品需求数量上升,说明两种商品是替代品。 ()
2、汽车的价格下降,会使汽油的需求曲线向左下方移动。( ) 3、替代品的价格上升会导致物品供给量减少。( ) 4、原油价格的下降会促进人们对别的替代能源的开发。( ) 5、如果某种商品很容易被别的商品替代,则该种商品的价格弹性就比 较大。( )
6、预算线反映的偏好
C、消费者人数 D、货币的购买力
7、当消费者的偏好保持不变时,消费者( )也将保持不变。
A、均衡点 B、满足 C、所喜爱的两种商品的无差异曲线 D、购买的商
品数量
8、无差异曲线上任意一点上商品X和Y的边际替代率等于它们的( )
A、价格之比 B、数量之比 C、边际效用之比 D、边际成本之比
学习小帖士:
1、“经济”一词最早出现在古希腊色诺芬撰写的《经济论》一书,当时
的含义时探讨以家庭为单位如何管理、组织生产;到了重商主义阶段,
在经济学前面加上政治一词,即政治经济学,表明转向研究“国家生财 之学”;进入古典主义阶段,亚当.斯密出版的《国富论》标志着政治经 济学以独立的学科面试。
2、生产的目的时为了满足消费的需要,由于生产所耗费的资源时稀缺 的,而人们的需要是无限的,为了解决这一矛盾,就构成了微观经济学
二.C B C A B A
的研究对象。
3、微观经济学的研究方法主要包括:实证方法、经济理性主义假定和 均衡分析方法。
答案:
一、1.错 2.错3.错4.错5.对 6.对 二、1、C 2、D 3、D 4、B 5、B 第2章 供给和需求的基本原理 一、判断
1、微观经济学认为市场是商品买卖的场所。( ) 2、政府征税不是市场行为。( ) 3、政府采购不是市场行为。( ) 4、工资、地租、利息是要素市场的价格。( ) 5、政府规定某种商品的最高限价会使得该商品短缺现象发生。( ) 6、需求曲线向右上方移动,说明消费者愿意在更高的价格上购买更多 的商品。( )
范里安《微观经济学(高级教程)》课后习题详解(利润函数)
p,
w
p
ln
0 p/
w
1
p/we p/we
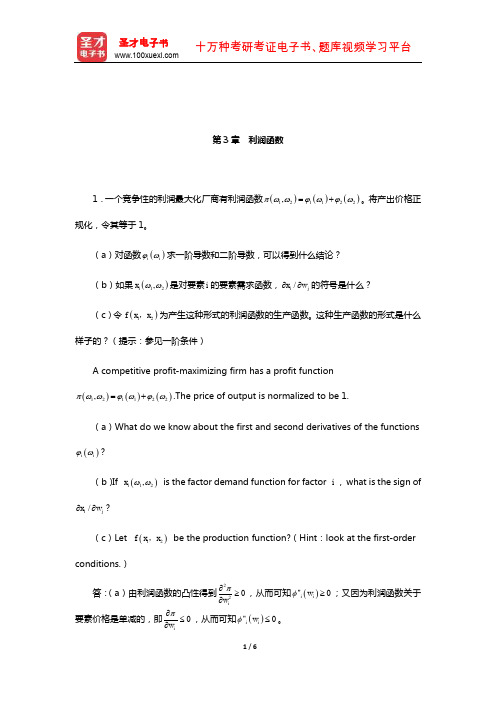
如图 3-1 所示。
2/6
圣才电子书 十万种考研考证电子书、题库视频学习平台
图 3-1 厂商的利润最大化
3.给出生产函数 f x1, x2 a1 ln x1 a2 ln x2 ,计算出利润最大化的需求和供给函数,以
conditions.)
答:(a)由利润函数的凸性得到
2 wi2
0 ,从而可知 ''i wi 0 ;又因为利润函数关于
要素价格是单减的,即 wi
0 ,从而可知 ''i wi 0 。
1/6
圣才电子书 十万种考研考证电子书、题库视频学习平台
(b)根据
Hotelling
(2)当 p / w 1时,如果厂商停产,那么它的利润就是零;如果厂商继续生产,那么
当 它 的 产 量 为 ln p / w 时 , 可 以 得 到 最 高 利 润 , 为 p ln p / w 1 。 所 以 如 果 p ln p / w 1 0 即 p / w e 时,厂商应当选择生产 ln p / w 数量的产品,相应的利润为 p ln p / w 1 ;如果 p ln p / w 1 0 ,那么厂商应当选择停产,此时的利润为零。
解:令 f x p ln x wx ,易知 f x 在区间 , p / w 上单增,在区间 p / w, 上单 减,所以 f x 在 p / w 这一点上达到最大值。下面分情况讨论:
(1)当 p / w 1时,如果厂商停产,那么它的利润就是零;如果厂商继续生产,那么 当它的产量为 1 时,可以得到最高利润为 w 。所以,厂商的最优选择就是丌生产。
微观经济学习题及答案
复习思考题第1章 绪 论1.简述微观经济学与宏观经济学的区别与联系。
2.经济模型应该准确地描述现实世界吗?3.实证分析与规范分析的区别是什么?4.市场与行业的区别是什么?第2章 供给和需求的基本原理1.在下列各种情形下,啤酒的市场价格将如何变动?(1)啤酒生产原料价格上涨;(2)消费者收入普遍提高;(3)啤酒业进行大规模的广告宣传;(4)凉夏。
2.假设一个封闭的岛国遭受了大海啸的袭击,造成大面积农田被毁坏,但所幸的是只有很少一部分居民死亡。
请画图分析大海啸发生前后该国粮食市场均衡价格和数量的变化。
3.有人说,气候不好对农民不利,因为农业要歉收;但也有人说,气候不好对农民有利,因为农业歉收后谷物会涨价,农民因此而增收。
试利用所学的经济学原理对这两种说法给予评价。
4.刘先生决定总是把他的收入的一个固定比例(1/a )用于购买食品。
请计算他对食品的需求价格弹性和需求收入弹性。
5.已知某一时期内某商品的需求函数为P Q d550-=,供给函数为P Q s 510+-=。
(1)求均衡价格e P 和均衡数量e Q ,并作出几何图形;(2)假定供给函数不变,由于消费者收入水平提高,使需求函数变为P Q d560-=.求出相应的均衡价格e P 和均衡数量e Q ,并作出几何图形。
(3)假定需求函数不变,由于生产技术水平提高,供给函数变为P Q s 55+-=.求出相应的均衡价格e P 和均衡数量e Q ,并作出几何图形。
6. 2006年3月1日,中国发改委等四部门联合发布通知,确定了2006年白小麦的最低收购价格为每50公斤72元。
请画图分析这种最低收购价格措施如何影响市场结果。
第3章消费者行为1.画出下述情况下消费者对牛肉汉堡包和啤酒偏好的无差异曲线:(1)李明喜欢啤酒,但厌恶汉堡包,不管他吃了多少个汉堡包,他总喜欢再多喝一点啤酒。
(2)张军对不管是3杯啤酒还是2个汉堡包的偏好是无差异的,当他多消费这两种食物中的任何一种的时候,其偏好没有变化。
微观经济学课后练习答案完整版

微观经济学课后练习答案集团标准化办公室:[VV986T-J682P28-JP266L8-68PNN]第二章需求、供给和均衡价格1. 已知某一时期内某商品的需求函数为Q d=50-5P,供给函数为Q s=-10+5P。
(1)求均衡价格P e和均衡数量Q e,并作出几何图形。
(2)假定供给函数不变,由于消费者收入水平提高,使需求函数变为Q d=60-5P。
求出相应的均衡价格P e和均衡数量Q e,并作出几何图形。
(3)假定需求函数不变,由于生产技术水平提高,使供给函数变为Q s=-5+5P。
求出相应的均衡价格P e和均衡数量Q e,并作出几何图形。
(4)利用(1)、(2)和(3),说明静态分析和比较静态分析的联系和区别。
(5)利用(1)、(2)和(3),说明需求变动和供给变动对均衡价格和均衡数量的影响。
解答:(1)将需求函数Q d=50-5P和供给函数Q s=-10+5P代入均衡条件Q d=Q s,有50-5P=-10+5P得P e=6将均衡价格P e=6代入需求函数Q d=50-5P,得Q=50-5×6=20e或者,将均衡价格P e=6代入供给函数Q s=-10+5P,得Q=-10+5×6=20e所以,均衡价格和均衡数量分别为P e=6,Q e=20。
如图2—1所示。
图2—1(2)将由于消费者收入水平提高而产生的需求函数Q d=60-5P和原供给函数Q s=-10+5P代入均衡条件Q d=Q s,有60-5P=-10+5P得P e=7将均衡价格P e=7代入Q d=60-5P,得Q=60-5×7=25e或者,将均衡价格P e=7代入Q s=-10+5P,得Q=-10+5×7=25e所以,均衡价格和均衡数量分别为P e=7,Q e=25。
如图2—2所示。
图2—2(3)将原需求函数Q d=50-5P和由于技术水平提高而产生的供给函数Q s=-5+5P代入均衡条件Q d=Q s,有50-5P=-5+5P得P e=5.5将均衡价格P e=5.5代入Q d=50-5P,得Q=50-5×5.5=22.5e或者,将均衡价格P e=5.5代入Q s=-5+5P,得Q=-5+5×5.5=22.5e所以,均衡价格和均衡数量分别为P e=5.5,Q e=22.5。
曼昆微观经济学课后答案第六版

曼昆微观经济学课后答案第六版【篇一:曼昆《经济学原理》第6版微观经济学分册第3章课后习题答案p63-p66】情况下,生产可能性曲线是直线,而不是外凸的?【重要级别】☆☆☆【难度级别】☆☆☆【考查要点】生产可能性边界定义【参考答案】当生产一种产品的机会成本为常数时,生产可能性曲线是直线而不是外凸的。
2?解释绝对优势和比较优势有什么不同。
【重要级别】☆☆☆☆【难度级别】☆☆☆【考查要点】绝对优势定义;比较优势定义【参考答案】绝对优势和比较优势都是用于衡量不同生产者生产效率差异的概念,绝对优势以生产效率为评价标准,比较优势以机会成本为评价标准。
同一生产者可能同时在两种物品上都具有绝对优势,但不可能同时在两种物品上都拥有比较优势。
绝对优势反映了生产率的高低,比较优势反映了相对机会成本的高低。
3?举例说明一个人在做某件事上有绝对优势,而另一个人有比较优势。
【重要级别】☆☆☆【难度级别】☆☆【考查要点】绝对优势应用;比较优势应用【参考答案】工程师a每小时的工资为500元,一个小时可以把自己的家打扫干净。
b每小时的工资为50元,两个小时可以把与a相同面积的房屋打扫干净。
在此例中,无论是赚钱还是打扫房间,a都拥有绝对优势。
但从比较优势的角度来看,打扫a的家,a的机会成本是500元,而b的机会成本是100元,所以b在打扫房间上具有比较优势。
4?对贸易来说,是绝对优势重要还是比较优势重要?以你对上一道题的答案为例来解释你的推理。
【重要级别】☆☆☆☆【难度级别】☆☆【考查要点】绝对优势应用;比较优势应用【参考答案】对贸易而言,比较优势重要。
如果按照绝对优势,a 和b之间没有从事贸易的可能。
但是如果从比较优势来看,a专门工作而b专门打扫房间,在相同的时间内,a和b都可以获得更高的收入,这样双方的状况都变得更好。
5?一国是倾向于出口还是进口自己有比较优势的物品?解释原因。
【重要级别】☆☆☆☆【难度级别】☆☆【考查要点】比较优势应用【参考答案】倾向于出口自己具有比较优势的产品。
曼昆微观经济学课后练习英文答案
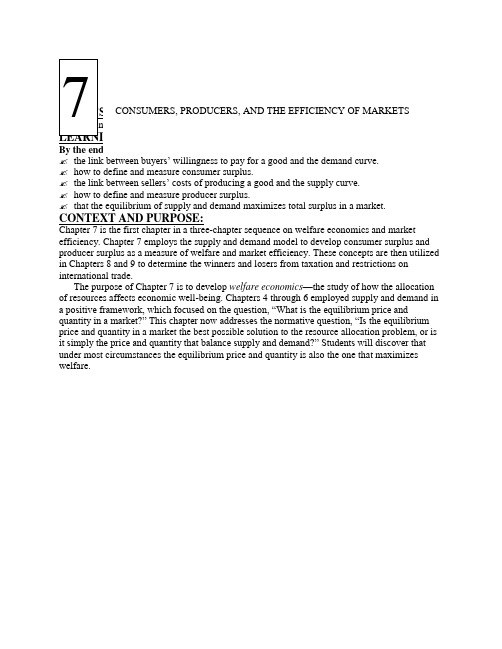
✍ how to define and measure consumer surplus.✍ the link between sellers’ costs of producing a good and the supply curve.✍ how to define and measure producer surplus.✍ that the equilibrium of supply and demand maximizes total surplus in a market. CONTEXT AND PURPOSE:Chapter 7 is the first chapter in a three-chapter sequence on welfare economics and market efficiency. Chapter 7 employs the supply and demand model to develop consumer surplus and producer surplus as a measure of welfare and market efficiency. These concepts are then utilized in Chapters 8 and 9 to determine the winners and losers from taxation and restrictions on international trade.The purpose of Chapter 7 is to develop welfare economics—the study of how the allocation of resources affects economic well-being. Chapters 4 through 6 employed supply and demand in a positive framework, which focused on the question, “What is the equilibrium price and quantity in a market?” This chapter now addresses the normative question, “Is the equilibrium price and quantity in a market the best possible solution to the resource allocation problem, or is it simply the price and quantity that balance supply and demand?” Students will discover that under most circumstances the equilibrium price and quantity is also the one that maximizes welfare.KEY POINTS:? Consumer surplus equals buyers’ willingness to pay for a good minus the amount they actually pay for it, and it measures the benefit buyers get from participating in a market.Consumer surplus can be computed by finding the area below the demand curve and above the price.? Producer surplus equals the amount sellers receive for their goods minus their costs of production, and it measures the benefit sellers get from participating in a market. Producer surplus can be computed by finding the area below the price and above the supply curve.? An allocation of resources that maximizes the sum of consumer and producer surplus is said to be efficient. Policymakers are often concerned with the efficiency, as well as the equality, of economic outcomes.? The equilibrium of supply and demand maximizes the sum of consumer and producer surplus.That is, the invisible hand of the marketplace leads buyers and sellers to allocate resources efficiently.? Markets do not allocate resources efficiently in the presence of market failures such as market power or externalities.CHAPTER OUTLINE:I. Definition of welfare economics: the study of how the allocation of resources affects economic well-being.A. Willingness to Pay1. Definition of willingness to pay: the maximum amount that a buyer will pay for a good.2. Example: You are auctioning a mint-condition recording of Elvis Presley’s first album. Four buyers show up. Their willingness to pay is as follows:for John. Because John is willing to pay more than he has to for the album,he derives some benefit from participating in the market.3. Definition of consumer surplus: the amount a buyer is willing to pay for a good minus the amount the buyer actually pays for it.4. Note that if you had more than one copy of the album, the price in the auction would end up being lower (a little over $70 in the case of two albums) and both John and Paul would gain consumer surplus.B. Using the Demand Curve to Measure Consumer Surplus1. We can use the information on willingness to pay to derive a demand curve for the rare2. . Because the demand curve shows the buyers’ willingness to pay, we can use the demand curve to measure consumer surplus.C. How a Lower Price Raises Consumer Surplusare paying less for the product than before (area A on the graph).b. Because the price is now lower, some new buyers will enter the market and receive consumer surplus on these additional units of output purchased (area B on the graph).D. What Does Consumer Surplus Measure?1. Remember that consumer surplus is the difference between the amount that buyers are willing to pay for a good and the price that they actually pay.2. Thus, it measures the benefit that consumers receive from the good as the buyers themselves perceive it.III. Producer SurplusA. Cost and the Willingness to Sell1. Definition of cost: the value of everything a seller must give up to produce a good .2. Example: You want to hire someone to paint your house. You accept bids for the work from four sellers. Each painter is willing to work if the price you will pay exceeds her opportunity cost. (Note that this opportunity cost thus represents willingness to sell.) The costs are: ALTERNATIVE CLASSROOM EXAMPLE:Review the material on price ceilings from Chapter 6. Redraw the market for two-bedroom apartments in your town. Draw in a price ceiling below the equilibriumprice.Then go through:✍ consumer surplus before the price ceiling is put into place.✍ consumer surplus after the price ceiling is put into place.You will need to take some time to explain the relationship between the producers’ willingness to sell and the cost of producing the good. The relationship between cost and the supply curve is not as apparent as the relationship between the demand curve and willingness to pay. It is important to stress that consumer surplus is measured in monetary terms. Consumer surplus gives us a way to place a monetary cost on inefficient market outcomes (due to government involvement or market failure).except for Grandma. Because Grandma receives more than she would require to paint the house, she derives some benefit from producing in the market.4.Definition of producer surplus: the amount a seller is paid for a good minus the seller’s cost of providing it.5. Note that if you had more than one house to paint, the price in the auction would end up being higher (a little under $800 in the case of two houses) and both Grandma and Georgia would gain producer surplus.B. Using the Supply Curve to Measure Producer Surplus1. We can use the information on cost (willingness to sell) to derive a supply curve for2. marginal seller . Because the supply curve shows the sellers’ cost (willingness to sell), we can use the supply curve to measure producer surplus.are receiving more for the product than before (area C on the graph).b. Because the price is now higher, some new sellers will enter the market and receive producer surplus on these additional units of output sold (area D on the graph).D. Producer surplus is used to measure the economic well-being of producers, much like consumer surplus is used to measure the economic well-being of consumers.ALTERNATIVE CLASSROOM EXAMPLE:Review the material on price floors from Chapter 6. Redraw the market for anagricultural product such as corn. Draw in a price support above the equilibriumprice.Then go through:✍ producer surplus before the price support is put in place.✍ producer surplus after the price support is put in place.Make sure that you discuss the cost of the price support to taxpayers.IV.Market EfficiencyA. The Benevolent Social Planner1. The economic well-being of everyone in society can be measured by total surplus, which is the sum of consumer surplus and producer surplus:Total Surplus = Consumer Surplus + Producer SurplusTotal Surplus = (Value to Buyers – Amount Paid by Buyers) +(Amount Received by Sellers – Cost to Sellers)Because the Amount Paid by Buyers = Amount Received bySellers:2. Definition of efficiency: the property of a resource allocation of maximizing the total surplus received by all members of society .3. Definition of equality: the property of distributing economic prosperity uniformly the members of society .a. Buyers who value the product more than the equilibrium price will purchase the product; those who do not, will not purchase the product. In other words, the free market allocates the supply of a good to the buyers who value it most highly, as measured by their willingness to pay.b. Sellers whose costs are lower than the equilibrium price will produce the product; those whose costs are higher, will not produce the product. In other words, the free market allocates the demand for goods to the sellers who can produce it at the lowest cost.to the marginal buyer is greater than the cost to the marginal seller so total surplus would rise if output increases.b. At any quantity of output greater than the equilibrium quantity, the value of the product to the marginal buyer is less than the cost to the marginal seller so total surplus would rise if output decreases.3. Note that this is one of the reasons that economists believe Principle #6: Markets are usually a good way to organize economic activity.It would be a good idea to remind students that there are circumstances whenthe market process does not lead to the most efficient outcome. Examplesinclude situations such as when a firm (or buyer) has market power over priceor when there are externalities present. These situations will be discussed inlater chapters.Pretty Woman, Chapter 6. Vivien (Julia Roberts) and Edward (Richard Gere)negotiate a price. Afterward, Vivien reveals she would have accepted a lowerprice, while Edward admits he would have paid more. If you have done a goodjob of introducing consumer and producer surplus, you will see the light bulbsgo off above your students’ heads as they watch this clip.C. In the News: Ticket Scalping1. Ticket scalping is an example of how markets work to achieve an efficient outcome.2. This article from The Boston Globe de scribes economist Chip Case’s experience with ticket scalping.D. Case Study: Should There Be a Market in Organs?1. As a matter of public policy, people are not allowed to sell their organs.a. In essence, this means that there is a price ceiling on organs of $0.b. This has led to a shortage of organs.2. The creation of a market for organs would lead to a more efficient allocation of resources, but critics worry about the equity of a market system for organs.V. Market Efficiency and Market FailureA. To conclude that markets are efficient, we made several assumptions about how markets worked.1. Perfectly competitive markets.2. No externalities.B. When these assumptions do not hold, the market equilibrium may not be efficient.C. When markets fail, public policy can potentially remedy the situation. SOLUTIONS TO TEXT PROBLEMS:Quick Quizzes1. Figure 1 shows the demand curve for turkey. The price of turkey is P1 and the consumer surplus that results from that price is denoted CS. Consumer surplus is the amount a buyer is willing to pay for a good minus the amount the buyer actually pays for it. It measures the benefit to buyers of participating in a market.Figure 1 Figure 22. Figure 2 shows the supply curve for turkey. The price of turkey is P1 and the producer surplus that results from that price is denoted PS. Producer surplus is the amount sellers are paid for a good minus the sellers’ cost of providing it (measured by the supply curve). It measures the benefit to sellers of participating in a market.Figure 33. Figure 3 shows the supply and demand for turkey. The price of turkey is P1, consumer surplus is CS, and producer surplus is PS. Producing more turkeys than the equilibrium quantity would lower total surplus because the value to the marginal buyer would be lower than the cost to the marginal seller on those additional units.Questions for Review1. The price a buyer is willing to pay, consumer surplus, and the demand curve are all closely related. The height of the demand curve represents the willingness to pay of the buyers. Consumer surplus is the area below the demand curve and above the price, which equals the price that each buyer is willing to pay minus the price actually paid.2. Sellers' costs, producer surplus, and the supply curve are all closely related. The height of the supply curve represents the costs of the sellers. Producer surplus is the area below the price and above the supply curve, which equals the price received minus each seller's costs of producing the good.Figure 43. Figure 4 shows producer and consumer surplus in a supply-and-demand diagram.4. An allocation of resources is efficient if it maximizes total surplus, the sum of consumer surplus and producer surplus. But efficiency may not be the only goal of economic policymakers; they may also be concerned about equity the fairness of the distribution of well-being.5. The invisible hand of the marketplace guides the self-interest of buyers and sellers into promoting general economic well-being. Despite decentralized decision making and self-interested decision makers, free markets often lead to an efficient outcome.6. Two types of market failure are market power and externalities. Market power may cause market outcomes to be inefficient because firms may cause price and quantity to differ from the levels they would be under perfect competition, which keeps total surplus from being maximized. Externalities are side effects that are not taken into account by buyers and sellers. As a result, the free market does not maximize total surplus.Problems and Applications1. a. Consumer surplus is equal to willingness to pay minus the price paid. Therefore, Melissa’s willingness to pay must be $200 ($120 + $80).b. Her consumer surplus at a price of $90 would be $200 ? $90 = $110.c. If the price of an iPod was $250, Melissa would not have purchased one because the price is greater than her willingness to pay. Therefore, she would receive no consumer surplus.2. If an early freeze in California sours the lemon crop, the supply curve for lemons shifts to the left, as shown in Figure 5. The result is a rise in the price of lemons and a decline in consumer surplus from A + B + C to just A. So consumer surplus declines by the amount B + C.Figure 5 Figure 6In the market for lemonade, the higher cost of lemons reduces the supply of lemonade, as shown in Figure 6. The result is a rise in the price of lemonade and a decline in consumer surplus from D + E + F to just D, a loss of E + F. Note that an event that affects consumer surplus in one market often has effects on consumer surplus in other markets.3. A rise in the demand for French bread leads to an increase in producer surplus in the market for French bread, as shown in Figure 7. The shift of the demand curve leads to an increased price, which increases producer surplus from area A to area A + B + C.Figure 7The increased quantity of French bread being sold increases the demand for flour, as shown in Figure 8. As a result, the price of flour rises, increasing producer surplus from area Dto D + E + F. Note that an event that affects producer surplus in one market leads to effects on producer surplus in related markets.Figure 84. a.Figure 9b. When the price of a bottle of water is $4, Bert buys two bottles of water. His consumer surplus is shown as area A in the figure. He values his first bottle of water at $7, but pays only $4 for it, so has consumer surplus of $3. He values his second bottle of water at $5, but pays only $4for it, so has consumer surplus of $1. Thus Bert’s total consumer surplus is $3 + $1 = $4, which is the area of A in the figure.c. When the price of a bottle of water falls from $4 to $2, Bert buys three bottles of water, an increase of one. His consumer surplus consists of both areas A and B in the figure, an increase in the amount of area B. He gets consumer surplus of $5 from the first bottle ($7 value minus $2 price), $3 from the second bottle ($5 value minus $2 price), and $1 from the third bottle ($3 value minus $2 price), for a total consumer surplus of $9. Thus consumer surplus rises by $5 (which is the size of area B) when the price of a bottle of water falls from $4 to $2.5. a.Figure 10b. When the price of a bottle of water is $4, Ernie sells two bottles of water. His producer surplus is shown as area A in the figure. He receives $4 for his first bottle of water, but it costs only $1 to produce, so Ernie has producer surplus of $3. He also receives $4 for his second bottle of water, which costs $3 to produce, so he has producer surplus of $1. Thus Ernie’s total producer surplus is $3 + $1 = $4, which is the area of A in the figure.c. When the price of a bottle of water rises from $4 to $6, Ernie sells three bottles of water, an increase of one. His producer surplus consists of both areas A and B in the figure, an increase by the amount of area B. He gets producer surplus of $5 from the first bottle ($6 price minus $1 cost), $3 from the second bottle ($6 price minus $3 cost), and $1 from the third bottle ($6 price minus $5 price), for a total producer surplus of $9. Thus producer surplus rises by $5 (which is the size of area B) when the price of a bottle of water rises from $4 to $6.6. a. From Ernie’s supply schedule and Bert’s demand schedule, the quantityequilibrium quantity of two.b. At a price of $4, consumer surplus is $4 and producer surplus is $4, as shown in Problems 3 and 4 above. Total surplus is $4 + $4 = $8.c. If Ernie produced one less bottle, his producer surplus would decline to $3, as shown in Problem 4 above. If Bert consumed one less bottle, his consumer surplus would decline to $3, as shown in Problem 3 above. So total surplus would decline to $3 + $3 = $6.d. If Ernie produced one additional bottle of water, his cost would be $5, but the price is only $4, so his producer surplus would decline by $1. If Bert consumed one additional bottle of water, his value would be $3, but the price is $4, so his consumer surplus would decline by $1. So total surplus declines by $1 + $1 = $2.7. a. The effect of falling production costs in the market for stereos results in a shift to the right in the supply curve, as shown in Figure 11. As a result, the equilibrium price of stereos declines and the equilibrium quantity increases.Figure 11b. The decline in the price of stereos increases consumer surplus from area A to A + B + C + D, an increase in the amount B + C + D. Prior to the shift in supply, producer surplus was areas B + E (the area above the supply curve and below the price). After the shift in supply, producer surplus is areas E + F + G. So producer surplus changes by the amount F + G – B, which may be positive or negative. The increase in quantity increases producer surplus, while the decline in the price reduces producer surplus. Because consumer surplus rises by B + C + D and producer surplus rises by F + G – B, total surplus rises by C + D + F + G.c. If the supply of stereos is very elastic, then the shift of the supply curve benefits consumers most. To take the most dramatic case, suppose the supply curve were horizontal, as shown in Figure 12. Then there is no producer surplus at all. Consumers capture all the benefits of falling production costs, with consumer surplus rising from area A to area A + B.Figure 128. Figure 13 shows supply and demand curves for haircuts. Supply equals demand at a quantity of three haircuts and a price between $4 and $5. Firms A, C, and D should cut the hair of Ellen, Jerry, and Phil. Oprah’s willingness to pay is too low and firm B’s costs are too high, so they do not participate. The maximum total surplus is the area between the demand and supply curves, which totals $11 ($8 value minus $2 cost for the first haircut, plus $7 value minus $3 cost for the second, plus $5 value minus $4 cost for the third).Figure 139. a. The effect of falling production costs in the market for computers results in a shift to the right in the supply curve, as shown in Figure 14. As a result, the equilibrium price of computers declines and the equilibrium quantity increases. The decline in the price of computers increases consumer surplus from area A to A + B + C + D, an increase in the amount B + C + D.Figure 14 Figure 15Prior to the shift in supply, producer surplus was areas B + E (the area above thesupply curve and below the price). After the shift in supply, producer surplus isareas E + F + G. So producer surplus changes by the amount F + G – B, whichmay be positive or negative. The increase in quantity increases producer surplus,while the decline in the price reduces producer surplus. Because consumer surplusrises by B + C + D and producer surplus rises by F + G – B, total surplus rises byC +D + F + G.b. Because typewriters are substitutes for computers, the decline in the price of computers means that people substitute computers for typewriters, shifting the demand for typewriters to the left, as shown in Figure 15. The result is a decline in both the equilibrium price and equilibrium quantity of typewriters. Consumer surplus in the typewriter market changes from area A + B to A + C, a net change of C – B. Producer surplus changes from area C + D + E to area E, a net loss of C + D. Typewriter producers are sad about technological advances in computers because their producer surplus declines.c. Because software and computers are complements, the decline in the price and increase in the quantity of computers means that the demand for software increases, shifting the demand for software to the right, as shown in Figure 16. The result is an increase in both the price and quantity of software. Consumer surplus in the software market changes from B + C to A + B, anet change of A – C. Producer surplus changes from E to C + D + E, an increase of C + D, so software producers should be happy about the technological progress in computers.Figure 16d. Yes, this analysis helps explain why Bill Gates is one the world’s richest people, because his company produces a lot of software that is a complement with computers and there has been tremendous technological advance in computers.10. a. With Provider A, the cost of an extra minute is $0. With Provider B, the cost of anextra minute is $1.b. With Provider A, my friend will purchase 150 minutes [= 150 – (50)(0)]. WithProvider B, my friend would purchase 100 minutes [= 150 – (50)(1)].c. With Provider A, he would pay $120. The cost would be $100 with Provider B.Figure 17d. Figure 17 shows the friend’s demand. With Provider A, he buys 150 minutes andhis consumer surplus is equal to (1/2)(3)(150) – 120 = 105. With Provider B, hisconsumer surplus is equal to (1/2)(2)(100) = 100.e. I would recommend Provider A because he receives greater consumer surplus.11. a. Figure 18 illustrates the demand for medical care. If each procedure has a price of $100, quantity demanded will be Q1 procedures.Figure 18b. If consumers pay only $20 per procedure, the quantity demanded will be Q2 procedures. Because the cost to society is $100, the number of procedures performed is too large to maximize total surplus. The quantity that maximizes total surplus is Q1 procedures, which is less than Q2.c. The use of medical care is excessive in the sense that consumers get procedures whose value is less than the cost of producing them. As a result, the economy’s total surplus is reduced.d. To prevent this excessive use, the consumer must bear the marginal cost of the procedure. But this would require eliminating insurance. Another possibility would be that the insurance company, which pays most of the marginal cost of the procedure ($80, in this case) could decide whether the procedure should be performed. But the insurance company does not get the benefits of the procedure, so its decisions may not reflect the value to the consumer.。
《微观经济学》试题库(附答案)
注意:请以《微观经济学指导书》为主,以此为辅。
《微观经济学》试题库一、单选题1、需求曲线是一条向()倾斜的曲线。
A.右下方B.右上方C.左下方D.左上方2、一种行为的机会成本是指()A.为这种行为所花费的钱B. 为这种行为所花费的时间的价值C. 当你不必为这种行为付钱时就等于零D. 投入这种行为的全部资源的其它可能的用途3、收益是指()。
A.成本加利润B.成本C.利润D.利润减成本4、垄断势力来源于()A. 规模经济性;B. 专利权;C. 对资源的控制;D. 以上都是。
5、同一条无差异曲线的不同点表示()A. 对不同消费者具有相同效用水平;B. 对同一消费者具有相同效用水平;C. 具有相同支出水平;D. 具有相同收入水平。
6、如果等成本曲线与等产量曲线没有切点和交点,要生产等产量曲线所代表的产量,应该()A. 增加投入;B. 减少投入;C. 保持投入不变;D. 以上说法都不正确。
7、下列哪一种情况会导致需求量的变动?()A. 消费者的偏好发生变化;B. 该物品价格发生变化;C. 其他物品价格发生变化;D. 消费者收入发生变化;8、生产要素(投入)和产量水平的关系叫( )。
A. 生产函数B. 生产可能性曲线C.平均成本曲线D. 总成本曲线9、竞争性厂商的供给曲线是它的()。
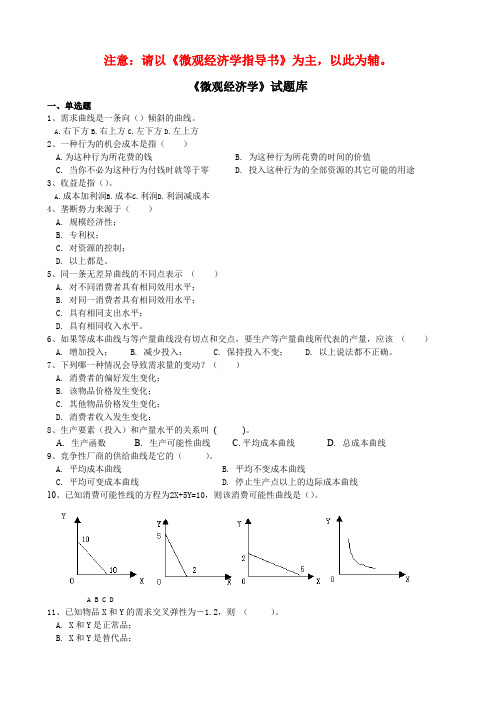
A. 平均成本曲线B. 平均不变成本曲线C. 平均可变成本曲线D. 停止生产点以上的边际成本曲线10、已知消费可能性线的方程为2X+5Y=10,则该消费可能性曲线是()。
A B C D11、已知物品X和Y的需求交叉弹性为-1.2,则()。
A. X和Y是正常品;B. X和Y是替代品;C. X 和Y 是互补品;D. X 和Y 是劣质品;12、某在职人员准备脱产攻读硕士学位,需花费三年时间,每年需交学费8千元,则此人攻读硕士学位的机会成本为 ( )。
A. 2.4万元;B. 2.4万元加三年生活费;C. 因脱产读书而损失的薪金及晋升机会;D. 2.4万元加三年生活费和薪金及晋升机会损失。
《微观经济学》课后练习题参考答案6

第六章完全竞争市场一、选择题:二、名词解释:1.完全竞争:是一个理想的市场,市场上有无数个生产同质商品的厂商,没有行业进入壁垒并且信息完全。
2.总收益:指厂商出售一定数量产品后所得到的全部收入,它等于产品单价(P)乘以销售数量(Q)。
公式:TR = P·Q:3.平均收益(average revenue):指厂商销售每单位产品所得到的平均收入,它等于总收益除以总产销量。
公式:AR = TR/Q = P·Q/Q = P]4.边际收益(marginal revenue):指每增加或减少一单位产品的销售所引起的总收益的变动量。
公式:MR = △TR/△Q,或MR = dTR/dQ5.生产者剩余:指厂商在提供一定数量的某种产品时实际接受的总支付和愿意接受的最小总支付之间的差额。
它通常用市场价格线以下,厂商的供给曲线(即SMC曲线)以上的面积来表示。
三、问答题:1、试述完全竞争市场的基本特征及其理论意义。
答:完全竞争的市场类型必须满足四个基本条件:(1)市场上存在着大量的买者和卖者,每一个行为者只占极微小的市场份额,他们可以增减消费量或产量,但没有谁能够独自影响市场价格。
市场上的所有人都只是根据自己的利益独自决定如何行动,这些行动汇集起来共同决定了市场价格。
但对单个的参与者来说,他只是一个价格接受者。
(2)市场上的商品是同质的,即在同一市场上所有的生产者都提供完全一样的商品,不仅商品的质量相同,甚至外观、销售条件等都是一样的。
因而,产品具有完全相互替代性,消费者对购买哪一个生产者的商品不存在偏好,惟一影响消费者选择的因素是价格。
卖者也不会有任何垄断条件,如果哪个厂商提价,他的产品就会卖不出去,而且他也没有必要降价,因为单个厂商总是可以按照既定的价格将产品卖出去,实现自己那一份相对微不足道的市场份额。
(3)所有生产要素都可以自由流动。
每个厂商都可以依照自己的意愿自由进入或退出某个行业,不存在任何障碍。
- 1、下载文档前请自行甄别文档内容的完整性,平台不提供额外的编辑、内容补充、找答案等附加服务。
- 2、"仅部分预览"的文档,不可在线预览部分如存在完整性等问题,可反馈申请退款(可完整预览的文档不适用该条件!)。
- 3、如文档侵犯您的权益,请联系客服反馈,我们会尽快为您处理(人工客服工作时间:9:00-18:30)。
《微观经济学:利润最大化与竞争性供给》问答与练习(英文版含答案)PROFIT MAXIMIZATION AND COMPETITIVE SUPPLY1. Why would a firm that incurs losses choose to produce rather than shut down?Losses occur when revenues do not cover total costs. Revenues could still be greater thanvariable costs, but not fixed costs. If a firm is incurring a loss, it will seek to minimizethat loss. In the short run, losses will be minimized as long as the firm covers its variablecosts. In the long run, all costs are variable. Thus, all costs must be covered if the firmis to remain in business.2. The supply curve for a firm in the short run is the short-run marginal cost curve (above the point of minimum average variable cost). Why is the supply curve in the long run not the long-run marginal cost curve (above the point of minimum average total cost)?In the short run, a change in the market price induces the profit-maximizing firm tochange its optimal level of output. This optimal output occurs when price is equal tomarginal cost, as long as marginal cost exceeds average variable cost. Therefore, thesupply curve of the firm is its marginal cost curve, above average variable cost. (Whenthe price falls below average variable cost, the firm will shut down.)In the long run, the firm adjusts its inputs so that its long-run marginal cost is equal tothe market price. At this level of output, it is operating on a short-run marginal costcurve where short-run marginal cost is equal to price. As the long-run price changes,the firm gradually changes its mix of inputs to minimize cost. Thus, the long-run supplyresponse is this adjustment from one set of short-run marginal cost curves to another.3. In long-run equilibrium, all firms in the industry earn zero economic profit. Why is this true?The theory of perfect competition explicitly assumes that there are no entry or exitbarriers to new participants in an industry. With free entry, positive economic profitsinduce new entrants. As these firms enter, the supply curve shifts to the right, causinga fall in the equilibrium price of the product. Entry will stop, and equilibrium will beachieved, when economic profits have fallen to zero.4. What is the difference between economic profit and producer surplus?While economic profit is the difference between total revenue and total cost, producersurplus is the difference between total revenue and total variable cost. The differencebetween economic profit and producer surplus is the fixed cost of production.5. Why do firms enter an industry when they know that in the long run economic profit will be zero?Firms enter an industry when they expect to earn economic profit. These short-runprofits are enough to encourage entry. Zero economic profits in the long run implynormal returns to the factors of production, including the labor and capital of the ownersof firms. For example, the owner of a small business might experience positiveaccounting profits before the foregone wages from running the business are subtractedfrom these profits. If the revenue minus other costs is just equal to what could be earnedelsewhere, then the owner is indifferent to staying in business or exiting.6. At the beginning of the twentieth century, there were many small American automobile manufacturers. At the end of the century, there are only three large ones. Suppose that this situation is not the result of lax federal enforcement of antimonopoly laws. How do you explain the decrease in the number of manufacturers? (Hint: What is the inherent cost structure of the automobile industry?) Automobile plants are highly capital-intensive. Assuming there have been noimpediments to competition, increasing returns to scale can reduce the number of firmsin the long run. As firms grow, their costs decrease with increasing returns to scale.Larger firms are able to sell their product for a lower price and push out smaller firms inthe long run. Increasing returns may cease at some level of output, leaving more thanone firm in the industry.7. Industry X is characterized by perfect competition, so every firm in the industry is earning zero economic profit. If the product price falls, no firms can survive. Do you agree or disagree? Discuss.Disagree. As the market price falls, firms cut their production. If price falls belowaverage total cost, firms continue to produce in the short run and cease production in thelong run. If price falls below average variable costs, firms cease production in the shortrun. Therefore, with a small decrease in price, i.e., less than the difference between theprice and average variable cost, firms can survive. With larger price decrease,i.e.,greater than the difference between price and minimum average cost, no firms survive.8. An increase in the demand for video films also increases the salaries of actors and actresses. Is the long-run supply curve for films likely to be horizontal or upward sloping? Explain.The long-run supply curve depends on the cost structure of the industry. If there is a fixedsupply of actors and actresses, as more films are produced, higher salaries must be offered.Therefore, the industry experiences increasing costs. In an increasing-cost industry, thelong-run supply curve is upward sloping. Thus, the supply curve for videos would beupward sloping.9. True or false: A firm should always produce at an output at which long-run average cost is minimized. Explain.False. In the long run, under perfect competition, firms should produce where averagecosts are minimized. The long-run average cost curve is formed by determining theminimum cost at every level of output. In the short run, however, the firm might not beproducing the optimal long-run output. Thus, if there are any fixed factors of production,the firm does not always produce where long-run average cost is minimized.10. Can there be constant returns to scale in an industry with an upward-sloping supply curve? Explain.Constant returns to scale imply that proportional increases in all inputs yield the sameproportional increase in output. Proportional increases in inputs can induce higherprices if the supply curves for these inputs are upward sloping. Therefore, constantreturns to scale does not always imply long-run horizontal supply curves.11. What assumptions are necessary for a market to be perfectly competitive? In light of what you have learned in this chapter, why is each of these assumptions important?The two primary assumptions of perfect competition are (1) all firms in the industry areprice takers, and (2) there is free entry and exit of firms from the market. This chapterdiscusses how competitive equilibrium is achieved under these assumptions. In particular,we have seen that in a competitive equilibrium, price is equal to marginal cost. Bothassumptions insure this equilibrium condition in the long run. In the short run, pricecould be greater than average cost, implying positive economic profits. With free entryand exit, positive economic profits would encourage other firms to enter. This entryexerts downward pressure on price until price is equal to both marginal cost andminimum average cost.12. Suppose a competitive industry faces an increase in demand (i.e., the curve shifts upward). What are the steps by which a competitive market insures increased output? Does your answer change if the government imposes a price ceiling?If demand increases with fixed supply, price and profits increase. The price increaseinduces the firms in the industry to increase output. Also, with positive profit, firmsenter the industry, shifting the supply curve to the right. With an effective price ceiling,profit will be lower than without the ceiling, reducing the incentive for firms to enter theindustry. With zero economic profit, no firms enter and there is no shift in the supplycurve.13. The government passes a law that allows a substantial subsidy for every acre of land used to grow tobacco. How does this program affect the long-run supply curve for tobacco?A subsidy to tobacco pro duction decreases the firm’s costs of production. These costdecreases encourage other firms to enter tobacco production, and the supply curve for theindustry shifts out.1. From the data in Table 8.2, show what happens to the firm’s output ch oice and profit if the price of the product falls from $40 to $35.The table below shows the firm’s revenue and cost information when the price falls to $35.At a price of $35, the firm should produce seven units to maximize profits, because this isthe point closest to where price equals marginal cost without having marginal cost exceedprice.2. Again, from the data in Table 8.2, show what happens to the firm’s output choice and profit if the fixed cost of production increases from $50 to $100, and then to $150. What general conclusion can you reach about the effects of fixed costs on the firm’s output choice?The table below shows the firm’s revenue and cost information for Fixed Cost, FC of 50,100, and 150.With fixed costs of 100, the firm maximizes profit at 8 units of output. It also minimizeslosses with fixed costs of 150 at the same level. Fixed costs do not influence the optimalquantity, because they do not influence marginal cost.3. Suppose you are the manager of a watchmaking firm operating in a competitive market. Your cost of production is given by C = 100 + Q2, where Q is the level of output and C is total cost. (The marginal cost of production is 2Q. The fixed cost of production is $100.)a. If the price of watches is $60, how many watches should you produce to maximize profit?Profits are maximized where marginal cost is equal to marginal revenue. Here,marginal revenue is equal to $60; recall that price equals marginal revenue in acompetitive market:60 = 2Q, or Q = 30.b. What will the profit level be?Profit is equal to total revenue minus total cost:π = (60)(30) - (100 + 302) = $800.c. At what minimum price will the firm produce a positive output?A firm will produce in the short run if the revenues it receives are greater than its variablecosts. Remember that the firm’s short-run supply curve is its marginal cost curve abovethe minimum of average variable cost. Here, average variable cost is VCQQQQ ==2.Also, MC is equal to 2Q. So, MC is greater than AVC for any quantity greater than 0. This means that the firm produces in the short run as long as price is positive.4. Use the same information as in Exercise 1 to answer the following.a. Derive the firm’s short-run supply curve. (Hint: you may want to plot the appropriate costcurves.)The firm’s short-run supply curve is its marginal cost curve above average variable cost.The table below lists marginal cost, total cost, variable cost, fixed cost, and averagevariable cost.Q P TR TC MC TVC TFC AVC0 40 0 50 -50 ___ 0 50 ___1 40 40 100 -60 50 50 50 50.02 40 80 128 -48 28 78 50 39.03 40 120 148 -28 20 98 50 32.74 40 160 162 -2 14 112 50 28.05 40 200 180 20 18 130 50 26.06 40 240 200 40 20 150 50 25.07 40 280 222 58 22 172 50 24.68 40 320 260 60 38 210 50 26.3b. If 100 identical firms are in the market, what is the industry supply curve?For 100 firms with identical cost structures, the market supply curve is the horizontalsummation of each firm’s output at each price.Figure 8.4.b5. A sales tax of $1 per unit of output is placed on one firm whose product sells for $5 in a competitive industry.a. How will this tax affect the cost curves for the firm?With the imposition of a $1 tax on a single firm, all its cost curves shift up by $1.b. What will happen to the firm’s price, output, and profit in the short run?Since the firm is a price-taker in a competitive market, the imposition of the tax on onlyone firm does not change the market price. Since the firm’s short-run supply curve is itsmarginal cost curve above average variable cost and that marginal cost curve has shiftedup (inward), the firm supplies less to the market at every price. Profits are lower atevery quantity.c. What will happen in the long run?If the tax is placed on a single firm, that firm will go out of business.6. Suppose that a competitive firm’s marginal cost of producing output q is given byMC(q) = 3 + 2q. Assume that the market price of the firm’s product is $9:a. What level of output will the firm produce?To maximize profits, the firm should set marginal revenue equal to marginal cost. Giventhe fact that this firm is operating in a competitive market, the market price it faces isequal to marginal revenue. Thus, the firm should set the market price equal to marginalcost to maximize its profits:9 = 3 + 2q, or q = 3.Total revenue is price times quantity:TR = ($9)(3) = $27.Profit is total revenue minus total cost:= $27 - $21 = $6.Therefore, the firm is earning positive economic profits.8. A competitive industry is in long-run equilibrium. A sales tax is then placed on all firms in the industry. What do you expect to happen to the price of the product, the number of firms in the industry, and the output of each firm in the long run?With the imposition of a sales tax on all firms, the supply curve shifts up and a newequilibrium will result with a lower quantity and a higher price. This shift in supplyrepresents lower production for all firms.*9. A sales tax of 10 percent is placed on half the firms (the polluters) in a competitive industry. The revenue is paid to the remaining firms (the nonpolluters) as a 10 percent subsidy on the value of output sold.a. Assuming that all firms have identical constant long-run average costs before the sales tax-subsidy policy, what do you expect to happen to the price of the product, the output of each of the firms, and industry output, in the short run and the long run? (Hint: How does price relate to industry input?)The price of the product depends on the quantity produced by all firms in the industry.The immediate response to the sales-tax=subsidy policy is a reduction in quantity bypolluters and an increase in quantity by non-polluters. If a long-run competitiveequilibrium existed before the sales-tax=subsidy policy, price would have been equal tomarginal cost and long-run minimum average cost. For the polluters, the price after thesales tax is below long-run average cost; therefore, in the long run, they will exit theindustry. Furthermore, after the subsidy, the non-polluters earn economic profits thatwill encourage the entry of non-polluters. If this is a constant cost industry and the lossof the polluters’ output is compensated by an increase in the non-polluters’ output, theprice will remain constant.b. Can such a policy always be achieved with a balanced budget in which tax revenues are equal tosubsidy payments? Why? Explain.As the polluters exit and non-polluters enter the industry, revenues from pollutersdecrease and the subsidy to the non-polluters increases. This imbalance occurs whenthe first polluter leaves the industry and persist’s ever after.。