ICM_2010_翻译
2013美国赛 MCM-ICM 英语原文+翻译

2013 MCM ProblemsPROBLEM A: The Ultimate Brownie PanWhen baking in a rectangular(矩形的)pan heat is concentrated(集中)in the 4 corners and the product gets overcooked(焙烧过度)at the corners (and to a lesser extent(较小程度上) at the edges). In a round(圆)pan the heat is distributed evenly(均匀的)over the entire outer edge and the product is not overcooked at the edges. However, since most ovens(烤箱)are rectangular in shape using round pans is not efficient(高效)with respect to(关于)using the space in an oven. Develop a model to show the distribution(分布规律)of heat across the outer edge of a pan for pans of different shapes - rectangular to circular(圆形)and other shapes in between.Assume1. A width to length ratio(···比)of W/L for the oven which is rectangular in shape.2. Each pan must have an area of A.3. Initially two racks in the oven, evenly spaced(均匀分布).Develop a model that can be used to select the best type of pan (shape) under the following conditions(条件):1. Maximize number of pans(平底锅)that can fit in the oven (N)2. Maximize even distribution (均匀分布)of heat (H) for the pan3. Optimize(最优化)a combination of (···的综合)conditions (1) and (2) where weights p and (1- p) are assigned to(被分配···)illustrate(阐明)how the results vary with different values of W/L and p.In addition to your MCM formatted solution, prepare a one to two page advertising sheet for the new Brownie Gourmet Magazine highlighting(使··突显出来)your design and results.在矩形烤盘烘焙的时候,热量会被集中到4个角,食物会被烘焙过度(热量较小程度上在边缘)。
2011 ICM翻译
2011The Interdisciplinary Contest in Modeling (ICM)How environmentally and economically sound are electric vehicles?Is their widespread use feasible and practical?电动车在环保和经济方面的可信程度?他们的普遍使用是可行且实用的吗?Here are some issues to consider, but, of course, there are many more, and you will not be able to consider all the issues in your model(s):下面的话题讨论一部分即可,讨论的问题并不限定于下面这些话题•Would the widespread use of electric vehicles actually save fossil fuels or would wemerely be trading one use of fossil fuel for another given that electricity is currentlymostly produced by burning fossil fuels? What conditions would need to be put in placeto maximize the savings through use of electric vehicles?电动车的广泛使用真的会节省化石能源么,还是说我们仅仅在以化石能源的代价来消耗其他化石能源,毕竟目前电力的产生主要是燃烧化石燃料产生的•Consider how much the amount of electricity generated by alternatives such as wind and solar would need to climb during the twenty-first century to make the widespread use ofelectric vehicles feasible and environmentally beneficial. Assess whether or not theneeded growth of these alternate sources of electricity is likely and possible.考虑一下,如果需要climb在二十一世以环境友好并且可行的方式广泛使用电动车,需要替代品(如风力和太阳能)产生多少电量。
2010年考研英语阅读理解部分翻译

但为君故系列
C 优质报纸能保留大量的读者。 D 年轻的读者怀疑评论文章是否适合刊登在日报上 22. 二战之前,英国报纸评论的主要特点是 A 自由的主题。 B 风格随意 C 布局精心 D 观点激进 23. Shaw 和 Newsman 最有可能同意下列哪种说法 A 实现新闻业的目标是作家的责任 B 作家成为新闻工作者是鄙视的 C 作家可能被吸引到新闻工作中去 D 并不是所有作家都能胜任新闻工作 24. 从最后两端可以获知 Cardus 的那些信息 A 他的音乐评论也许不再吸引现在的读者 B 他作为音乐评论家的声誉一致备受争议 C 他的风格主要迎合现代专业人士的口味 D 他的作品未能跟上业余传统 25. 本文最好的标题是 A 过去美好时光中的报纸 B 报纸中消失的视角 C 新闻界令人悲哀的衰退 D 记忆中的杰出评论家
但为君故系列
3
得商业方法专利文件以几何数级增加, 起初只是一些新兴的网络公司对于某些特 定类型的在线交易系统试图争取独家专有权。后来,更多的公司竞相添加这样的 专利权,希望这样一个防御性的行为可以先下手为强。2005 年,IBM 公司在一 份法院报告中声称:尽管怀疑这种专利授权的法律基础,但它已经申请了 300 多份商业方法专利。同样,当一些华尔街投资公司出席某些反对其金融产品的法 庭案件时,他们会给其各类金融产品申请专利来作为自己的维权武器。 前面提到的 Bilski 案例牵扯到一份已申请的方法专利,即关于能源市场的风 险规避方法(注:也可译为“套期保值或对冲风险” ) 。上诉法院罕见地裁定,该 案件将不由三位法官听审,而是由全部十二名法官共同进行。另外,上诉法院还 宣布,它想探讨的另一件事情是是否应该“重审”道富银行的裁决。 联邦巡回法院的这一裁决效仿了最高法院。 最高法院最近做出了一系列的判 决,缩小了专利持有者的受保范围。例如,去年四月,法官们认定太多的专利授 予了一些显而易见的“发明” 。乔治华盛顿大学法律学院的专利法律师 Harold C. Wegner 教授表示, “联邦巡回法院的法官们正在对最高法院的反专利动态做出反 应” 。 26. 商业方法专利权最近备受关注因为 A 他们对商业的价值有限 B 他们与资产配置有关系 C 他们的授予可能受到限制 D 他们的获批引起争议 27. 下面对于“美国道富银行案”的叙述中,哪一项是正确的 A 对该案件的裁决与法院的决议一致 B 该案件涉及一笔很大的商业交易 C 该案件已经被联邦巡回法院驳回 D 该案件有可能改变美国的法律惯例 28. “about-face”(第三段第一行)的意思最有可能是 A 善意缺失 B 敌意增加 C 态度改变 D 尊严提升 29. 由最后两段我们可以知道,商业方法专利权 A 不会受到法律挑战的影响 B 经常没必要的签发 C 降低对专利持有人的尊重 2016 硕 士 研 究 生 入 学 考 试 但为君故
2015 ICM—C题目翻译
2015 ICMProblem CBuilding an organization filled with good, talented, well-trained people is one of the keys to success.建立一个充满优秀,有才华的,训练有素的员工的组织是成功的关键之一。
But to do this, an organization needs to do more than recruit and hire the best candidates –they also need to retain good people, keep them properly trained and placed in proper positions, and eventually target new hires to replace those leaving the organization.但要做到这一点,一个组织不仅仅要做到招募和聘用最优秀的候选人,他们还需要保留优秀人才,使他们保持合适地训练并放置在适当的位置,最终目标是用新员工来取代那些离开组织的成员。
Individuals play unique roles within their organizations, both formally and informally.每个人都在他们的组织中扮演独特的角色,不论是正式还是非正式的。
Thus, the departure of individuals from an organization leaves important informational and functional components missing that need to be replaced.因此,个体从的离开使一个组织的重要的信息和功能组件缺失,而这些都需要及时更换。
This is true for sports teams, commercial companies, schools and universities, governments, and almost any formal group or organization of people.这适用于体育团队、商业公司、学校和大学、政府、和几乎任何正式的团体或组织。
ICM_2010

2010 IeM ProblemThe Great Pacific Ocean Garbage PatchRecently, there has been considerable news coverage of the "Great Pacific Ocean Garbage Patch." Seethe following:/20091l1/ 10/ sciencell Opatch.html? em/program/archives/200907314/article/idUSTRE57R05E20090828Based on recent scientific expeditions into the Pacific Ocean Gyre (a convergence zone where debris is accumulating), a wide variety of technical and scientific problems associated with this debris mass are coming to light. While dumping waste into the ocean is not a new activity, the scientific community's realization that much of the debris (plastics, in particular) are accumulating in high densities over a large area of the Pacific Ocean is new. The scientific community also is learning that this debris creates many potential threats to marine ecology, and, therefore, to human well-being. Those who study this accumulation often describe it as plastic soup or confetti.See.;.../news/2009/09/photogalleries/pacific-garbage-patch-pictures/ This year's ICM problem uses interdisciplinary modeling to addresses the complex issues stemming from the presence and accumulation of ocean debris, in order to help researchers and ultimately government policy makers to understand the severity, range, and potential global impact of the situation.As modeling advisors to the expedition, your job is to focus on one element of this debris problem, model and analyze its behavior, and determine its potential effect on marine ecology and the government policies and practices that should be implemented to ameliorate its negative effects. Be sure to consider needs for future scientific research and the economic aspects of the problem, and then write a report to your expedition leader summarizing your findings and proposals for solutions and needed policies and practices. Some of the possible issues/questions you could investigate with your model include:l. What are the potential short- and long-term effects of the plastic on the ocean environment? What kind of monitoring is required to track the impact on the marine ecosystem? Be sure to account for temporal and spatial variability. What are the associated resourcing requirements?2. How can the extent, density and distribution of the plastic in the gyre be best understood and described?What kind of monitoring plan is required to track the growth/decay/movement of the plastics, andwhat kind ofresourcing is required to implement that plan?3. What is the nature or mechanism of the photo degradation of the plastic and its composition as it entersthe ocean and accumulates in the gyre? (For example, we are amazed to find that the particles ofdegraded plastic tend to reach a similar size.)4. Where does the plastic come from and what steps can be taken to control or reduce the risks associatedwith this situation? What are the economic costs and the economic benefits of controlling orending the situation, and how do they compare? How much plastic is manufactured, discarded,and recycled? How much of that is likely to go into the ocean? How much of that is likely tofloat?5. Could similar situations develop in other places in the oceans? What should we monitor and how?What is happening in the North Atlantic Gyre and the Alaskan Gyre? Use your model to estimate the plastic density in the future in the southern gyres (South Atlantic, South Pacific)?6. What is the immediate impact of banning polystyrene takeout containers? (See:http://bit.ly/5koJHB) What is the impact over 10-50 years?7. Any other scientific/technological issue associated with this situation is also acceptable, as long asmodeling is an important component of your investigation and analysis.To clarify your task, focus on one critical aspect of this problem and model the behavior of the important matters or phenomena. Specify the quantities that are of greatest present or future interest to the one aspect you choose to model and analyze. Your ICM report should be in the form of a ten-page team report to an expedition leader who has asked you to help her identify the relevant behaviors of the matters and phenomena under consideration, provide the analysis for impact of the behavior of those matters or phenomena, and advise her on the government's potential to act on the problem to improve this situation before it worsens.The following files contain some helpful data:CountDensity1999-2009.pdf; Moore 2001.pdf; Yamashita 2007.pdfHere are some suggested papers you can use to inform your model formulation and obtain more data:Note: As a reminder, it is best to stick to the scientific literature, not the media coverage, for your facts. The mainstream media coverage of this issue has been misleading in many cases. For further explanation, see: /2009I1l / l3/millions- billions- trillions-of-scientific-errors- in- the- nyt/ Committee on the Effectiveness ofInternational and National Measures to Prevent and Reduce Marine Debris and Its Impacts (National Research Council). (2009). Tackling Marine Debris in the 21stCentury, National Academies Press, Washington D.C.Dameron, O.J., Parke, M., Albins M.A., and Brainard R. (2007). Marine debris accumulation in the Northwestern Hawaiian Islands: An examination of rates and processes. Marine Pollution Bulletin,54:423--433.Derraik, J.G.B. (2002). The pollution of the marine environment by plastic debris: a review. Marine Pollution Bulletin, 44:842-852.Matsumura, S., and Nasu, K. (1997). Distribution of floating debris in the north Pacific Ocean: sighting surveys 1986-l99l. In: Coe, J. and Rogers, D. (eds.). Marine Debris: Sources, Impacts and Solutions.Springer, New York, pp. 15-24.Moore, C.J., Moore, S.L., Leecaster, M.K., and Weisberg, S.B. (2001). A comparison of plastic and plankton in the North Pacific central gyre. Marine Pollution Bulletin, 42: l297-l300.Pichel, W.G., Churnside, J.H., Veenstra, T.S., Foley, D.G., Friedman, K.S., Brainard, R.E., Nicoll, J.B., Zheng, Q., and Clemente-Colon, P. (2007). Marine debris collects within the North Pacific SubtropicalConvergence Zone. Marine Pollution Bulletin, 54:l207-l2ll.Robards, M.D., Gould, P., Platt, J. (1997). The highest global concentrations and increased abundance of oceanic plastic debris in the North Pacific: evidence from seabirds. In: Coe J. and Rogers, D. (eds.) Marine Debris: Sources, Impact and Solutions. Springer, New York, pp. 15-24.Venrick, E.L., Backman, T.W., Bartram, W.C., Platt, C.J., Thornhill, M.S., and Yates, R.E. (1973). Manmade objects on the surface of the central north pacific ocean. Nature, 241 :271-271.Yamashita, R., Tanimura, A. (2007). Floating plastic in the Kuroshio Current area, western North Pacific Ocean. Marine Pollution Bulletin, 54:485-488.150"W 140"W120"W1100WBOONSOON400N• ••300N••• •• ••• •••• • • • • •• •...• ,.• •• • • •• • •• • o~ •• g.·e·• o 0 •••••o• •.......... : .,.,,, •....0,,>HawaiiG •• ••• • '-.Data Sources: AMRF,ESRIMap prepared by Ann Zellers and Matthew Knell 3/31/09Projection: WGS1984o200 400 600 800 1,000 _C::: •• _-===-_-==:::JMilesCount Densities of Plastic Debris from Ocean Surface SamplesNorth Pacific Gyre 1999 - 2008e PergamonMarine Pollution Bulletin Vol. 42, No. 12, pp. 1297-1300,2001 © 2001Elsevier Science Ltd. All rights reservedPrinted in Great Britain 0025-326XjOI$ - see front matter PH: S0025-326X(01)00114-XA Comparison of Plastic and Plankton in the North Pacific Central GyreC. J. MOOREt*, S. L. MOOREt, M. K. LEECASTERt,l and S. B. WEISBERGtt Algalita Marine Research Foundation, 345 Bay Shore Avenue, Long Beach, CA 90803, USAtSouthern California Coastal Water Research Project, 7171 Fenwick Lane, Westminster, CA 92683, USAThe potential for ingestion of plastic particles by open ocean filter feeders was assessed by measuring the relative abundance and mass of neustonic plastic and zooplankton in surface waters under the central atmospheric highpressure cells of the North Pacific Ocean. Neuston samples were collected at 11 random sites, using a manta trawl lined with 333 u mesh. The abundance and mass of neustonic plastic was the largest recorded anywhere in the Pacific Ocean at 334271 pieces km2 and 5114 g km", respectively. Plankton abundance was approximately five times higher than that of plastic, but the mass of plastic was approximately six times that of plankton. The most frequently sampled types of identifiable plastic were thin films, polypropylene/monofilament line and unidentified plastic, most of which were miscellaneous fragments. Cumulatively, these three types accounted for 98% of the total number of plastic pieces. © 2001 Elsevier Science Ltd. All rights reserved.Keywords: North Pacific central gyre; neuston; plastics; zooplankton; debris; pollution monitoring.Marine debris is more than an aesthetic problem, posing a danger to marine organisms through ingestion and entanglement (Day, 1980; Balazs, 1985; Fowler, 1987; Ryan, 1987; Robards, 1993; Bjorndal et al., 1994; Laist, 1997). The number of marine mammals that die each year due to ingestion and entanglement approaches 100000 in the North Pacific Ocean alone (Wallace, 1985). Worldwide, 82 of 144 bird species examined contained small debris in their stomachs, and in many species the incidence of ingestion exceeds 80% of the individuals (Ryan, 1990). In addition, a recent study has determined that plastic resin pellets accumulate toxic chemicals, such as PCBs, DDE, and nonylphenols, and may serve as a transport medium and source of toxins to marine organisms that ingest them (Mato et al., 2001).Many studies have focused on the ingestion of small debris by birds because their stomach contents can be regurgitated by researchers in the field without causing*Corresponding author.1 Present address: INEEL, Bechtel WBXT, Idaho, LLC, P.O. Box 1625, Idaho Falls, ID 83415-3779, USA. harm to the animal. Less well studied are the effects of ingestible debris on fish, and no studies have been conducted on filter-feeding organisms, whose feeding mechanisms do not permit them to distinguish between debris and plankton. Moreover, no studies have compared the amount of neustonic debris to that of plankton to assess the potential effects on filter feeders.Concerns about the effects of neustonic debris in the marine environment are greatest in oceanographic convergences and eddies, where debris fragments naturally accumulate (Shaw and Mapes, 1979; Day, 1986; Day and Shaw, 1987). The North Pacific central gyre, an area of high atmospheric pressure with a clockwise ocean current, is one such area of convergence that forces debris into a central area where winds and currents diminish. This study compares the abundance and mass of neustonic debris with the amount of zooplankton in this area.Materials and MethodsEleven neuston samples were collected between August 23 and 26, 1999, from an area near the central pressure cell of the North Pacific sub tropical high (Fig. 1). Sampling sites were located along two transects: a westerly transect from 35°45.8'N, 138°30.7'W to 36°04.9'N, 142°04.6'W; and a southerly transect from 36°04.9'N, 142°04.6'W to 34°40.0'N. Location along the transect and trawl duration were selected randomly. Samples were collected using a manta trawl with a rectangular opening of 0.9 x 0.15 m", and a 3.5 m long, 333 u net with a 30 x 10 em? collecting bag. The net was towed at the surface outside of the effects of port wake (from the stern of the vessel) at a nominal speed of 1 m S-I; actual speed varied between 0.5 and 1.5 m S-I, as measured with a B&G paddlewheel sensor. Each trawl was conducted for a random distance, ranging from 5 to 19 km. Sampling was conducted as the ship moved along the transect with an approximately even split of sampling between daylight and night-time hours. Estimates of plastic and plankton per square kilometer were obtained by using the width of the trawl net opening times the length of the trawl.Samples were fixed in 5% formalin, then soaked in fresh water and transferred to 50% isopropyl alcohol.1297Marine Pollution BulletinFig. 1 Location of sampling area in the North Pacific gyre.Abundance (pieces km") by type and size of plastic pieces and tar found in the North Pacific gyre. Fragments Styrofoam Pellets Polypropylene/ Thin plastic Miscellaneouspieces monofilament filmsTar UnidentifiedTotal1931 84 36 16811 5322 217 350 24764 4502 121 471 4839 9631 97 36 19696 61187 1593 12 9969 40622 833 72 114288 55780 591 0 2933 26273 278 48 85903 45196 567 12 1460 10572 121 0 57928 26888 338 0 845 3222 169 229 31692 195484329553136857956421714736334270To separate the plastic particles from living tissue, the samples were drained and put in seawater, which floated most of the plastic to the surface, leaving the living tissue at the bottom. Top and bottom portions were inspected under a dissecting microscope. Intermixed plastic was removed from the tissue fraction and tissue was removed from the plastic fraction and placed in the appropriate containers. Plankton were counted and identified to class.Plastic was sorted by rinsing through Tyler sieves of 4.76, 2.80, 1.00, 0.71, 0.50, and 0.35 mm. Plastic and plankton were oven dried at 65°C for 24 h and weighed. Individual pieces of plastic were categorized into standardized categories by type (fragment, Styrofoam fragment, pellet, polypropylene/monofilament line fragment, thin plastic films), and one nonplastic category (tar); then they were counted.ResultsA total of 27698 small pieces of plastic weighing 424 g were collected from the surface water at stations in theMesh-size (mm)>4.7604.759-2.800 2.799-1.000 0.999-D.710 O. 709-D. 5000.499-D.355Totalgyre, yielding a mean abundance of 334271 pieces km 2 and a mean mass of 5114 gjkm 2. Abundance ranged from 31982 pieces km 2 to 969777 pieces/kin", and mass ranged from 64 to 30169 g km/.A total of 152244 planktonic organisms weighing approximately 70 g were collected from the surface water, with a mean abundance of 1837342 organisms km 2 and mean mass of 841 gjkm2 (dry weight). Abundances ranged from 54003 organisms km 2 to 5076403 organisms km", and weights ranged from 74 to 1618 g/km".Plastic fragments accounted for the majority of the material collected in the smaller size categories (Table 1). Thin plastic films, such as those used in sandwich bags, accounted for half of the abundance in the second largest size category, and pieces of line (polypropylene and monofilament) comprised the greatest fraction of the material collected in the largest size category.Plankton abundance was higher than plastic abundance in 8 out of 11 samples, with the difference being higher at night (Fig. 2). In contrast, the mass of plastic was higher than the plankton mass in 6 out of 11 samples. The ratio of plastic-to-plankton mass was higherTABLE 11298Volume 42/Number 12/December 2001} 3x10⁶~ O J.5.:z:::2x10⁶ ·iii c;OJoc; '"~ 1x1061200010000"E 8000"".9"' 6000"''" ::;: c:'"" 4000 ::;:20004x106_ Plankton =PlasticNight DayFig. 2 Abundance and mass of plankton and plastic in night versus daysamples.NightDayduring the day than at night, although much of the difference during the day was due to a plastic bottle being caught in one daylight sample and 1 m of polypropylene line being caught in the other.DiscussionThe mean abundance and weight of plastic pieces calculated for this study are the largest observed in the North Pacific Ocean. Previous studies have estimated mean abundances of plastic pieces ranging from 3370 to 96100 pieces km 2 and mean weights ranging from 46 to 1210 g km 2 (Day and Shaw, 1987). The highest previous single sample abundance and weight recorded for the North Pacific Ocean was taken from an area about 500 miles east of Japan. At 316800 pieces km 2 and 3492 g km 2 (Day et al., 1990), the abundance and weight are three and seven times less than the highest sample recorded in this study, respectively.Several possible reasons are suggested for the high abundance found in this study. The first is the location of our study area, which was near the central of the North Pacific subtropical high pressure cell. Previous studies in the North Pacific Ocean were conducted without reference to the central pressure cell (Day et al., 1990), which should serve as a natural eddy system to concentrate neustonic material including plastic. However, while previous studies did not focus on the subtropical high, many studies were conducted as transects that passed through the gyre (Day et al., 1986, 1988,1990). Thus, it is unlikely that location alone was the reason for the higher densities we observed, as Day et al. (1990) collected samples from the western part of this same area. An alternate hypothesis is that the amount of plastic material in the ocean is increasing over time, which Day and Shaw (1987) have previously suggested based upon a review of historical studies. Plastic degrades slowly in the ocean (Andrady, 1990; US EPA, 1992). While some of the larger pieces may accumulate enough fouling organisms to sink them, the smaller pieces are usually free of fouling organisms and remain afloat. Thus, new plastics added to the ocean may not exit the system once introduced unless they are washed ashore. Although numerous studies have shown that islands are repositories of marine debris (Lucas, 1992; Corbin and Singh, 1993; Walker et al., 1997), the North Pacific Ocean has few islands except near coastal boundaries. The dominant clockwise gyral currents also serve as a retention mechanism that inhibits plastics from moving toward mainland coasts. A recent surface current modeling study simulated that most of the particles from our sampling area should be retained there for at least 12 years (Ingraham et al., in press).The large ratio of plastic to plankton found in this study has the potential to affect many types of biota. Most susceptible are the birds and filter feeders that focus their feeding activities on the photic portion of the water column. Many birds have been examined and found to contain small debris in their stomachs, a result of their mistaking plastic for food (Day et al., 1985; Fry et al., 1987; Ainley et al., 1990; Ogi, 1990; Ryan, 1990; Laist, 1997). While no record was kept of the presence or absence of fouling organisms on plastic particles during sorting, a subsequent random sampling of each size class found 91.5% of the particles to be free of fouling organisms. As the size class decreased, there were fewer particles that showed evidence of fouling. Hence ingestion of plastic for its attached food seems unlikely, especially for organisms feeding on the surface. However, organisms such as the two filter-feeding salps (Thetys vagina) collected in this study which were found to have plastic fragments and polypropylene/monofilament line firmly embedded in their tissues, may have ingested the line at depth and utilized fouling organisms for food.Although our study focused on the neuston, samples also were collected from two oblique tows to a depth of 10 m. We found that the density of plastic in these areas was less than half of that in the surface waters and was primarily limited to monofilament line that had been fouled by diatoms and microalgae, thereby reducing its buoyancy. The smaller particles that have the greatest potential to affect filter feeders were even more reduced with depth, as should be expected because of their positive buoyancy and lack of fouling organisms, noted above.Several limitations restrict our ability to extrapolate our findings of high plastic-to-plankton ratios in the1299North Pacific central gyre to other areas of the ocean. The North Pacific Ocean is an area of low biological standing stock; plankton populations are many times higher in nearshore areas of the eastern Pacific, where upwelling fuels productivity (McGowan et al., 1996). Moreover, the gyre beneath the subtropic high probably serves to retain plastics, whereas plastics may wash up on shore in greater numbers in other areas. Conversely, areas closer to the shore are more likely to receive inputs from land-based runoff and ship loading and unloading activities, whereas a large fraction of the materials observed in this study appear to be remnants of offshore fishing-related activity and shipping traffic.The authors wish to thank the Algalita Marine Research Foundation for the use of its charter of the Oceanographic Research Vessel, ALGUITA. We thank Dr Curtis Ebbesmeyer (the Beachcombers' and Oceanographers' International Association), W. James Ingraham, Jr. (US National Oceanic and Atmospheric Administration), and Chuck Mitchell (MBC Applied Environmental Sciences) for their advice in the design and interpretation of the study. We thank the following individuals for their assistance in data collection: Mike Baker, John Barth, Robb Hamilton, and Steve McLeod. We also thank Ann Zellers for her help with sample processing. Ainley, D. G., Spear, L. B. and Ribic, C. A. (1990) The incidence of plastic in the diets of pelagic seabirds in the eastern equatorial Pacific region. In Proceedings of the Second International Conference on Marine Debris, eds. R. S. Shomura and M. L. Godfrey, pp. 653- 664. April 2-7, 1989. Honolulu, Hawaii. US Department of Commerce, NOAA Technical Memorandum NMFS, NOAA-TMNMFS-SWFC-154. Andrady, A. L. (1990) Environmental degradation of plastics under land and marine exposure conditions. In Proceedings of the Second International Conference on Marine Debris, eds. R. S. Shomura and M. L.Godfrey, pp. 848-869. April 2-7, 1989. Honolulu, Hawaii. US Department of Commerce, NOAA Technical Memorandum NMFS, NOAA-TM-NMFS-SWFC-154.Balazs, G. H. (1985) Impact of ocean debris on marine turtles: Entanglement and ingestion. In Proceedings of the Workshop on the Fate and Impact of Marine Debris, eds. R. S. Shomura and H. O. Yoshida, pp.387-429. US Department of Commerce, NOAA Technical Memorandum NMFS, NOAA-TM-NMFS-SWFC-54.Bjorndal, K. A., Bolton, A. B. and Lagueux, C. J. (1994) Ingestion of marine debris by juvenile sea turtles in coastal Florida habitats. Marine Pollution Bulletin 28, 154-158.Corbin, C. J. and Singh, J. G. (1993) Marine debris contamination of beaches in St. Lucia and Dominica. Marine Pollution Bulletin 26, 325-328.Day, R. H. (1980) The occurrence and characteristics of plastic pollution in Alaska's marine birds. M.S. Thesis, University of Alaska. Fairbanks, AK, 111 pp.Day, R. H. (1986) Report on the Cruise of the Pusan 851 to the North Pacific Ocean, July-August 1986. Final Report to National Oceanic and Atmospheric Administration, National Marine Fisheries Service, Auke Bay Laboratory. Auke Bay, AK, 93 pp.Day, R. H. (1988) Quantitative distribution and characteristics of neustonic plastic in the North Pacific Ocean. Final Report to US Department of Commerce, National Marine Fisheries Service, Auke Bay Laboratory. Auke Bay, AK, 73 pp.Day, R. H., Clausen, D. M. and Ignell, S. E. (1986) Distribution and Density of Plastic Particulates in the North Pacific Ocean in 1986.Submitted to the International North Pacific Fisheries Commission, Anchorage, Alaska, November 1986, 17 pp. Northwest and Alaska Fisheries Center, Nattional Marine Fisheries Services, National Oceanic Atmospheric Administration, Auke Bay Laboratory, P.O. Box 210155, Auke Bay, AK 99821.Marine Pollution Bulletin Day, R. H. and Shaw, D. G. (1987) Patterns in the abundance of pelagic plastic and tar in the North Pacific Ocean, 1976-1985. Marine Pollution Bulletin 18, 311-316.Day, R. H., Shaw, D. G. and Ignell, S. E. (1990) The quantitative distribution and characteristics of neuston plastic in the North Pacific Ocean, 1984-1988. In Proceedings of the Second International Conference on Marine Debris, eds. R. S. Shomura and M. L. Godfrey, pp. 247-266. April 2-7, 1989. Honolulu, Hawaii. US Department of Commerce, NOAA Technical Memorandum NMFS, NOAA-TM-NMFS-SWFC-154.Day, R. H., Wehle, D. H. S. and Coleman, F. C. (1985) Ingestion of plastic pollutants by marine birds. In Proceedings of the Workshop on the Fate and Impact of Marine Debris, eds. R. S. Shomura and H. O.Yoshida, pp. 344-386. US Department of Commerce, NOAA Technical Memorandum NMFS, NOAA-TM-NMFS-SWFC-54. Fowler, C. W. (1987) Marine debris and northern fur seals: a case study.Marine Pollution Bulletin 18, 326-335.Fry, D. M., Fefer, S.l. and Sileo, L. (1987) Ingestion of plastic debris by Laysan albatrosses and wedge-tailed shearwaters in the Hawaiian Islands. Marine Pollution Bulletin 18, 339-343.Ingraham, W. James Jr. and Curtis Ebbesmeyer (in press). In Proceedings of the Fourth Marine Debris Conference. Honolulu, HI, August 7-11, 2000. NOAA-National Ocean Survey, National Marine Sanctuary, Technical Memorandum.Laist, D. W. (1997) Impacts of marine debris: entanglement of marine life in marine debris including a comprehensive list of species with entanglement and ingestion records. In Marine Debris: Sources. Impacts.and Solutions., eds. J. M. Coe and D. B. Rogers, pp. 99- 140. Springer.New York.Lucas, Z. (1992) Monitoring persistent litter in the marine environment on Sable Island, Nova Scotia. Marine Pollution Bulletin 24, 192-199. Mato, Y, Isobe, T., Takada, H., Kanehiro, H., Ohtake, C. and Kaminuma, T. (2001) Plastic resin pellets as a transport medium for toxic chemicals in the marine environment. Environmental Science Technology 35,318-324.McGowan, J. A., Chelton, D. B. and Conversi, A. (1996) Plankton patterns, climate and change in the California Current. California Cooperative Oceanic Fisheries Investment Report 37, 45-68.Ogi, H. (1990) Ingestion of plastic particles by sooty and short-tailed shearwaters in the North Pacific. In Proceedings of the Second International Conference on Marine Debris, eds. R. S. Shomura and M. L.Godfrey, pp. 635-652. April 2-7, 1989. Honolulu, Hawaii. US Department of Commerce, NOAA Technical Memorandum NMFS, NOAA-TM-NMFS-SWFC-154.Robards, M. D. (1993) Plastic Ingestion by North Pacific Seabirds. US Department of Commerce, NOAA-43ABNF203014, Washington, DC. Ryan, P. G. (1987) The effects of ingested plastic on seabirds: correlations between plastic load and body condition. Environmental Pollution 46, 119-125.Ryan, P. G. (1990) The effects of ingested plastic and other marine debris on seabirds. In Proceedings of the Second International Conference on Marine Debris, eds. R. S. Shomura and M. L. Godfrey, pp. 623-634.April 2-7, 1989. Honolulu, Hawaii. US Department of Commerce, NOAA Technical Memorandum, NMFS, NOAA-TM-NMFS-SWFC-154.Shaw, D. G. and Mapes, G. A. (1979) Surface circulation and the distribution of pelagic tar and plastic. Marine Pollution Bulletin 10, 160-162.U.S. Environmental Protection Agency (US EPA) (1992) Plastic Pellets in the Aquatic Environment: Sources and Recommendations. Washington, DC, EPA 842-B-92-01O.Wallace, N. (1985) Debris entanglement in the marine environment: a review. In Proceedings of the Workshop on the Fate and Impact of Marine Debris, eds. R. S. Shomura and H. O. Yoshida, pp. 259- 277. US Department of Commerce, NOAA Technical Memorandum, NMFS, NOAA-TM-NMFS-SWFC-54.Walker, T. R., Reid, K., Arnould, J. P. Y. and Croxall, J. P. (1997) Marine debris surveys at Bird Island, South Georgia 1990-1995. Marine Pollution Bulletin 34, 61-65.1300。
ICM_2009翻译
2009ICM:交叉学科建模竞赛创建食物系统:调整人类影响的生态系统平衡技术背景只有不到1%的海底被珊瑚覆盖。
然而,25%的海洋生物多样性需要在这样的环境下生存。
因此,自然资源保护论者担心一旦珊瑚消失,该地区的生物多样性也会随之消失。
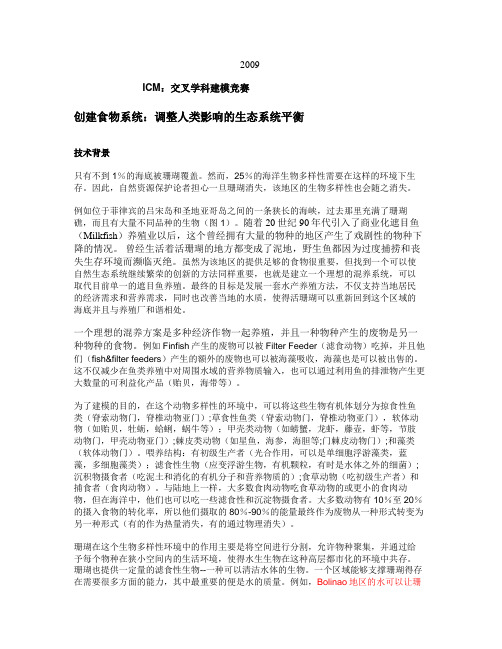
例如位于菲律宾的吕宋岛和圣地亚哥岛之间的一条狭长的海峡,过去那里充满了珊瑚礁,而且有大量不同品种的生物(图1)。
随着20世纪90年代引入了商业化遮目鱼(Milkfish)养殖业以后,这个曾经拥有大量的物种的地区产生了戏剧性的物种下降的情况。
曾经生活着活珊瑚的地方都变成了泥地,野生鱼都因为过度捕捞和丧失生存环境而濒临灭绝。
虽然为该地区的提供足够的食物很重要,但找到一个可以使自然生态系统继续繁荣的创新的方法同样重要,也就是建立一个理想的混养系统,可以取代目前单一的遮目鱼养殖。
最终的目标是发展一套水产养殖方法,不仅支持当地居民的经济需求和营养需求,同时也改善当地的水质,使得活珊瑚可以重新回到这个区域的海底并且与养殖厂和谐相处。
一个理想的混养方案是多种经济作物一起养殖,并且一种物种产生的废物是另一种物种的食物。
例如Finfish产生的废物可以被Filter Feeder(滤食动物)吃掉,并且他们(fish&filter feeders)产生的额外的废物也可以被海藻吸收,海藻也是可以被出售的。
这不仅减少在鱼类养殖中对周围水域的营养物质输入,也可以通过利用鱼的排泄物产生更大数量的可利益化产品(贻贝,海带等)。
为了建模的目的,在这个动物多样性的环境中,可以将这些生物有机体划分为掠食性鱼类(脊索动物门,脊椎动物亚门);草食性鱼类(脊索动物门,脊椎动物亚门),软体动物(如贻贝,牡蛎,蛤蜊,蜗牛等);甲壳类动物(如螃蟹,龙虾,藤壶,虾等,节肢动物门,甲壳动物亚门);棘皮类动物(如星鱼,海参,海胆等;门棘皮动物门);和藻类(软体动物门)。
喂养结构:有初级生产者(光合作用,可以是单细胞浮游藻类,蓝藻,多细胞藻类);滤食性生物(应变浮游生物,有机颗粒,有时是水体之外的细菌); 沉积物摄食者(吃泥土和消化的有机分子和营养物质的);食草动物(吃初级生产者)和捕食者(食肉动物)。
美国(MCM)(ICM)试题(96年-09年)(英文版)
美国大学生数学建模竞赛试题1996 American MCM Problems Problem AThe world's oceans contain an ambient noise field. Seismic disturbances, surface shipping, and marine mammals are sources that, in different frequency ranges,contribute to this field. We wish to consider how this ambient noise might be used to detect large moving objects, e.g., submarines located below the ocean surface. Assuming that a submarine makes no intrinsic noise, developa method for detecting the presence of a moving submarine, its size, and its direction of travel, using only information obtained by measuring changes to the ambient noise field. Begin with noise at one fixed frequency and amplitude.Problem BWhen determining the winner of a competition like the Mathematical Contest inModeling, there are generally a large number of papers to judge. Let's saythere are P=100 papers.A group of J judges is collected to accomplish thejudging. Funding for the contest constains both the number of judges that canbe obtained and amount of time that they can judge. For eample if P=100, thenJ=8 is typical.Ideally, each judge would read paper and rank-order them, but there are toomany papers for this. Instead, there will be a number of screening rounds inwhich each judge will read some number of papers and give them scores. Thensome selection scheme is used to reduce the number of papers under consideration: If the papers are rank-ordered, then the bottom 30% that eachjudge rank-orders could be rejected. Alternatively, if the judges do not rank-order, but instead give them numerical score (say, from 1 to 100),then all papers below some cut-off level could be rejected.The new pool of papers is then passed back to the judges, and the process is repeated.A concern is then the total number of papers that judge reads must besubstantially less than P. The process is stopped when there are only W papersleft. There are the winners. Typically for P=100, W=3.Your task is to determine a selection scheme, using a combination of rank-ordering, numerical scoring, and other methods, by which the final Wpapers will include only papers from among the "best" 2W papers. (By "best",we assume that there is an absolute rank-ordering to which all judges wouldagree.) For example, the top three papers. Among all such methods, the one thatrequired each judge to read the least number of papers is desired.Note the possibility of systematic bias in a numerical scoring scheme. For example, for a specific collection of papers, one judge could average 70points, while another could average 80 points. How would you scale your schemeto accommodate for changes in the contest parameters (P, J, and W)?1997 American MCM ProblemsProblem A The Velociraptor ProblemThe velociraptor,Velociraptor mongoliensis, was a predatory dinosaur that lived during the late Cretaceous period, approximately 75 million years ago. Paleontologists think that it was a very tenacious hunter, and may have hunted in pairs or largerpacks .Unfortunately, there is no way to observe its hunting behavior in the wild as can be done with modern mammalian predators. A group of paleontologists has approached your team and asked for help in modeling the hunting behavior of the velociraptor. They hope to compare your results with field data reported by biologists studying the behaviors of lions, tigers, and similar predatory animals.The average adult velociraptor was 3 meters long with a hip height of 0.5 meters and an approximate mass of 45 kg. It is estimated that the animal could run extremely fast at speed of 60 km/hr for about 15 seconds. After the initial burst of speed ,the animal needed to stop and recover from a buildup of lactic acid in its muscles.Suppose that velociraptor preyed on Thescelosaurus neglectus, a herbivorous biped approximately the same size as the Velociraptor. A biomachanical analysis of a fossilized Thescelosaurus indicates that it could run at a speed of about 50 km/hr. for long period of time.Part1Assuming the velociraptor is a solitary hunter, design a mathematical model that describe a hunting strategy for a single velociraptor stalking and chasing a single Thescelosaurus as well as the evasive strategy of the prey. Assume that the Thescelosaurus can always detect the velociraptor when it comes within 15 meters .but may detect the predator at even greater ranges (up to 50 meters depending upon the habitat and weather conditions. Additionally ,due to its physical structure and strength, the velociraptorhas a limited turning radius when running at full speed. This radius is estimated to be three times the animal's hip height. On the other hand, the Thescelosaurus is extremely agile and has a turning radius of 0.5 meters.Part2Assuming more realistically that the velociraptor hunted in pairs, design a new model that describes a hunting strategy for two velociraptor stalking and chasing a single Thescelosaurus as well as the evasive strategy of the prey. Use the other assumptions and limitations given in Part 1.Problem B Mix Well For Fruitful DiscussionsSmall group meeting for the discussions of important issues, particular long-range planning ,are gaining popularity. It is believed that large groups discourage productive discussion and that a dominant personality will usually control and direct the discussion. Thus ,in corporate board meetings the board will meet in small groups to discuss issues before meeting as a whole, these smaller groups still tun the risk of control by a dominant personality. In an attempt to reduce this danger it is common to schedule several sessions with a different mix of people in each group.A meeting of An Tostal Corporation will be attended by 29 Board Members of which nine are in-house members(i.e., corporate employees).The meeting is to be an all-day affair with three sessions scheduled for the morning and four for the afternoon. Each session will take 45 minutes, beginning on the hour from 9:00 A.M. to 4:00 P.M., with lunch scheduled at noon. Each morning session will consist of six discussion groups with each discussion group led by one of the corporation's six senior officers. None of these officers are board members. Thus each senior officers will not be involved in the afternoon sessions and each of these sessions will consist of only four different discussion groups.The president of the corporation wants a list of board-member assignment to discussion groups for each of the seven sessions. The assignments should achieve as much of a mix of the members as much as possible. The ideal assignment would have each board member in a discussion group the same number of times while minimizing common membership of groups for the different sessions.The assignment should also satisfy the following criteria:1.For the morning sessions ,no board member should be in the same senior officer's discussion group twice.2.No discussion group should contain a disproportionate number of in-house members.Give a list of assignments for members 1-9 and 10-29 and officers 1-6.Indicate how well the criteria in the previous paragraphs are met. Since it is possible that some board members will cancel at the last minute or that some not scheduled will show up, an algorithm that the secretary could use to adjust the assignments with an hour's notice would be appreciated. It would be ideal if the algorithm could also be used to make assignments for future meetings involving different levels of participation for each type of attendee.1998 American MCM ProblemsProblem A MRI ScannersIntroductionIndustrial medical diagnostic machines known as Magnetic Resonance Imager (MRI) scan a three-dimensional object such as a brain, and deliver their results in the form of a three-dimensional array of pixel. Each pixel consists of one number indicating a color or a shade of gray that encodes a measure of water concentration in a small region of the scanned object at the location of the pixel .For instance,0 can picture high water concentration in black (ventricles, blood vessels),128 can picture a medium water concentration in gray(brain nuclei and gray matter),and 255 can picture a low water density in white (liquid-rich white matter consisting of myelinated axons).Such MRI scanners also include facilities to picture on a screen any horizontal or vertical slice through the three-dimensional array (slices are parallel to any of the three Cartesian coordinate axes ).Algorithms for picturing slices through oblique planes ,however ,are proprietary .Current algorithms are limited in terms of the angles and parameter options available ;are implemented only on heavily used dedicated workstations ;lack input capabilities for marking points in the picture before slicing; and tend to blur and "feather out" sharp boundaries between the original pixels.A more faithful, flexible algorithm implemented on a personal computer would be useful.(1)for planning minimally invasive treatments,(2)for calibrating the MRI machines,(3)for investigating structures oriented obliquely in space, such as post-mortem tissue sections in a animal research,(4)for enabling cross-sections at any angle through a brain atlas consisting (4)for enabling cross-sections at any angle through a brain atlas consistingof black-and-white line drawingTo design such an algorithm, one can access the value and locations of the pixels, but not the initial data gathered by the scanners.ProblemDesign and test an algorithm that produces sections of three-dimensional arrays by planes in any orientation in space, preserving the original gray-scale value as closely as possible.Data SetsThe typical data set consists of a three-dimensional array A of numbers A(i,j,k) which indicates the density A(i,j,k) of the object at the location (x,y,z)i,j,k. Typically A(i,j,k) can range from 0 to 255.In most applications the data set is quite large.Teams should design data sets to test and demonstrate their algorithms. The data sets should reflect conditions likely Teams should design data sets to test and demonstrate their algorithms. The data sets should reflect conditions likely to be of diagnostic interest. Teams should also characterize data sets the limit the effectiveness of their algorithms.SummaryThe algorithm must produce a picture of the slice of the three-dimensional array by a plane in space. The plane can have any orientation and any location in space.(The plane can miss some or all data points.)The result of the algorithm should be a model of the density of the scanned object over the selected plane.Problem B Grade InflationBackgroundSome college administrators are concerned about the grading at A Better Class(ABC) college. On average, the faculty at ABC have been giving out high grades(the average grade now given out is an A-),and it is impossible to distinguish between the good and mediocre students .The terms of a very generous scholarship only allow the top 10% of the students to be funded, so a class ranking is required.The dean had the thought of comparing each student to the other students in each class ,and using this information to build up a ranking. For example, if a student obtains an A in a class in which all students obtain an A, then this student is only "average" in this class. On the other hand, if a student obtain the only A in a class, then that student is clearly "above average". Combining information from several classes might allow students to be placed in deciles (top 10%,next 10%,ect.)across the college.ProblemAssuming that the grades given out are(A+,A-,B+,B-,...)can the dean's idea be made to work?Assuming that the grades given out are only (A,B,C,...)can the dean's idea be made to work?Can any other schemes produce a desired ranking?A concern is that the grade in a single class could change many student's deciles. Is this possible?Data SetsTeams should design data sets to test and demonstrate their algorithms. Teams should characterize data sets that limit the effectiveness of their algorithms.Mathematical Contest in Modeling 1999 ProblemsProblem A - Deep ImpactFor some time, the National Aeronautics and Space Administration (NASA) has been considering the consequences of a large asteroid impact on the earth.As part of this effort, your team has been asked to consider the effects of such an impact were the asteroid to land in Antarctica. There are concerns that an impact there could have considerably different consequences than one striking elsewhere on the planet.You are to assume that an asteroid is on the order of 1000 m in diameter, and that it strikes the Antarctic continent directly at the South Pole.Your team has been asked to provide an assessment of the impact of such an asteroid. In particular, NASA would like an estimate of the amount and location of likely human casualties from this impact, an estimate of the damage done to the food production regions in the oceans of the southern hemisphere, and an estimate of possible coastal flooding caused by large-scale melting of the Antarctic polar ice sheet.Problem B - Unlawful AssemblyMany public facilities have signs in rooms used for public gatherings which state that it is "unlawful" for the rooms to be occupied by more than a specified number of people. Presumably, this number is based on the speed with which people in the room could be evacuated from the room's exits in case of an emergency. Similarly, elevators and other facilities often have "maximum capacities" posted.Develop a mathematical model for deciding what number to post on such a sign as being the "lawful capacity". As part of your solution discuss criteria, other than public safety in the case of a fire or other emergency, that might govern the number of people considered "unlawful" to occupy the room (or space). Also, for the model that you construct, consider the differences between a room with movable furniture such as a cafeteria (with tables and chairs), a gymnasium, a public swimming pool, and a lecture hall with a pattern of rows and aisles. You may wish to compare and contrast what might be done for a variety of different environments: elevator, lecture hall, swimming pool, cafeteria, or gymnasium. Gatherings such as rock concerts and soccer tournaments may present special conditions.Apply your model to one or more public facilities at your institution (or neighboring town). Compare your results with the stated capacity, if one is posted. If used, your model is likely to be challenged by parties with interests in increasing the capacity. Write an article for the local newspaper defending your analysis.2000 Mathematical Contest in ModelingProblem A Air traffic ControlDedicated to the memory of Dr. Robert Machol, former chief scientist of the Federal Aviation Agency To improve safety and reduce air traffic controller workload, the Federal Aviation Agency (FAA) is considering adding software to the air traffic control system that would automatically detect potential aircraft flight path conflicts and alert the controller. To that end, an analyst at the FAA has posed the following problems.Requirement A: Given two airplanes flying in space, when should the air traffic controller consider the objects to be too close and to require intervention?Requirement B: An airspace sector is the section of three-dimensional airspace that one air traffic controller controls. Given any airspace sector, how do we measure how complex it is from an air traffic workload perspective? To what extent is complexity determined by the number of aircraft simultaneously passing through that sector (1) at any one instant?(2) during any given interval of time?(3) during a particular time of day? How does the number of potential conflicts arising during those periods affect complexity?Does the presence of additional software tools to automatically predict conflicts and alert the controller reduce or add to this complexity?In addition to the guidelines for your report, write a summary (no more than two pages) that the FAA analyst can present to Jane Garvey, the FAA Administrator, to defend your conclusions.Problem B Radio Channel AssignmentsWe seek to model the assignment of radio channels to a symmetric network of transmitter locations over a large planar area, so as to avoid interference. One basic approach is to partition the region into regular hexagons in a grid (honeycomb-style), as shown in Figure 1, where a transmitter is located at the center of each hexagon.Figure 1An interval of the frequency spectrum is to be allotted for transmitter frequencies. The interval will be divided into regularly spaced channels, which we represent by integers 1, 2, 3, ... . Each transmitter will be assigned one positive integer channel. The same channel can be used at many locations, provided that interference from nearby transmitters is avoided. Our goal is to minimize the width of the interval in the frequency spectrum that is needed to assign channels subject to some constraints. This is achieved with the concept of a span. The span is the minimum, over all assignments satisfying the constraints, of the largest channel used at any location. It is not required that every channel smallerthan the span be used in an assignment that attains the span.Let s be the length of a side of one of the hexagons. We concentrate on the case that there are two levels of interference.Requirement A: There are several constraints on frequency assignments. First, no two transmitters within distance of each other can be given the same channel. Second, due to spectral spreading, transmitters within distance 2s of each other must not be given the same or adjacent channels: Their channels must differ by at least 2. Under these constraints, what can we say about the span in,Requirement B: Repeat Requirement A, assuming the grid in the example spreads arbitrarily far in all directions.Requirement C: Repeat Requirements A and B, except assume now more generally that channels for transmitters within distance differ by at least some given integer k, while those at distance at most must still differ by at least one. What can we say about the span and about efficient strategies for designing assignments, as a function of k?Requirement D: Consider generalizations of the problem, such as several levels of interference or irregular transmitter placements. What other factors may be important to consider?Requirement E: Write an article (no more than 2 pages) for the local newspaper explaining your findings.2001 Mathematical Contest in Modeling (MCM)Problem A: Choosing a Bicycle WheelCyclists have different types of wheels they can use on their bicycles. The two basic typesof wheels are those constructed using wire spokes and those constructed of a solid disk (see Figure 1) The spoked wheels are lighter, but the solid wheels are more aerodynamic.A solid wheel is never used on the front for a road race but can be used on the rear of the bike.Professional cyclists look at a racecourse and make an educated guess as to what kind of wheels should be used. The decision is based on the number and steepness of the hills, the weather, wind speed, the competition,and other considerations. The director sportif of your favorite team would like to have a better system in place and has asked your team for information to help determine what kind of wheel should be used fora given course.Figure 1: A solid wheel is shown on the left and a spoked wheel is shown on the right. The director sportif needs specific information to help make a decision and has asked your team to accomplish the tasks listed below. For each of the tasks assume that the same spoked wheel will always be used on the front butthere is a choice of wheels for the rear.Task 1. Provide a table iving the wind peed at which the power required for a solid rear wheel is less than for a spoked rear wheel. The table should include the wind speeds for different road grades starting from zero percent to ten percent in one percent increments. (Road grade is defined to be the ratio of the total rise of a hill divided by the length of the road. If the hill is viewed as a triangle, the grade is the sine of the angle at the bottom of the hill.) A rider starts at the bottom of the hill at a speed of 45 kph, and the deceleration of the rider is proportional to the road grade.A rider will lose about 8 kph for a five percent grade over 100 meters.Task 2. Provide an example of how the table could be used for a specific time trial courseTask 3. Determine if the table is an adequate means for deciding on the wheel configuration and offer other suggestions as to how to make this decision.Problem B: Escaping a Hurricane's Wrath (An Ill Wind...)Evacuating the coast of South Carolina ahead of the predicted landfallof Hurricane Floydin 1999 led to a monumental traffic jam. Traffic slowed to a standstill on Interstate I-26, which is the principal route going inland from Charleston to the relatively safe haven of Columbia in the center of the state. What is normally an easy two-hour drive took up to 18 hours to complete. Many cars simply ran out of gas along the way.Fortunately, Floyd turned north and spared the state this time, but the public outcry is forcing state officials to find ways to avoid a repeat of this traffic nightmare.The principal proposal put forth to deal with this problem is the reversalof traffic onI-26, so that both sides, including the coastal-bound lanes,have traffic headed inland from Charleston to Columbia. Plans to carry this out have been prepared (and posted on the Web)by the South Carolina Emergency Preparedness Division. Traffic reversal on principal roads leading inland from Myrtle Beach and Hilton Head is also planned.A simplified map of South Carolina is shown. Charleston has approximately 500,000 people, Myrtle Beach has about 200,000 people, and another 250,000 people are spread out along the rest of the coastal strip. (More accurate data,if sought, are widely available.)The interstates have two lanes of traffic in each direction except in the metropolitan areas where they have three. Columbia, another metro area of around 500,000 people, does not have sufficient hotel space to accommodate the evacuees (including some coming from farther northby other routes), so some traffic continues outbound on I-26 towards Spartanburg; on I-77 north to Charlotte; and on I-20 east to Atlanta. In 1999, traffic leaving Columbia going northwest was moving only very slowly. Construct a model for the problem to investigate what strategies may reduce the congestion observed in 1999. Here are the questions that need to be addressed:1.Under what conditions does the plan for turning the two coastal-bound lanes of I-26 into two lanes of Columbia-bound traffic, essentially turning the entire I-26 into one-way traffic, significantly improve evacuation traffic flow?2.In 1999, the simultaneous evacuation of the state's entire coastal region was ordered. Would the evacuation traffic flow improve under an alternative strategy that staggers the evacuation, perhaps county-by-county over some time period consistent with the pattern of how hurricanes affect the coast?3.Several smaller highways besides I-26 extend inland from the coast. Under what conditions would it improve evacuation flow to turn around traffic on these?4.What effect would it have on evacuation flow to establish more temporary shelters in Columbia, to reduce the traffic leaving Columbia?5.In 1999, many families leaving the coast brought along their boats, campers, and motor homes. Many drove all of their cars. Under what conditions should there be restrictionson vehicle types or numbers of vehicles brought in order to guarantee timely evacuation? 6.It has been suggested that in 1999 some of the coastal residents of Georgia and Florida, who were fleeing the earlier predicted landfalls of Hurricane Floyd to the south, came upI-95 and compounded the traffic problems. How big an impact can they have on the evacuation traffic flow? Clearly identify what measures of performance are used to compare strategies. Required: Prepare a short newspaper article, not to exceed two pages,explaining the results and conclusions of your study to the public.问题 A: 选择自行车车轮骑自行车的人有几种不同类型的车轮可以用在他们的自行车上。
INCOTERMS2010中文版
INCOTERMS2010中文版INCOTERMS 2010中文版1. 介绍INCOTERMS(国际贸易术语解释规则)是由国际商会(ICC)制定的国际贸易术语规则,用于明确买卖双方在国际货物运输中的责任和义务。
INCOTERMS 2010是由于全球贸易环境的变化而发布的最新版本,共有11个术语,用于规范国际货物交易的常用术语和惯例。
2. EXW(装货港交货)EXW意味着卖方将货物放置在指定的地点,由买方负责所有的运输安排和费用。
在这种术语下,卖方的义务非常有限,买方需要承担所有的进口手续、装卸费用和风险。
3. FCA(运费或运输人接收处交货)FCA表示卖方将货物交给指定的运输人或承运人。
卖方负责将货物交到指定地点,并承担出口清关手续。
买方需要负责进口清关手续、运输保险和费用。
4. CPT(运费支付到目的地)CPT意味着卖方负责将货物运输到目的地,并承担货物运输费用直到目的地。
买方需要负责货物的进口清关手续、保险费用和未列入卖方义务的其他费用。
5. CIP(运费和保险费支付到目的地)CIP与CPT类似,唯一的区别是卖方还需要承担货物运输保险费用。
买方需要负责货物的进口清关手续和未列入卖方义务的其他费用。
6. DAT(到岸价)DAT意味着卖方负责将货物交付到指定目的港口,并承担货物的进口清关手续和支付关税。
买方需要承担货物的卸载费用和将货物送到目的地的费用。
7. DAP(交货地点)DAP表示卖方负责将货物交付到约定的目的地,买方需要承担货物的进口清关手续、卸货费用和将货物送到目的地的费用。
8. DDP(已交税承担)DDP意味着卖方承担所有的责任和费用,包括货物运输、保险、清关和将货物交付到买方指定的目的地。
9. FAS(船上交货)FAS表示卖方将货物交交付给指定的港口,并承担将货物装上船的费用和风险。
买方需要负责运输、装卸费用和风险。
10. FOB(船上交货)FOB意味着卖方负责将货物交付给指定的港口,并承担将货物装上船的费用和风险。
INCOTERMS+2010+ENGLISH
November, 2010INCOTERMS 2010The new INCOTERMS 2010, published last 27 September 2010, will replace INCOTERMS 2000 with effect from 1 January 2011The ICC reviews INCOTERMS from time to time to ensure that they reflect and respond to current trade practices and trends. INCOTERMS 2010 will be the eighth revision of INCOTERMS since their inception in 1936. The reasons for such a review would be the spread of customs-free zones, the increase in use of electronic communications, concerns about security following 9/11 and latest developments in trade since the 2000 version, including the onward march of containerisation and point-to-point deliveriesAlthough these various changes have made some things clearer and easier in the rules, INCOTERMS 2010 also creates fresh obligations and requires greater collaboration between the parties.In addition to various amendments to the existing terms, m ain changes in INCOTERMS 2010 are:1.Removal of four terms from INCOTERMS 2000DDU (Delivered Duty Unpaid)DAF (Delivered At Frontier)DES (Delivered Ex Ship)DEQ (delivered Ex Quay)2.Introduction of two new terms∙DAT (Delivered At Terminal) which replaces DEQ (Delivered Ex Quay). Delivery under DAT will take place when the seller puts the goods at the disposal of thebuyer, unloaded at the named terminal.∙DAP (Delivered at Place) which should be used in place of DAF (Delivered At Frontier), DES (Delivered Ex Ship) and DDU (Delivered Duty Unpaid). Delivery underDAP will take place when the seller puts the goods at the disposal of the buyer at anamed place, on a vehicle ready for unloading (not unloaded).These two new rules should be more useful for container traffic as they are not restricted to maritime transport and may be used irrespective of the agreed mode of transport.3. Creation of two classes of INCOTERMS (rather than four categories)The 11 terms have been categorised under two categories:∙Deliveries by any mode of transport (sea, road, air, rail) - EXW, FCA, CPT, CIP, DAP, DAT and DDP. These may all be used where there is no maritime transport at all; and∙Deliveries by sea/inland waterway - FAS, FOB, CFR and CIF.This, again, is to make the new INCOTERMS 2010 easier to use.The new INCOTERMS 2010 are expressly stated to be for "both domestic and international trade" and require that both parties are obliged to provide all necessary information in order to obtain import/export clearance. The previous INCOTERMS did not require this degree of co-operation.It is also to be mentioned that the new INCOTERMS 2010 clarify who is responsible for terminal costs. It remains to be seen, however, whether this will put an end to the double charging previously experienced.As far as the application of the new INCOTEMS 2010 is concerned, the rules are that for existing contracts, INCOTERMS 2000 will continue to apply even if performance of the contract will be made in 2011. For contracts entered into between September 2010-January 2011, parties should expressly say which set of INCOTERMS is to apply and after 1 January 2011, it will be assumed any reference to "INCOTERMS" in new contracts is a reference to INCOTERMS 2010.SAN SIMON, DUCH & CO.sansimonduch@。
ICM与隐显翻译
ICM与隐显翻译周雪婷;潘依婷【摘要】ICM(理想化认知模型)是认知语言学中的一个重要术语,被广泛而有效地应用于文本理解的研究中。
以文本理解为基础,创新性地将ICM理论应用于隐显翻译中,指明隐显翻译研究不能局限于表层的语码转换研究,而应深入到探知其认知本质,挖掘文本的“物境”、“情境”、“意境”和“象境”。
通过ICM 理论在隐显翻译上的创新应用,为ICM理论研究开辟了一个新的应用空间,并为隐显翻译探索了一条更为全面和深入的认知研究途径。
%Ideal Cognitive Model is an important term in cognitive linguistics and it has been widely and effec-tively applied in text comprehension. Based on it, this paper innovatively uses ICM theory in explicita-tion and implicitation in translation, in order to make its study not only be confined in code-switching like before. The cognitive essence is explored and the "physical conception", "emotional conception","artistic conception" and "imaginative conception" which are ignored before are studied in this paper. It is expected that through the innovative application of ICM theory in translation, a new applicable space can be explored for ICM theory and a deeper and wider cognitive way can be opened for the study of implicitness-to-explicitness and explicitness-to-implicitness translation.【期刊名称】《通化师范学院学报》【年(卷),期】2014(000)009【总页数】5页(P22-26)【关键词】ICM(Ideal Cognitive Model);文本理解;隐显翻译【作者】周雪婷;潘依婷【作者单位】长沙理工大学外国语学院,湖南长沙 410114;长沙理工大学外国语学院,湖南长沙 410114【正文语种】中文【中图分类】H315.9大量翻译研究实践证明,对文本意义的理解直接影响甚至决定着我们的翻译理论观。
- 1、下载文档前请自行甄别文档内容的完整性,平台不提供额外的编辑、内容补充、找答案等附加服务。
- 2、"仅部分预览"的文档,不可在线预览部分如存在完整性等问题,可反馈申请退款(可完整预览的文档不适用该条件!)。
- 3、如文档侵犯您的权益,请联系客服反馈,我们会尽快为您处理(人工客服工作时间:9:00-18:30)。
2010年美国数学建模竞赛
ICM题目翻译
泛太平洋垃圾带
最近,已经有很多新闻报道“泛太平洋垃圾带”。
看看以下的网址
最近的一项深入太平洋涡旋(垃圾碎片不断累积的汇流地带)进行的科学探险,揭露出大量与处理这些垃圾碎片相关的科技问题。
倾倒废弃物流入海洋不是新鲜事,但是科学界却首次发现这些垃圾碎片(尤其是塑料制品)在太平洋**领域中密集出现。
科学界同时也发现这些垃圾碎片对海洋生态,对人类的福祉都带来了许多潜在威胁。
研究者把这些塑料垃圾描述成塑料汤或是塑料彩屑。
今年ICM的问题是利用跨学科建模,来解决由于海洋中垃圾存在与累积所带来的各种复杂问题,借此帮助研究者,最终帮助政府政策制定者来了解该问题的程度、范围和对全球潜在的影响。
作为科学探险的建模顾问,你的任务是要关注垃圾问题中的某一个因素,建立模型并分析它的性质,确定其对影响海洋生态、政府政策的潜在影响,以及改善它的负面影响的具体措施。
一定要考虑未来科研的需求和这一问题的经济因素,然后给科学探险的领队写一份报告,总结你的研究发现,提出解决建议、需要制定的政策和采取的措施。
以下是你可以建模研究的一些问题:
1。
海洋中的塑料垃圾有哪些潜在的短期或长期影响?需要何种监测来追踪它对海洋生态系统的影响?务必要说明时空变异性。
有哪些相关的资源需求?
如何才能让涡旋中塑料垃圾的广度、密度、分布情况得到最佳理解和描述?需要何种监测计划来追踪塑料垃圾的增加减/运动,要实施该监测计划需要哪些资源?
3。
当这些塑料垃圾进入海洋并在涡旋中累积之后,它组成成分的的光降解机理是什么?(比如说我们惊讶地发现了降解塑料的粒子最终会达到相似的大小。
4。
这些塑料从何处来?可以采取什么步骤来控制或减少与这一情况相关的各种风险?经济成本如何?控制或结束这种状态会带来什么经济效
益?如何比较成本与效益?有多少塑料被生产,丢弃与回收?有多少有可能被排入海洋?进入海洋的又有多少可能会到处漂浮?
同样的情况会在海洋的其他地方发生吗?我们应当监控那些因素,应该如何监控?北大西洋洋流和阿拉斯加洋流目前的情况如何?使用你的模型
来预测一下南部洋流(南大西洋,南太平洋)未来的塑料垃圾密度。
禁用聚丙烯外卖食品包装的即时效果如何?十到五十年后的远期效果又
如何?
只要你主要依靠建模的方式来进行分析,也可以探讨其他一些同该情况相关的科学和技术问题。
为了明确你的任务,重点应该集中在问题的某个重要方面,对重要的问
题和现象的表现进行建模分析,对你选择进行建模和分析的那个方面当中对当前和未来影响最显著的因素进行定量分析。
你的ICM 报告应以如下形式提交:它将是篇幅为10页的小组报告,提交给一位调查负责人,目的在于帮助她找出所探讨问题或现象的相关表现,主要分析这些问题或者现象的后果,并针对在问题进一步恶化之前政府能够采取哪些措施来遏制该问题向她提出可行性建议。