微观经济学 第七章 生产成本教学材料
微观经济学 第七章-推荐下载
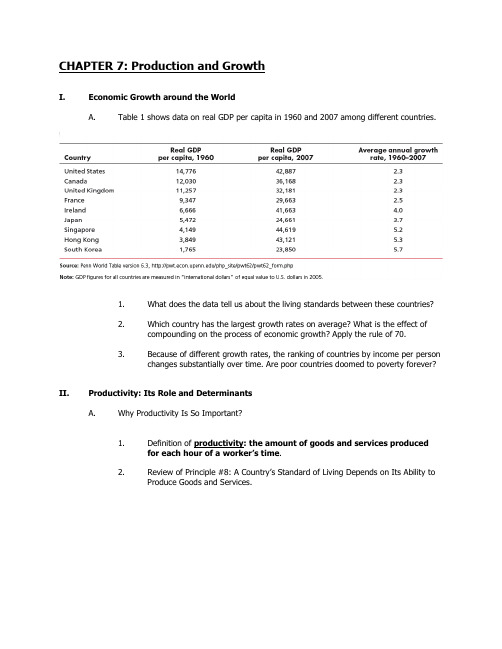
CHAPTER 7: Production and GrowthI.Economic Growth around the WorldA.Table 1 shows data on real GDP per capita in 1960 and 2007 among different countries.1.What does the data tell us about the living standards between these countries?2.Which country has the largest growth rates on average? What is the effect ofcompounding on the process of economic growth? Apply the rule of 70.3.Because of different growth rates, the ranking of countries by income per personchanges substantially over time. Are poor countries doomed to poverty forever? II. Productivity: Its Role and DeterminantsA.Why Productivity Is So Important?1.Definition of productivity: the amount of goods and services producedfor each hour of a worker’s time.2.Review of Principle #8: A Country’s Standard of Living Depends on Its Ability toProduce Goods and Services.B.How Productivity Is Determined1.Physical Capital per WorkerDefinition of physical capital: the stock of equipment and structures thatare used to produce goods and services.2.Human Capital per WorkerDefinition of human capital: the knowledge and skills that workersacquire through education, training, and experience.3.Natural Resources per Workera.Definition of natural resources: the inputs into the production ofgoods and services that are provided by nature, such as land, rivers,and mineral deposits.b.Are Natural Resources a Limit to Growth?4.Technological KnowledgeDefinition of technological knowledge: society’s understanding of thebest ways to produce goods and services.C.The Production Function1. A production function describes the relationship between the quantity of inputsused in production and the quantity of output from production.2.The production function generally is written like this:Y = A F(L, K, H, N)where Y = output, L = quantity of labour, K = quantity of physical capital, H =quantity of human capital, N = quantity of natural resources, A reflects theavailable production technology, and F( ) is a function that shows how inputs arecombined to produce output.3.Constant returns to scalea.This property implies that as all inputs are doubled, output will exactlydouble.b.This implies that the following must be true:x Y = A F(xL, xK, xH, xN)Where x =2 if inputs are doubled. What about only if labour is doubled?Would output double as well?c.This also means that if we want to examine output per worker, we couldset x = 1/L and we would get the following:Y/L = A F(1, K/L, H/L, N/L)This shows that output per worker depends on the amount of physicalcapital per worker (K/L), the amount of human capital per worker (H/L),and the amount of natural resources per worker (N/L).d.This chapter discusses how employment has declined relative to outputin the farm sector. Can you think of another sector of the economywhere the same phenomenon has occurred more recently? Would youconsider the change in employment a success or failure from thestandpoint of society as a whole?III.Economic Growth and Public PolicyA.The Importance of Saving and Investment1.Investment is funded by saving. How do we increase saving today?2.What is an opportunity cost of producing more capital goods?3.Figure 7.1 shows how the amount of capital per worker influences the amount ofoutput per worker. The curve becomes flatter as the amount of capital increasesand why?B.Diminishing Returns and the Catch-Up Effect1.Definition of diminishing returns: the property whereby the benefit froman extra unit of an input declines as the quantity of the input increases.2.An important implication of diminishing returns is the Catch-Up Effect.a.Definition of catch-up effect: the property whereby countries thatstart off poor tend to grow more rapidly than countries thatstart off rich.b. A puzzle: The share of GDP devoted to investment was similar forCanada and South Korea (about 23%) over the past 40 years. However,South Korea had a 6 percent growth rate of average annual income,while Canada had only a 2 percent growth rate over that past 40 years.How can this be explained?C.Investment from Abroad1.Saving by domestic residents is not the only way for a country to invest in newcapital.2.Investment in the country by foreigners can also occur.a.Foreign direct investment occurs when a capital investment is ownedand operated by a foreign entity.b.Foreign portfolio investment occurs when a capital investment isfinanced with foreign money but operated by domestic residents.3.Some of the benefits of foreign investment flow back to foreign owners in theform of profits. How does foreign investment benefit our economy?cation1.What is the opportunity cost of investing in human capital?2.What is a “brain drain”? Many poor countries and rich countries as well face abrain drain and why?E.Property Rights and Political Stability1.There is little incentive to produce products if there is no guarantee that theycannot be taken.2.Countries with questionable enforcement of property rights or an unstablepolitical climate will also have difficulty in attracting foreign (or even domestic)investment.F.Free Trade1. Trade allows a country to specialize in what it does best and thus consumebeyond its production possibilities.2.Most countries including Canada import substantial amount of goods andservices from other countries. Yet this chapter says that a nation can enjoy ahigher standard of living only if it can produce a large quantity of goods andservices. Can you reconcile these two facts?G.Research and Development1.The primary reason why living standards have improved over time has been dueto large increases in technological knowledge.2.The Canadian government promotes the creation of new technologicalinformation by providing research grants and providing tax incentives for firmsengaged in research.3.The patent system also encourages research by granting an inventor theexclusive right to produce the product for a specified number of years.H.Population Growth1. Stretching Natural Resourcesa.2oo years ago, Thomas Malthus (an English minister and early economicthinker) argued that an ever-increasing population meant that the worldwas doomed to live in poverty forever. Was he right?b.Many critics argue that population growth is depleting the Earth’snonrenewable resources and, therefore, places a limit on the growth inliving standards. But technological progress often yields ways to avoidthese limits. For example, the invention of hybrid cars reduces the use ofgas, or better insulating homes reduces the energy required to heat orcool them. The scarcer a resource is, the higher the market price whichprovides incentive to conserve it and develop alternatives.2.Diluting the Capital Stocka.High population growth reduces GDP per worker because rapid growth inthe number of workers forces the capital stock to be spread more thinly.b.Countries with a high population growth have large numbers of school-age children, placing a burden on the education system.c.Some countries have already instituted measures to reduce populationgrowth rates, for example, regulating the number of children (e.g., China)and fostering equal treatment for women which raises economicopportunities for women leading to lower rates of population (e.g., India).3.Promoting Technological Progressa.Some economists have suggested that population growth has driventechnological progress and economic prosperity.b.More people implies more scientists, more inventors, and moreengineers.G. QuestionThe catch-up effect says that countries with low income can grow faster thancountries with higher income. However, in statistical studies that include manydiverse countries we do not observe the catch-up-effect unless we control forother variables that affect productivity. Considering the determinants ofproductivity, list and explain some things that would tend to prohibit or limit apoor country's ability to catch up with the rich ones.。
微观经济学第七章

捆绑销售
捆绑销售是指厂商要求客户购买其
某种商产品的同时也必须购他的另 一种产品。
在顾客偏好存在差异而厂商又无法
实施价格歧视的条件下,使用这一 决策,可以增加厂商的利润。
8.对垄断的公共管制
(1)边际成本定价 边际成本定价: 规定垄断厂商的产品 最高价格位于需求价 格与边际成本相等的 水平。这一管制手段 剥夺了垄断厂商的某 些垄断权力,使价格 和产量更接近于完全 竞争的水平。
解: (a) MR=10-2Q,令MR=MC得, 10-2Q=1+Q 所以,Q*=3,P*=10-3=7. (b) 根据价格弹性公式得,P=7时, E=-7/3. 这表明,需求是富有弹性的。
例3:假设对某种教课书的需求是P=200.0002Q,出版商的边际成本曲线是MC= 6+0.00168Q.作者版税是总收益TR的20%.出版 商希望的价格和数量是多少?作者希望的价格 和数量多少?
第七章 不完全竞争市场
第一节 完全垄断市场
本节主要内容
完全垄断市场的条件 需求曲线 收益曲线 垄断厂商的短期均衡 垄断厂商的供给曲线 垄断厂商的长期均衡 垄断的来源 价格歧视
1.完全垄断市场的条件
垄断市场的条件:(1)唯一厂商;(2)没 有相近的替代品;(3)其它厂商的介入极 为困难或不可能。 形成垄断的原因:(1)控制资源供给; (2)拥有生产的专利权;(3)政府特许; (4)自然垄断。
(1)当Ed >1时,MR>0,TR上升 (2)当Ed <1时,MR<0,TR下降 (3)当Ed =1时,MR=0,TR达到极大 值
以上分析也同样适用于其它不完全竞争市 场。(只要厂商面临的需求曲线向右下方 倾斜,厂商的收益曲线就具有上述基本特
微观经济学 曼昆 第七章
25
C. 新进入市场买者的消费者剩余
20
= ½ x 10 x $10 = $50
15 D. 已进入市场买者由于价格下降而增加的消费
者剩余
= 10 x $10 = $100
10
5 0
0
需求曲线 Q
5 10 15 20 25 17
成本与供给曲线
▪ 成本:卖者为了生产一种物品而必须放弃的每种东西的价值(也是机会成本) ▪ 包括所有用于生产物品的资源的成本和卖者对于他们自己时间的评价 ▪ 例如:三个提供除草服务卖者的成本
总结:总消费者剩余等于需求曲 线以下和价格以上的面积
$200
$150
$100
$50
$0
Q
01234
消费者、生产者与市场效率
12
许多消费者的剩余与一条光滑的需求曲线
当 Q = 5(千双), 支付意愿是$50
边际买者为每每双双鞋鞋的的价格
如果 P = $30.
他的消费者剩余
P
$ 60
= $20.
50
对鞋的需求
因此, Qd = 2 当价格为P = $200时
消费者、生产者与市场效率
4
支付意愿与需求曲线
得出需求表
P (iPod的价格)
谁会买
人名
Anthony Chad Flea John
支付意愿
$250 175 300 125
$301及以上 没人
251 – 300 Flea
176 – 250 Anthony, Flea
29
资源的市场配置
▪ 市场经济中,资源的配置是由许多分散自利的买者与卖者相互作用决定的 ▪ 市场对资源的配置是合意的吗?还存在另一个不同的配置方法能使社会更好吗? ▪ 为回答这个问题,我们使用总剩余作为衡量社会福利的指标,我们也考虑市场配置是否有效率
微观经济学第7章不完全竞争的市场精品PPT课件

如果厂商的成本曲线如 P
右图所示,厂商的平均收 益(AR)等于平均可变成 E
本(AVC)。
P*
厂商处于亏损经营状态。 C
可经营也可不经营。
O
MC D
A
AC AVC
B
MR Q*
d(AR) Q
17
§7不完全竞争的市场
7.1.4 垄断厂商的短期均衡
短期均衡之五: 停止生产
如果厂商的成本曲线如下图所示,平均收益小于 平均可变成本,垄断厂商将停止营业。
7.1.1 垄断的一般分析
完全垄断:没有替代品的生产,由唯一的厂商生产。 垄断市场的条件:①行业中只有一个厂商 ②不存在 可替代的商品 ③新厂商不能进入该行业 ④商品价格和 数量完全由厂商决定 完全垄断与商品的替代程度:替代程度越低,垄断性 越强,垄断厂商的市场支配力并不表示垄断厂商可以索 要它想要的任意价格。垄断仍然受到市场需求的约束。 垄断市场模型在经济效率最低
§7不完全竞争的市场
7.1.3 垄断厂商的供给曲线
垄断厂商通过对产量和价格的同时调整来实现 MR=SMC的原则,而且总是P>MR.
厂商的价格和产量之间不存在一一对应关系。无 法进行有规律的表示。
凡是在或多或少的程度上带有垄断因素的不完全 竞争市场中,或者说,凡是在单个厂商对价格具 有一定的控制力量,相应的,单个厂商的需求曲 线向右下方倾斜的市场中,是不存在具有规律性 的厂商和行业的短期和长期供给曲线的。
3
§7不完全竞争的市场
7.1 完全垄断
7.1.1 7.1.2 7.1.3 7.1.4 7.1.5 7.1.6 7.1.7
垄断的一般分析 垄断厂商的需求曲线和收益曲线(重点) 垄断厂商的供给曲线 垄断厂商的短期均衡(重点) 垄断厂商的长期均衡(重点) 价格歧视(难点) 自然垄断和政府管制
厦大微观经济学ppt第七章[1]
![厦大微观经济学ppt第七章[1]](https://img.taocdn.com/s3/m/aeb18da5c5da50e2534d7fa6.png)
PPT文档演模板
2020/11/14
厦大微观经济学ppt第七章[1]
第二节 完全竞争的涵义和特点
一、完全竞争的含义
1.人数很多的小规模买者和卖者。 2.产品是同质的。 3.自由进入和自由退出。 4.完全的信息和知识。
二、完全竞争市场的行业需求和厂商需求
价 格
S
价 格
P*
PPT文档演模板
厦大微观经济学ppt第七章[1]
1.能赚取超额利润的均衡产量
成
本
和
H
收
A
益
E
TC TR
B
总收益=HQ1 总成本=EQ1 总利润=HE
FC 平均收益=DQ1
0 成 本 和 收 益 P1
C
PPT文档演模板
QS Q1 QL 产量 MC
平均成本=BQ1 单位产品利润
AC
=DB
D P1=AR=MR
B
QS Q1 QT 产量
总利润=CP1DB
利润最大化 条件: MC=MR
图7.3 完全竞争厂商短期均衡产量的决定
厦大微观经济学ppt第七章[1]
PPT文档演模板
厦大微观经济学ppt第七章[1]
2.超额利润为0时的均衡产量
收 益 与 成 本
P2
PPT文档演模板
MC
AC E
P2=AR=MR
平均成本=EQ2 平均利润=EQ2 超额利润=0
(一)厂商短期供给曲线
成本 与
价格
P3 P2
E3 E2MC AVCFra bibliotekP1E1
价 格
P3
E3 S
P2
E2
P1
E1 S
微观经济学课件 第7章 分配理论.ppt
200
160
VMP=MP×PP
120
MRP=MP×MR
80
AFC
MFC 40
0
L
0 1 2 3 4 5 6 7 8 9 10
2019/12/17
微观经济学
产品市场完全竞争——要素市场完全竞争
厂商使用生产要素的原则:
W
VMP=W
教材P269 图8-3
E
S=MFC=W
W0
0
2019/12/17
L0
在不完全竞争的要素市场,只 有要素价格提高要素的供给量才会 增加,所以,边际要素成本将递增 且高于平均要素成本,即高于要素 的价格。
MFC>AFC=PF
2019/12/17
微观经济学
不完全竞争要素市场厂商的MFC与AFC
要素供给量要素价格 总要素成本 平均要素成本 边际要素成本
L
PF
TFC
80
80
完全竞争产品市场厂商的MFC与AFC
200
160
120
AFC
80
MFC
MFC=AFC=W
40
0
L
0 1 2 3 4 5 6 7 8 9 10
2019/12/17
微观经济学
完全竞争要素市场的要素供给曲线
W
S=MFC=AFC=W
0
2019/12/17
微观经济学
L
五、不完全竞争要素市场的要素供给
MRP]——增加一单位某种生产要素的投入 量所增加的收益。
MRP=MPMR 平均收益产品[Average Revenue Product ,
ARP]——平均每一单位某种生产要素的投 入量所带来的收益。
微观经济学第七章共40页PPT资料

7.1.5.1 价格歧视及必备条件 7.1.5.2 一级价格歧视 7.1.5.3 二级价格歧视 7.1.5.4 三级价格歧视 7.1.5.5 自然垄断和政府管制
2019/12/27
14
7.1.5.1 价格歧视及必备条件
价格歧视 ——以不同价格销售同一种产品
必备条件 ——可区分不同偏好的消费者群体 ——不同的消费群体或市场相互隔离
两个效应 ——增加垄断厂商的利润 ——减少无谓损失
2019/12/27
15
7.1.5.2 一级价格歧视
厂商能够根据不同消费者的效用评价收取不同的
价格,不給消费者留有剩余。
2019/12/27
16
一级价格歧视(完全价格歧视)
P
A
MC
Pm
G
E
C
F
MR
O
Qm Qn
2019/12/27
一级价格歧视使消费者剩 余全部为垄断者占有。
价格的确定 根据各个分市场的需求价格弹性,分别制
定各个分市场的销售价格。
2019/12/27
19
7.1.5.5 自然垄断和政府管制
自然垄断的主要特征——存在规模经济 自然垄断因缺乏竞争,存在高价格、高利润、
低产出的效率损失
所以,多处于政府管制之下 。
1、边际成本定价法及其他定价法
① 边际成本定价法:P = MC
2019/12/27
6
7.1.3 完全垄断厂商的短期均衡
P、R、C
P0 N
利润
O
第一种情况:P>AC
MC AC F G
E d =AR=P
MR
Q0
Q
依MC=MR 确定Q和 P