High-resolution TEM obsvervations of isolated rhombohedral crystallites in graphite blocks
Proof

Dear Author,Here are the proofs of your article.•You can submit your corrections online, via e-mail or by fax.•For online submission please insert your corrections in the online correction form. Always indicate the line number to which the correction refers.•You can also insert your corrections in the proof PDF and email the annotated PDF.•For fax submission, please ensure that your corrections are clearly legible. Use a fine black pen and write the correction in the margin, not too close to the edge of the page.•Remember to note the journal title, article number, and your name when sending yourresponse via e-mail or fax.•Check the metadata sheet to make sure that the header information, especially author names and the corresponding affiliations are correctly shown.•Check the questions that may have arisen during copy editing and insert your answers/corrections.•Check that the text is complete and that all figures, tables and their legends are included. Also check the accuracy of special characters, equations, and electronic supplementary material if applicable. If necessary refer to the Edited manuscript.•The publication of inaccurate data such as dosages and units can have serious consequences.Please take particular care that all such details are correct.•Please do not make changes that involve only matters of style. We have generally introduced forms that follow the journal’s style.Substantial changes in content, e.g., new results, corrected values, title and authorship are not allowed without the approval of the responsible editor. In such a case, please contact theEditorial Office and return his/her consent together with the proof.•If we do not receive your corrections within 48 hours, we will send you a reminder.•Your article will be published Online First approximately one week after receipt of yourcorrected proofs. This is the official first publication citable with the DOI. Further changes are, therefore, not possible.•The printed version will follow in a forthcoming issue.Please noteAfter online publication, subscribers (personal/institutional) to this journal will have access to the complete article via the DOI using the URL: /[DOI].If you would like to know when your article has been published online, take advantage of our free alert service. For registration and further information go to: .Due to the electronic nature of the procedure, the manuscript and the original figures will only be returned to you on special request. When you return your corrections, please inform us if you would like to have these documents returned.Metadata of the article that will be visualized in OnlineFirstArticleTitle Synthesis, crystal structures, and fluorescence properties of two dinuclear cadmium(II) complexes derived from N-isopropyl-N′-(1-pyridin-2-ylethylidene)ethane-1,2-diamineArticle Sub-TitleArticle CopyRight Springer Science+Business Media, LLC(This will be the copyright line in the final PDF)Journal Name Structural ChemistryCorresponding Author Family Name YouParticleGiven Name Zhong-LuSuffixDivision Department of Chemistry and Chemical EngineeringOrganization Liaoning Normal UniversityAddress Dalian, 116029, People’s Republic of ChinaEmail youzhonglu@Author Family Name WangParticleGiven Name Xiao-LingSuffixDivision Department of Chemistry and Chemical EngineeringOrganization Liaoning Normal UniversityAddress Dalian, 116029, People’s Republic of ChinaEmailAuthor Family Name ZhangParticleGiven Name Ji-CaiSuffixDivision Department of Chemistry and Chemical EngineeringOrganization Liaoning Normal UniversityAddress Dalian, 116029, People’s Republic of ChinaEmailAuthor Family Name WangParticleGiven Name CheSuffixDivision Department of Chemistry and Chemical EngineeringOrganization Liaoning Normal UniversityAddress Dalian, 116029, People’s Republic of ChinaEmailAuthor Family Name ZhouParticleGiven Name Xiao-ShuangSuffixDivision Department of Chemistry and Chemical Engineering Organization Liaoning Normal UniversityAddress Dalian, 116029, People’s Republic of ChinaEmailSchedule Received19 January 2011 RevisedAccepted14 June 2011Abstract A new tridentate pyridyl Schiff base, N-isopropyl-N′-(1-pyridin-2-ylethylidene)ethane-1,2-diamine (L), was used to synthesize two dinuclear cadmium(II) complexes, [Cd2L2(μ1,1-N3)2(N3)2] (1) and [Cd2L2(μ1,3-NCS)2(NCS)2] (2). X-ray single crystal structure determination reveals that in both centrosymmetriccomplexes, the Cd atom is in a distorted octahedral coordination. In the crystal structures of 1 and 2, thedinuclear cadmium(II) complex molecules are linked, respectively, through intermolecular N–H···N and N–H···S hydrogen bonds to form infinite 1D chains. The preliminary fluorescence properties of the complexeswere investigated.Keywords (separated by '-')Synthesis - Crystal structure - Schiff base - Cadmium complex - FluorescenceFootnote InformationPlease ensure you fill out your response to the queries raised belowand return this form along with your correctionsDear AuthorDuring the process of typesetting your article, the following queries have arisen. Please check your typeset proof carefully against the queries listed below and mark thenecessary changes either directly on the proof/online grid or in the ‘Author’s response’ area provided belowU N C O R R EC TE DP R O O FORIGINAL RESEARCH12Synthesis,crystal structures,and fluorescence properties 3of two dinuclear cadmium(II)complexes derived from4N -isopropyl-N 0-(1-pyridin-2-ylethylidene)ethane-1,2-diamine5Zhong-Lu You •Xiao-Ling Wang •Ji-Cai Zhang •6Che Wang •Xiao-Shuang Zhou7Received:19January 2011/Accepted:14June 20118ÓSpringer Science+Business Media,LLC 20119Abstract A new tridentate pyridyl Schiff base,N -iso-10propyl-N 0-(1-pyridin-2-ylethylidene)ethane-1,2-diamine 11(L),was used to synthesize two dinuclear cadmium(II)12complexes,[Cd 2L 2(l 1,1-N 3)2(N 3)2](1)and [Cd 2L 2(l 1,3-13NCS)2(NCS)2](2).X-ray single crystal structure determi-14nation reveals that in both centrosymmetric complexes,the 15Cd atom is in a distorted octahedral coordination.In the 16crystal structures of 1and 2,the dinuclear cadmium(II)17complex molecules are linked,respectively,through 18intermolecular N–H ÁÁÁN and N–H ÁÁÁS hydrogen bonds to 19form infinite 1D chains.The preliminary fluorescence 20properties of the complexes were investigated.2122Keywords Synthesis ÁCrystal structure ÁSchiff base Á23Cadmium complex ÁFluorescence24Introduction25Considerable attention has been focused on the polynuclear 26complexes containing bridging ligands because of their 27interesting molecular topologies,as well as the fact that they 28may be designed with specific functionalities [1–3].Among 29pseudohalogens,azide and thiocyanate groups show a great 30tendency to act as bridging ligands between metallic centers 31[4–6].As is well-known,the azide ligand stabilizes either 32end-on or end-to-end coordination modes when it links dif-33ferent metal centers,while the thiocyanate ligands preferably34adopt the end-to-end coordination mode in the polynuclear 35complexes.Moreover,luminescent compounds are attract-36ing much current research interest because of their many 37applications in medical and analytical chemistry [7,8].The 38cadmium complexes with Schiff bases have shown inter-39esting fluorescence properties [9,10].In this article,a new 40tridentate Schiff base N -isopropyl-N 0-(1-pyridin-2-ylethy-41lidene)ethane-1,2-diamine (L;Scheme 1)was used as the 42primary ligand to synthesize two dinuclear cadmium(II)43complexes with azide and thiocyanate,[Cd 2L 2(l 1,1-44N 3)2(N 3)2](1)and [Cd 2L 2(l 1,3-NCS)2(NCS)2](2).45Experimental46Materials and measurements472-Acetylpyridine and N -isopropylethane-1,2-diamine were 48purchased from Aldrich Chemical Company Inc.and were 49used as received.All other reagents were of analytical 50grade.Elemental analyses (C,H,N)were performed using a 51Perkin-Elmer 240elemental analyzer.The 1H NMR spectra 52were recorded on Bruker AVANCE 400MHz spectrometer 53with tetramethylsilane as the internal reference.ESI mass 54spectra were obtained on a Mariner System 5304mass 55spectrometer.IR spectra were recorded on JASCO FT/IR-56480PLUS Fourier transform spectrophotometer with 57pressed KBr pellets in the range 200–4000cm -1.The 58luminescence spectra were reported on a JASCO FP-650059spectrofluorimeter (solid)in the range of 200–850nm.60Synthesis of L61To a methanol solution (20mL)of 2-acetylpyridine 62(1.0mmol,121.0mg)was added a methanol solutionA1Z.-L.You (&)ÁX.-L.Wang ÁJ.-C.Zhang ÁC.Wang ÁA2X.-S.ZhouA3Department of Chemistry and Chemical Engineering,A4Liaoning Normal University,Dalian 116029,A5People’s Republic of ChinaA6e-mail:youzhonglu@123Struct ChemDOI10.1007/s11224-011-9825-9U N C O R R EC TE DP R O O F63(20mL)of N -isopropylethane-1,2-diamine (1.0mmol,64102.2mg)with stirring.The mixture was stirred for 30min 65at room temperature to give a clear yellow solution.Then,66the solution was concentrated by distillation to give a 67gummy product.The residue was purified with a silica gel 68column and was eluted with CH 2Cl 2/CH 3OH (v:v =9:1)69to give pure oil product of L.Yield:91%.Anal.calc.for 70C 12H 19N 3:C,70.2;H,9.3;N,20.5;found:C,70.0;H,9.4;71N,20.5%.1H NMR (CDCl 3):d (ppm)1.06(d,6H),1.61(t,722H),1.82(s,3H),2.58(m,2H),2.96(m,1H),7.63(t,1H),737.80(t,1H),7.97(d,1H),8.66(d,1H),10.22(b,1H).ESI–74MS C 12H 19N 3[M ?H]?206.75Synthesis of [Cd 2L 2(l 1,1-N 3)2(N 3)2](1)76To a methanol solution (10mL)of L (0.1mmol,20.5mg)77and sodium azide (0.3mmol,19.5mg)was added a meth-78anol solution (10mL)of Cd(NO 3)2Á4H 2O (0.1mmol,7930.8mg)with stirring.The mixture was stirred for 30min at 80room temperature to give a clear colorless solution.Upon 81keeping the solution in air for 5days,colorless block-shaped 82crystals of the complex,suitable for X-ray diffraction,were 83formed at the bottom of the vessel on slow evaporation of the 84solvent.The crystals were isolated by filtration,washed three 85times with cold methanol and dried in air.Yield:83%on the 86basis of L.Anal.calc.for C 24H 38Cd 2N 18:C,35.9;H,4.8;N,8731.4;found:C,35.7;H,4.9;N,31.5%.IR data (cm -1):322788(m,sh),3101(w),3064(w),2966(m),2927(w),2869(w),892032(vs),1659(s),1593(s),1475(w),1438(m),1384(m),901353(w),1334(m),1309(s),1287(w),1254(w),1161(m),911133(m),1081(w),1068(w),1012(w),967(w),899(w),92810(w),786(s),750(w),653(w),633(w),616(w),579(w),93547(w),412(w),315(w).94Synthesis of [Cd 2L 2(l 1,3-NCS)2(NCS)2](2)95In a procedure identical to that described for the prepara-96tion of 1,but with sodium azide replaced by ammonium 97thiocyanate (0.3mmol,22.8mg),produced the colorless 98single crystals of 2.Yield:77%on the basis of L.Anal.99calc.for C 28H 38Cd 2N 10S 4:C,38.8;H,4.4;N,16.1;found:100C,38.7;H,4.6;N,15.9%.IR data (cm -1):3226(m,sh),1013100(w),3061(w),2963(m),2921(w),2869(w),1022121(vs),2081(vs),2050(vs),1662(s),1592(s),1568103(w),1439(m),1384(s),1311(s),1251(w),1238(w),1163104(w),1133(w),1081(m),1011(m),961(m),898(w),806105(w),787(s),765(w),748(w),655(w),633(w),577(w),106465(w),409(w),326(w).107X-ray data collection and structure determination108Diffraction intensities for the complexes were collected at 109298(2)K using a Bruker APEX II CCD area-detector with110MoK a radiation (k =0.71073A˚).The collected data were 111reduced using the SAINT program [11],and empirical 112absorption corrections were performed using the SADABS 113program [12].The structures were solved by direct meth-114ods and refined against F 2by full-matrix least-squares 115methods using the SHELXTL package [13].All of the non-116hydrogen atoms were refined anisotropically.All H atoms 117were placed in calculated positions and constrained to ride 118on their parent atoms.The crystallographic data for the 119complexes are summarized in Table 1.Selected bond 120lengths and angles are summarized in Table 2.Table 1Crystallographic data for complexesComplexes 12Empirical formulaC 24H 38Cd 2N 18C 28H 38Cd 2N 10S 4Formula weight 803.5867.7Temperature/K298(2)298Wavelength/A ˚0.710730.71073Crystal system Triclinic Triclinic Space groupP -1P -1a /A ˚8.570(5)7.609(6)b /A ˚10.495(6)10.223(8)c /A ˚10.758(6)13.353(10)a /862.824(6)101.938(10)b /873.131(6)101.136(9)c /883.358(7)107.604(10)V /A ˚3823.6(8)931.5(12)Z 11l /mm-11.337 1.399D c /g cm-31.620 1.547Reflections collected 34143921Unique reflections 30763040F (000)404436R int0.01510.0181R 1[I C 2r (I )]0.02720.0477wR 2[I C 2r (I )]0.06260.1119R 1(all data)0.03410.0662wR 2(all data)0.07110.1242Struct Chem123R R EC E O O F121Results and discussion122To design novel structures of metal complexes,the ligand 123used in the synthesis is important.In this article,we 124designed and synthesized a new Schiff base ligand,which 125readily coordinates to the metal atoms through the three N 126atoms.The yellow oil product of the ligand was prepared 127by condensation of equimolar quantities of 2-acetylpyri-128dinewith N -isopropylethane-1,2-diamine in methanol.129Both cadmium complexes (as illustrated in Scheme 2)130crystallize in colorless block-shaped single crystals,which131are stable in air at room temperature.The Schiff base and 132the two cadmium complexes are stable in air,and are 133soluble in common polar organic solvents,such as DMSO,134DMF,methanol,ethanol,and acetonitrile,etc.,but insol-135uble in water.The molar conductance values of the com-136plexes 1and 2measured in methanol at the concentration 137of 10-3M are 51and 62X -1cm 2mol -1,respectively,138indicating a partial ionization in solution [14].Possibly the 139terminal pseudohalogeno ligands are partly replaced by 140methanol molecules.141Crystal structure description of the complexes142Figures 1and 2give perspective views of the complexes 1143and 2together with the atomic labeling plex 1Table 2Selected bond lengths/A ˚and angles/°for the complexes 1Cd1–N1 2.318(3)Cd1–N2 2.373(2)Cd1–N3 2.387(2)Cd1–N4 2.485(3)Cd1–N7 2.286(3)Cd1–N4i 2.280(3)N4i–Cd1–N794.48(12)N4i–Cd1–N1153.40(10)N7–Cd1–N1103.81(13)N4i –Cd1–N2123.04(9)N7–Cd1–N294.50(11)N1–Cd1–N275.12(10)N4i –Cd1–N392.18(9)N7–Cd1–N390.84(11)N1–Cd1–N368.74(9)N2–Cd1–N3143.69(9)N4i –Cd1–N476.84(9)N7–Cd1–N4170.33(10)N1–Cd1–N4–83.06(10)N2–Cd1–N493.84(10)N3–Cd1–N485.31(10)2Cd1–N1 2.407(5)Cd1–N2 2.336(5)Cd1–N32.373(5)Cd1–N4 2.462(6)Cd1–S2 2.652(2)Cd1–N5ii 2.307(5)N5ii –Cd1–N2104.69(17)N5ii –Cd1–N394.4(2)N2–Cd1–N373.19(17)N5ii –Cd1–N187.06(18)N2–Cd1–N168.22(17)N3–Cd1–N1140.39(18)N5ii –Cd1–N4170.79(18)N2–Cd1–N484.48(18)N3–Cd1–N487.3(2)N1–Cd1–N497.4(2)N5ii –Cd1–S292.84(13)N2–Cd1–S2156.92(13)N3–Cd1–S2121.02(14)N1–Cd1–S298.38(13)N4–Cd1–S278.59(15)Symmetry transformations used to generate equivalent atoms:i 1-x ,2-y ,2-z ;ii -x ,-y ,-zStruct Chem123U144is a double end-on azido-bridged dinuclear Schiff base 145complex,and complex 2is a double end-to-end thio-146cyanato-bridged dinuclear Schiff base complex.Each147molecule of the complexes is located on a crystallographic 148center of inversion,containing two CdLX (X =N 3for 1,149and NCS for 2)units connected to each other by two 150bridging groups (end-on azide ligands for 1,and end-to-end 151thiocyanate ligands for 2).The Cd atom in 1is in an 152octahedral coordination and is six-coordinated by the NNN 153donor set of one Schiff base ligand and by one terminal N 154atom of one bridging azide ligand,defining the equatorial 155plane,and by two terminal N atoms,respectively,from the 156other bridging azide ligand and one terminal azide ligand,157occupying the axial positions.The Cd1–N4bond158[2.485(3)A˚]is much longer than the Cd1–N4A bond 159[2.280(3)A˚;symmetry code for A:1-x ,2-y ,2-z ],160which might be caused by the hindrance effects of the two 161CdLX units.The N1–Cd1–N4A bond angle [153.4(1)°]in 1621is severely deviate from the ideal value of 180°,which is 163also due to the same hindrance effects.The Cd atom in 2is 164also in an octahedral coordination;however,the equatorial 165plane is defined by the NNN donor set of one Schiff baseStruct Chem123U N C O R R EC TE DP R O O166ligand,and by one S atom of a bridging thiocyanate ligand,167and the axial positions are occupied by two N atoms,168respectively,from one bridging thiocyanate ligand and one 169terminal thiocyanate ligand.170In both complexes,the coordinate bond lengths are 171comparable with those observed in other Schiff base–cad-172mium(II)complexes [15–18]and,as expected,the bonds173involving the amine N atoms [2.373(2)A˚for 1,and 174 2.373(5)A˚for 2]are longer than those involving imine N 175atoms [2.318(3)A˚for 1,and 2.336(5)A ˚for 2].Either the 176bridging or the terminal X groups are nearly linear and 177show bent coordination mode with the Cd atoms.The178Cd _Cd distances are found to be 3.735(1)A˚for 1,and 179 5.931(1)A˚for 2,respectively.180In the crystal structures of 1and 2,the dinuclear cad-181mium complexes are linked through intermolecular 182N–H _N and N–H _S hydrogen bonds,respectively,183forming one-dimensional chains,as shown in Fig.3for 1184and Fig.4for 2.185IR spectra186The IR spectra of L and the two complexes provide infor-187mation about the metal–ligand bonding.The assignments 188are based on the typical group frequencies.The middle and 189sharp absorptions in the region 3220–3240cm -1for L and 190the complexes can be assigned to the vibrations of m (N–H).191The intense absorption band at 2031cm -1in 1and those at 1922121,2081,and 2050cm -1in 2are assigned to the 193stretching vibrations of azide and thiocyanate groups.The 194strong absorption band centered at 1635cm -1in the spec-195trum of L is assigned to the azomethine group,m (C=N).The 196bands are shifted to higher wave numbers in the complexes,1971659cm -1for 1and 1662cm -1for 2.The shift of the 198absorption bands indicates the coordination of the azome-199thine N atoms to the Cd atoms.In both complexes,the 200Schiff base ligand coordination to the Cd atoms is sub-201stantiated by weak bands in the region 470–310cm -1.202The close resemblance of the shape and the positions of 203these bands suggest similar coordination modes for the 204complexes,in accordance with the structural features.205Fluorescence character description of the complexes 206The fluorescence properties of the complexes were studied 207at room temperature (298K)in the solid state.Figure 5is 208the emission spectra of complexes 1and 2.It can be seen 209that they exhibit different fluorescence,although 1and 2are 210constructed from the same Schiff base ligand and metal 211atoms.The emission band of complex 1is from 350to 212450nm,with k max =474nm (k ex =393.5nm).Complex 2132exhibits band ranging from 350to 504nm,with 214k max =514nm (k ex =420.5nm).For Cd(II)complexes,215no emission originating from metal-centered MLCT/LMCT 216excited states are expected,since Cd(II)ion is difficult to 217oxidize or reduce due to its stable d 10configuration [19].218Thus,the emission observed in the complexes is tentatively 219assigned to the p –p *intraligand fluorescence [20].The 220bridging groups are different between the two complexes 221that may cause the different fluorescence properties 222between 1and 2.223Conclusion224In this study,two new centrosymmetric dinuclear cad-225mium(II)complexes with pseudohalide ligands were pre-226pared and structurally characterized.In both complexes,227the Cd atoms are in distorted octahedral coordination.The 228Schiff base ligand N -isopropyl-N 0-(1-pyridin-2-ylethylid-229ene)ethane-1,2-diamine coordinates to the Cd atom through 230the three N atoms.Fluorescence measurements show that 231complexes 1and 2emit medium fluorescent bands at about 232474and 514nm,respectively.233Supplementary material234CCDC-804743(1)and 804744(2)contain the supple-235mentary crystallographic data for this article.These data 236can be obtained free of charge at dc.cam.ac.237uk/const/retrieving.html or from the Cambridge Crystallo-238graphic Data Centre (CCDC),12Union Road,CambridgeStruct Chem123U NC O R R EC TE DP R O O F239CB21EZ,UK;fax:?44(0)1223-336033or e-mail:240deposit@.241Acknowledgment This study was supported by the National Nat-242ural Science Foundation of China (20901036).243References244 1.Gustafsson M,Fischer A,Ilyukhin A,Maliarik M,Nordblad P 245(2010)Inorg Chem 49:5359246 2.Ambrosi G,Formica M,Fusi V,Giorgi L,Macedi E,Micheloni 247M,Paoli P,Rossi P (2009)Inorg Chem 48:10424248 3.Staszak Z,Krojcer A,Kubiak M,Puszko A,Maciejewska G,249Cieslak-Golonka M (2010)Struct Chem 21:305250 4.Papaefstathiou GS,Escuer A,Raptopoulou CP,Terzis A,251Perlepes SP,Vicente R (2001)Eur J Inorg Chem 1567252 5.Liu G,Jing H,Xue D (2008)Struct Chem 19:81253 6.Shen L,Feng XW (2002)Struct Chem 13:4372547.Wang DH,Zhang XL,He C,Duan CY (2010)Org Biomol Chem 2558:29232568.Song CX,Zhang XL,Jia CY,Zhou P,Quan X,Duan CY (2010)257Talanta 81:6432589.Fang ZL,Nie QX (2010)J Coord Chem 63:232825910.Majumder A,Rosair GM,Mallick A,Chattopadhyay N,Mitra S260(2006)Polyhedron 25:175326111.Bruker (2007)SMART (Version 5.625)and SAINT (Version2626.01).Bruker AXS Inc,Madison,WI26312.Sheldrick GM (1996)SADABS program for empirical absorption264correction of area detector.University of Go¨ttingen,Germany 26513.Sheldrick GM (1997)SHELXTL V5.1software reference man-266ual.Bruker AXS,Inc,Madison,WI26714.Geary WJ (1971)Coord Chem Rev 7:8126815.You Z-L,Han X,Zhang G-N (2008)Z Anorg Allg Chem 634:14226916.Chowdhury H,Ghosh R,Rahaman SH,Ghosh BK (2007)Poly-270hedron 26:523027117.You Z-L,Jiao Q-Z,Niu S-Y,Chi J-Y (2006)Z Anorg Allg Chem272632:248627318.Rahaman SH,Ghosh R,Ghosh BK (2006)Inorg Chem Commun2749:101127519.Basak S,Sen S,Marschner C,Baumgartner J,Batten SR,Turner276DR,Mitra S (2008)Polyhedron 27:119327720.Das D,Chand BG,Sarker KK,Dinda J,Sinha C (2006)Poly-278hedron 25:2333279Struct Chem123。
英语材基试卷
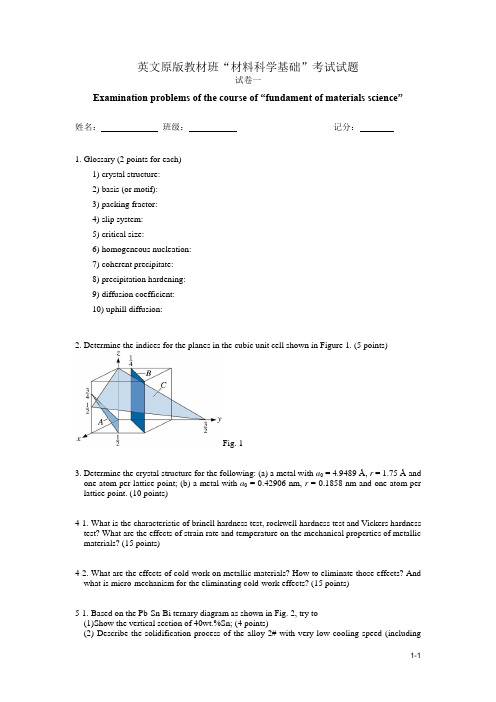
英文原版教材班“材料科学基础”考试试题试卷一Examination problems of the course of “fundament of materials science”姓名:班级:记分:1. Glossary (2 points for each)1) crystal structure:2) basis (or motif):3) packing fractor:4) slip system:5) critical size:6) homogeneous nucleation:7) coherent precipitate:8) precipitation hardening:9) diffusion coefficient:10) uphill diffusion:2. Determine the indices for the planes in the cubic unit cell shown in Figure 1. (5 points)Fig. 13. Determine the crystal structure for the following: (a) a metal with a0 =4.9489 Å, r = 1.75 Å and one atom per lattice point; (b) a metal with a0 = 0.42906 nm, r = 0.1858 nm and one atom per lattice point. (10 points)4-1. What is the characteristic of brinell hardness test, rockwell hardness test and Vickers hardness test? What are the effects of strain rate and temperature on the mechanical properties of metallic materials? (15 points)4-2. What are the effects of cold-work on metallic materials? How to eliminate those effects? And what is micro-mechanism for the eliminating cold-work effects? (15 points)5-1. Based on the Pb-Sn-Bi ternary diagram as shown in Fig. 2, try to(1)Show the vertical section of 40wt.%Sn; (4 points)(2) Describe the solidification process of the alloy 2# with very low cooling speed (includingphase and microstructure changes); (4 points)(3)Plot the isothermal section at 150o C. (7 points)Fig. 25-2. A 1mm sheet of FCC iron is used to contain N2in a heated exchanger at 1200o C. The concentration of N at one surface is 0.04 atomic percent and the concentration at the second surface is 0.005 atomic percent. At 1000 o C, if same N concentration is demanded at the second surface and the flux of N becomes to half of that at 1200o C, then what is the thickness of sheet?(15 points)6-1. Supposed that a certain liquid metal is undercooled until homogeneous nucleation occurs. (15 points)(1)How to calculate the critical radius of the nucleus required? Please give the deductionprocess.(2)For the Metal Ni, the Freezing Temperature is 1453︒C, the Latent Heat of Fusion is 2756J/cm3, and the Solid-liquid Interfacial Energy is 255⨯10-7 J/cm2. Please calculate the critical radius at 1353︒C. (Assume that the liquid Ni is not solidified.)6-2. Fig.3 is a portion of the Mg-Al phase diagram. (15 points)(1)If the solidification is too rapid, please describe the solidification process of Mg-10wt%Alalloy.(2)Please describe the equilibrium solidification process of Mg-20wt%Al alloy, and calculate theamount of each phase at 300︒C.Fig. 37-1. Figure 4 shows us the Al-Cu binary diagram and some microstructures found in a cooling process for an Al-4%Cu alloy. Please answer following questions according to this figure. (20 points)Fig. 4(1)What are precipitate, matrix and microconstituent? Please point them out in the in the figure and explain.(2)Why is need-like precipitate not good for dispersion strengthening? The typical microstructure shown in the figure is good or not? why?(3)Please tell us how to obtain the ideal microstructure shown in this figure.(4)Can dispersion strengthened materials be used at high temperature? Please give the reasons (comparing with cold working strengthening)7-2. Please answer following questions according to the time-temperature-transformation (TTT) diagram as shown in Fig. 5. (20 points)(1)What steel is this TTT diagram for? And what means P, B, and M in the figure? (2)Why dose the TTT diagram exhibi ts a ‘C’ shape?(3)Point out what microconstituent will be obtained after austenite is cooled according to the curves I, II, III and IV .(4)What is microstructural difference between the curve I and the curve II? (5)How to obtain the steel with the structure of(a) P+B(b) P+M+A (residual) (c) P+B+M+A (residual)(d) Full tempered martensiteIf you can, please draw the relative cooling curve or the flow chart of heat treatment.Fig. 5III III IV英文原版教材班“材料科学基础”考试试题答案Solution s of the course of “fundament of materials science”1. Glossary (2 points for each)1) The arrangement of the atoms in a material into a repeatable lattice.2) A group of atoms associated with a lattice.3) The fraction of space in a unit cell occupied by atoms.4) The combination of the slip plane and the slip direction.5) The minimum size that must be formed by atoms clustering together in the liquid before thesolid particle is stable and begins to grow.6) Formation of a critically sized solid from the liquid by the clustering together of a largenumber of atoms at a high undercooling (without an external interface).7) A precipitate whose crystal structure and atomic arrangement have a continuousrelationship with matrix from which precipitate is formed.8) A strengthening mechanism that relies on a sequence of solid state phase transformationsin a dispersion of ultrafine precipitates of a 2nd phase. This is same as age hardening. It is a form of dispersion strengthening.9) A temperature-dependent coefficient related to the rate at which atom, ion, or otherspecies diffusion. The DC depends on temperature, the composition and microstructure of the host material and also concentration of the diffusion species.10) A diffusion process in which species move from regions of lower concentration to that ofhigher concentration.2. Solution: A(-364), B(-340), C(346).3. Solution: (a)fcc; (b) bcc.4-1. What is the characteristic of brinell hardness test, rockwell hardness test and Vickers hardness test? What are the effects of strain rate and temperature on the mechanical properties of metallic materials? (15 points)4-2. What are the effects of cold-work on metallic materials? How to eliminate those effects? And what is micro-mechanism for the eliminating cold-work effects? (15 points)5-1. Based on the Pb-Sn-Bi ternary diagram as shown in Fig. 2, try to(1)Show the vertical section of 40wt.%Sn; (5 points)(2) Describe the solidification process of the alloy 2# with very low cooling speed (includingphase and microstructure changes); (5 points)(3)Plot the isothermal section at 150o C. (5 points)Fig. 25-2. A 1mm sheet of FCC iron is used to contain N2in a heated exchanger at 1200o C. The concentration of N at one surface is 0.04 atomic percent and the concentration at the second surface is 0.005 atomic percent. At 1000 o C, if same N concentration is demanded at the second surface and the flux of N becomes to half of that at 1200o C, then what is the thickness of sheet?(15 points)6-1. Supposed that a certain liquid metal is undercooled until homogeneous nucleation occurs. (15 points)(3)How to calculate the critical radius of the nucleus required? Please give the deductionprocess.(4)For the Metal Ni, the Freezing Temperature is 1453︒C, the Latent Heat of Fusion is 2756J/cm3, and the Solid-liquid Interfacial Energy is 255⨯10-7 J/cm2. Please calculate the critical radius at 1353︒C. (Assume that the liquid Ni is not solidified.)6-2. Fig.3 is a portion of the Mg-Al phase diagram. (15 points)(3)If the solidification is too rapid, please describe the solidification process of Mg-10wt%Alalloy.(4)Please describe the equilibrium solidification process of Mg-20wt%Al alloy, and calculate theamount of each phase at 300︒C.Fig. 37-1. Figure 4 shows us the Al-Cu binary diagram and some microstructures found in a cooling process for an Al-4%Cu alloy. Please answer following questions according to this figure. (20 points)Fig. 4(1)What are precipitate, matrix and microconstituent? Please point them out in the in the figure and explain.(2)Why is need-like precipitate not good for dispersion strengthening? The typical microstructure shown in the figure is good or not? why?(3)Please tell us how to obtain the ideal microstructure shown in this figure.(4)Can dispersion strengthened materials be used at high temperature? Please give the reasons (comparing with cold working strengthening)7-2. Please answer following questions according to the time-temperature-transformation (TTT) diagram as shown in Fig. 5. (20 points)(1)What steel is this TTT diagram for? And what means P, B, and M in the figure? (2)Why dose the TTT diagram exhibits a ‘C’ shape?(3)Point out what microconstituent will be obtained after austenite is cooled according to the curves I, II, III and IV .(4)What is microstructural difference between the curve I and the curve II? (5)How to obtain the steel with the structure of(a) P+B(b) P+M+A (residual) (c) P+B+M+A (residual)(d) Full tempered martensiteIf you can, please draw the relative cooling curve or the flow chart of heat treatment.Fig. 5III III IV英文原版教材班“材料科学基础”考试试题试卷二Examination problems of the course of “fundament of materials science”姓名:班级:记分:1. You would like to be able to physically separate different materials in a scrap recycling plant. Describe some possible methods that might be used to separate materials such as polymers, aluminum alloys, and steels from one another. (5 points)2. Plot the melting temperature of the elements in the 1A column of the periodic table versus atomic number (i.e., plot melting temperatures of Li through Cs). Discuss this relationship, based on atomic bonding and binding energy. (10 points)3.Above 882℃, titanium has a BCC crystal structure, with a = 0.332 nm. Below this temperature, titanium has a HCP structure, with a = 0.2978 nm and c = 0.4735 nm. Determine the percent volume change when BCC titanium transforms to HCP titanium. Is this a contraction or expansion? (10 points)4. The density of BCC iron is 7.882 g/cm3and the lattice parameter is 0.2866 nm whenhydrogen atoms are introduced at interstitial positions. Calculate (a) the atomic fraction of hydrogen atoms and (b) the number of unit cells required on average to contain one hydrogen atom. (15 points)5. A carburizing process is carried out on a 0.10% C steel by introducing 1.0% C at the surface at 980℃, where the iron is FCC. Calculate the carbon content at 0.01 cm, 0.05 cm, and 0.10 cm beneath the surface after 1 h. (15 points)6. The following data were collected from a standard 0.505-in.-diameter test specimen of acopper alloy (initial length (t o) = 2.0 in.):Load Gage Length Stress Strain(lb) (in.) (psi) (in/in.)0 2.00000 0 0.03,000 2.00167 15,000 0.0008356,000 2.00333 30,000 0.0016657,500 2.00417 37,500 0.0020859,000 2.0090 45,000 0.004510,500 2.040 52,500 0.0212,000 2.26 60,000 0.1312,400 2.50 (max load) 62,000 0.2511,400 3.02 (fracture) 57,000 0.51After fracture, the gage length is 3.014 in. and the diameter is 0.374 in. Plot the data and calculate (a) the 0.2% offset yield strength, (b) the tensile strength, (c) the modulus of elasticity, (d) the %Elongation, (e) the %Reduction in area, (f) the engineering stress at fracture, (g) the true stress at fracture, and (h) the modulus of resilience. (15 points)7. A 1.5-em-diameter metal bar with a 3-cm gage length is subjected to a tensile test. Thefollowing measurements are made.Change in Force (N) Gage length (cm) Diameter (cm)16,240 0.6642 1.202819,066 1.4754 1.088419,273 2.4663 0.9848Determine the strain hardening coefficient for the metal. Is the metal most likely to be FCC, BCC, or HCP? Explain.(15 points)8. Based on Hume-Rothery’s conditions, which of the following systems would be expected todisplay unlimited solid solubility? Explain. (15 points)(a) Au-Ag (b) Al-Cu (c) Al-Au (d)U-W(e) Mo-Ta (f) Nb-W (g) Mg-Zn (h) Mg-Cd英文原版教材班“材料科学基础”考试试题答案Solutions of the course of “fundament of materials science”1.Steels can be magnetically separated from the other materials; steel (or carbon-containing iron alloys) are ferromagnetic and will be attracted by magnets. Density differences could be used—polymers have a density near that of water; the specific gravity of aluminum alloys is around2.7;that of steels is between 7.5 and 8. Electrical conductivity measurements could be used—polymers are insulators, aluminum has a particularly high electrical conductivity.(5 points)2.T (o C)L i–180.7N a– 97.8K – 63.2R b– 38.9As the atomic number increases, the melting temperature decreases, (10 points)3. We can find the volume of each unit cell. Two atoms are present in both BCC and HCP titanium unit cells, so the volumes of the unit cells can be directly compared.V BCC = (0.332 nm)3 = 0.03659 nm3V HCP= (0.2978 nm)2(0.4735 nm)cos30 = 0.03637 nm3△V=x 100 =×100= -0.6%Therefore titanium contracts 0.6% during cooling. (10 points)4. (a) 7.882 g/cm3 =x = 0.0081 H atoms/cellThe total atoms per cell include 2 Fe atoms and 0.0081 H atoms. Thus:(10 points)(b) Since there is 0.0081 H/cell, then the number of cells containing H atoms is:cells = 1/0.0081 = 123.5 or 1 H in 123.5 cells (5 points)5. D = 0.23 exp[-32,900/(1.987)(1253)] = 42 × 10-8 cm2/sC x= 0.87% CC x= 0.43% CC x= 0.18% C(15 points)6. σ=FI (π/4)(0.505)2 = F/0.2ε = (l-2)/2(a) 0.2% offset yield strength = 45,000 psi(b)tensile strength = 62,000 psi(c) E = (30,000 - 0) / (0.001665 - 0) = 18 x 106 psi(d)%Elongation =(e) %Reduction in area =(f) engineering stress at fracture = 57,000 psi(g)true stress at fracture = 11,400 lb / (TC/4)(0.374)2= 103,770 psi (h) From the graph, yielding begins at about 37,500 psi. Thus:(15 points)7.Force(lb) Gage length(in.) Diameter(in.) True stress(psi) True strain(psi)16,240 3.6642 12.028 143 0.20019,066 4.4754 10.884 205 0.40019,273 5.4663 9.848 249 0.600σt=Kεt2or ln143=ln K + n ln0.2ln 249 = ln K + nln 0.6n=0.51A strain hardening coefficient of 0.51 is typical of FCC metals.(15 points)8.The Au–Ag, Mo–Ta, and Mg–Cd systems have the required radius ratio, the same crystal structures, and the same valences. Each of these might be expected to display complete solid solubility. [The Au –Ag and Mo –T a d o have isomorphous phase diagrams. In addition, the Mg–Cd alloys all solidify like isomorphous alloys; however a number of solid state phase transformations complicate the diagram.] (15 points)英文原版教材班“材料科学基础”考试试题试卷三Examination problems of the course of “fundament of materials science”姓名:班级:记分:1. You would like to be able to identify different materials without resorting to chemical analysis or lengthy testing procedures. Describe some possible testing and sorting techniques you might be able to use based on the physical properties of materials. (5 points)2. Plot the melting temperatures of elements in the 4A to 8-10 columns of the periodic table versus atomic number (i.e., plot melting temperatures of Ti through Ni, Zr through Pd, and Hf through Pt). Discuss these relationships, based on atomic bonding and binding energy, (a) as the atomic number increases in each row of the periodic table and (b) as the atomic number increases in each column of the periodic table. (10 points)3. Beryllium has a hexagonal crystal structure, with a o= 0.22858 nm and c o= 0.35842 nm. The atomic radius is 0.1143 nm, the density is 1.848 g/cm3, and the atomic weight is 9.01 g/mol. Determine (a) the number of atoms in each unit cell and (b) the packing factor in the unit cell.(10 points)4. Suppose we introduce one carbon atom for every 100 iron atoms in an interstitial position in BCC iron, giving a lattice parameter of 0.2867 nm. For the Fe-C alloy, find (a) the density and (b) the packing factor. (15 points)5. Iron containing 0.05% C is heated to 912oC in an atmosphere that produces 1.20% C at the surface and is held for 24 h. Calculate the carbon content at 0.05 cm beneath the surface if (a) the iron is BCC and (b) the iron is FCC. Explain the difference. (15 points)6. The following data were collected from a 0.4-in. diameter test specimen of poly vinyl chloride(l0 = 2.0 in):Load(lb) Gage Length(in.) Stress(psi) Strain(in/in.)0 2.00000 0 0.0300 2.00746 2,387 0.00373600 2.01496 4,773 0.00748900 2.02374 7,160 0.011871200 2.032 9,547 0.0161500 2.046 11,933 0.0231660 2.070 (max load) 13,206 0.0351600 2.094 12,729 0.0471420 2.12 (fracture) 11,297 0.06After fracture, the gage length is 2.09 in. and the diameter is 0.393 in. Plot the data and calculate (a) the 0.2% offset yield strength, (b) the tensile strength, (c) the modulus of elasticity, (d) the %Elongation, (e) the %Reduction in area, (f) the engineering stress at fracture, (g) the true stress at fracture, and (h) the modulus of resilience. (15 points)7. A titanium alloy contains a very fine dispersion of tiny Er203 particles. What will be the effectof these particles on the grain growth temperature and the size of the grains at any particular annealing temperature? Explain. (15 points)8. Suppose 1 at% of the following elements is added to copper (forming a separate alloy witheach element) without exceeding the solubility limit. Which one would be expected to give the higher strength alloy? Is any of the alloying elements expected to have unlimited solid solubility in copper?(a) Au (b) Mn (c) Sr (d) Si (e) Co (15 points)英文原版教材班“材料科学基础”考试试题答案Solutions of the course of “fundament of materials science”1.Steels can be magnetically separated from the other materials; steel (or carbon-containing iron alloys) are ferromagnetic and will be attracted by magnets. Density differences could be used—polymers have a density near that of water; the specific gravity of aluminum alloys is around2.7;that of steels is between 7.5 and 8. Electrical conductivity measurements could be used—polymers are insulators, aluminum has a particularly high electrical conductivity.(5 points)2. Ti –1668 Zr – 1852 Hf – 2227V –1900 Nb –2468 Ta – 2996Cr –1875 Mo–2610 W–3410Mn–1244 Tc –2200 Re–3180Fe –1538 Ru –2310 Os–2700Co –1495 Rh –1963 Ir –2447Ni –1453 Pd –1552 Pt –1769For each row, the melting temperature is highest when the outer “d” energy level is partly full. In Cr, there are 5 electrons in the 3d shell; in Mo, there are 5 electrons in the 4d shell; in W there are 4 electrons in the 5d shell. In each column, the melting temperature increases as the atomic number increases—the atom cores contain a larger number of tightly held electrons, making the metals more stable. (10 points)3.V= (0.22858 nm)2(0.35842 nm)cos 30 = 0.01622 nm3 = 16.22 × 10⁻²⁴ cm3(a)From the density equation:1.848 g/cm3 =x = 2 atoms/cell(b)The packing factor (PF) is:PF == 0.77 (10 points)4. There is one carbon atom per 100 iron atoms, or 1 C/50 unit cells, or 1/50 C per unit cell:(a)(b)(15 points)5. t= (24 h)(3600 s/h) = 86,400 sD BCC = 0.011 exp[-20,900/(1.9871185)] = 1.54 × 10⁻⁶ cm2/sD FCC = 0.23 exp[-32,900/(1.987)(1185)] = 1.97×10⁻⁷ cm2/sBCC: = erf[0.0685] = 0.077C x= 1.11% CFCC: = erf[0.192] = 0.2139C x = 0.95% CFaster diffusion occurs in the looser packed BCC structure, leading to the higher carbon content at point “x”. (15 points)6. σ=F /(π/4)(0.4)2 = F/0.1257ε = (l-2)/2(a)0.2% offset yield strength = 11,600 psi(b) tensile strength = 12,729 psi(c) E= (7160 - 0) / (0.01187 - 0) = 603,000 psi(d)%Elongation =(e) %Reduction in area =(f) engineering stress at fracture = 11,297 psi(g)true stress at fracture = 1420 lb / (TC/4)(0.393)2= 11,706 psi (h) From the figure, yielding begins near 9550 psi. Thus:(15 points)7. These particles, by helping pin die grain boundaries, will increase the grain growth temperature and decrease the grain size. (15 points)8.The Cu-Sr alloy would be expected to be strongest (largest size difference). The Cu-Au alloy satisfies Hume-Rothery ’s conditions and might be expected to display complete solid solubility—in fact it freezes like an isomorphous series of alloys, but a number of solid state transformations occur at lower temperatures.(15 points)英文原版教材班“材料科学基础”考试试题试卷四Examination problems of the course of “fundament of materials science”姓名:班级:记分:1.Aluminum has a density of2.7 g/cm3. Suppose you would like to produce a compositematerial based on aluminum having a density of 1.5 g/cm3. Design a material that would have this density. Would introducing beads of polyethylene, with a density of 0.95 g/cm3, into the aluminum be a likely possibility? Explain. (5 points)2. (a) Aluminum foil used for storing food weighs about 0.3 g per square inch. How many atomsof aluminum are contained in this sample of foil?(b) Using the densities and atomic weights given in Appendix A, calculate and compare thenumber of atoms per cubic centimeter in (i) lead and (ii) lithium. (10 points)3. The density of potassium, which has the BCC structure and one atom per lattice point, is0.855 g/cm3. The atomic weight of potassium is 39.09 g/mol. Calculate (a) the latticeparameter; and (b) the atomic radius of potassium. (10 points)4. The density of a sample of HCP beryllium is 1.844 g/cm3 and the lattice parameters are a0=0.22858 nm and c0= 0.35842 nm. Calculate (a) the fraction of the lattice points that containvacancies and (b) the total number of vacancies in a cubic centimeter. (15 points)5. A ceramic part made of MgO is sintered successfully at 1700℃in 90 minutes. To minimizethermal stresses during the process, we plan to reduce the temperature to 1500℃. Which will limit the rate at which sintering can be done: diffusion of magnesium ions or diffusion of oxygen ions? What time will be required at the lower temperature? (15 points)6. (a) A thermosetting polymer containing glass beads is required to deflect 0.5 mm when aforce of 500 N is applied. The polymer part is 2 cm wide, 0.5 cm thick, and 10 cm long. If the flexural modulus is 6.9 GPa, determine the minimum distance between the supports. Will the polymer fracture if its flexural strength is 85 MPa? Assume that no plastic deformation occurs.(b) The flexural modulus of alumina is 45 x 106 psi and its flexural strength is 46,000 psi. Abar of alumina 0.3 in. thick, 1.0 in. wide, and 10 in. long is placed on supports 7 in. apart.Determine the amount of deflection at the moment the bar breaks, assuming that no plastic deformation occurs. (15 points)7. Based on the following observations, construct a phase diagram. Element A melts at 850°Cand element B melts at 1200°C. Element B has a maximum solubility of 5% in element A, and element A has a maximum solubility of 15% in element B. The number of degrees of freedom from the phase rule is zero when the temperature is 725°C and there is 35% B present. At room temperature 1% B is soluble in A and 7% A is soluble in B. (15 points)8.Suppose that age hardening is possible in the Al-Mg system (see Figure 10-11). (a)Recommend an artificial age-hardening heat treatment for each of the following alloys, and(b) compare the amount of the precipitate that forms from your treatment of each alloy. (i)Al-4% Mg (ii) Al-6% Mg (iii) Al-12% Mg (c) Testing of the alloys after the heat treatment reveals that little strengthening occurs as a result of the heat treatment. Which of the requirements for age hardening is likely not satisfied? (15 points)英文原版教材班“材料科学基础”考试试题答案Solutions of the course of “fundament of materials science”1. In order to produce an aluminum-matrix composite material with a density of 1.5 g/cm 3, we wouldneed to select a material having a density considerably less than 1.5 g/cm 3. While polyethylene’s density would make it a possibility, the polyethylene has a very low melting point compared to aluminum; this would make it very difficult to introduce the polyethylene into a solid aluminum matrix —processes such as casting or powder metallurgy would destroy the polyethylene .Therefore polyethylene would NOT be a likely possibility.One approach, however, might be to introduce hollow glass beads .Although ceramic glasses have densities comparable to that of aluminum, a hollow bead will have a very low density. The glass also has a high melting temperature and could be introduced into liquid aluminum for processing as a casting. (5 points)2. (a) In a one square inch sample:number ==6.69 × 10²¹ atoms(b) (i) In lead:= 3.3 × 10²² atoms/cm 3(ii) In lithium:= 4.63 × 10²² atoms/cm 3 (10 points)3. (a) Using Equation 3-5:0.855 g/cm 3 =a o 3 = 1.5189 × 10⁻²² cm 3 or a o = 5.3355 × 10⁻⁸ cm(b) From the relationship between atomic radius and lattice parameter:r == 2.3103 × 10⁻⁸cm (10 points)4. V u.c.= (0.22858 nm)2(0.35842 nm)cos30 = 0.01622 nm 3= 1.622 x 10~23 cm 3 (a) From the density equation:x = 1.9984fraction =29984.12 = 0.0008(b) number == 0.986 x 10²⁰ vacancies/cm 3 (15 points)5. Diffusion of oxygen is the slower of the two, due to the larger ionic radius of the oxygen.D 1700= 0.000043 exp[-82,100/(1.987)(1973)] = 3.455 × 10⁻¹⁴ cm 2/sD1500= 0.000043 exp[-82,100/(1.987)(1773)] = 3.255 × 10⁻¹⁵ cm2/st1500 = D1700 t1700/D1500== 955 min = 15.9 h (15 points)6. (a) Solution:The minimum distance L between the supports can be calculated from the flexural modulus.L3 = 4w/z3δ(flexural modulus)/3FL3 = (4)(20 mm)(5 mm)3(0.5 mm)(6.9 GPA)(1000 MPa/GPa) / 500 NL3 = 69,000 mm3 or L = 41 mmThe stress acting on the bar when a deflection of 0.5 mm is obtained isσ= WL/2wh2 = (3)(500 N)(41 mm) / (2)(20 mm)(5 mm)2 = 61.5 MPaThe applied stress is less than the flexural strength of 85 MPa; the polymer is not expected to fracture.(b) Solution:The force required to break the bar isF = 2w/z2(flexural strength)/3LF= (2)(1 in)(0.3 in)2(46,000 psi / (3)(7 in.) = 394 lbThe deflection just prior to fracture is8 = FZ3/4wh3(flexural modulus)8 = (394 lb)(7 in)3/(4)(l in)(0.3 in)3(45 x 106 psi) = 0.0278 in. (15 points)7.(15 points)8. (a) The heat treatments for each alloy might be:Al-4% Mg Al-6% Mg Al-12% MgT Eutectic451°C 451°C 451°CT Solvs210°C 280°C 390°CSolutionTreat at: 210-451°C 280-451°C 390-451°CQuench Quench QuenchAge at: <210°C <280°C <390°C(b) Answers will vary depending on aging temperature selected. If all threeare aged at 200°C, as an example, the tie line goes from about 3.8 to 35% Mg:A1-4% Mg: %β = (4− 3.82)/(35 − 3.82) X 100 = 0.6%Al-6% Mg: %β = (6 − 3.82)/(35 − 3.82) X 100 = 7.1%Al-12% Mg: %β = (12 −3.82)/(35− 3.82) X 100 = 26.8%(c) Most likely, a coherent precipitate is not formed; simple dispersionstrengthening, rather than age hardening, occurs. (15 points)英文原版教材班“材料科学基础”考试试题试卷五Examination problems of the course of “fundament of materials science”姓名:班级:记分:1. You would like to design an aircraft that can be flown by human power nonstop for adistance of 30 km. What types of material properties would you recommend? What materials might be appropriate? (5 points)2. Boron has a much lower coefficient of thermal expansion than aluminum, even though bothare in the 3B column of the periodic table. Explain, based on binding energy, atomic size, and the energy well, why this difference is expected. (10 points)3. Determine the ASTM grain size number if 20 grains/square inch are observed at amagnification of 400. (10 points)4. We currently can successfully perform a carburizing heat treatment at 1200o C in 1 h. In aneffort to reduce the cost of the brick lining in our furnace, we propose to reduce the carburizing temperature to 950℃. What time will be required to give us a similar carburizing treatment? (15 points)5.The data below were obtained from a series of Charpy impact tests performed on foursteels, each having a different manganese content. Plot the data and determine (a) the transition temperature (defined by the mean of the absorbed energies in theductile and brittle regions) and (b) the transition temperature (defined as the temperature that provides 50 J absorbed energy). Plot the transition temperature versus manganese content and discuss the effect of manganese on the toughness of steel. What would be the minimum manganese allowed in the steel if a part is to be used at 0°C?Test temperature°C Impact snergy (J)0.30% Mn 0.39% Mn 1.01% Mn 1.55% Mn-100 2 5 5 15-75 2 5 7 25-50 2 12 20 45-25 10 25 40 700 30 55 75 11025 60 100 110 13550 105 125 130 14075 130 135 135 140100 130 135 135 140(15 points)。
喜马拉雅吉隆花岗伟晶岩中锂矿物的研究
2024/040(02):0484 0498ActaPetrologicaSinica 岩石学报doi:10.18654/1000 0569/2024.02.07田恩农,谢磊,王汝成等.2024.喜马拉雅吉隆花岗伟晶岩中锂矿物的研究.岩石学报,40(02):484-498,doi:10.18654/1000-0569/2024.02.07喜马拉雅吉隆花岗伟晶岩中锂矿物的研究田恩农1,2,3 谢磊1 王汝成1 吴福元4,5TIANEnNong1,2,3,XIELei1 ,WANGRuCheng1andWUFuYuan4,51 内生金属矿床成矿机制研究国家重点实验室,南京大学地球科学与工程学院,南京 2100232 河北地质大学,河北省岩石矿物材料绿色开发重点实验室,宝石与材料学院,石家庄 0500313 河北省战略性关键矿产研究协同创新中心,石家庄 0500314 中国科学院地质与地球物理研究所,岩石圈演化国家重点实验室,北京 1000295 中国科学院大学地球与行星科学学院,北京 1000491 StateKeyLaboratoryforMineralDepositsResearch,SchoolofEarthSciencesandEngineering,NanjingUniversity,Nanjing210023,China2 HebeiKeyLaboratoryofGreenDevelopmentofRockandMineralMaterials,SchoolofGemologyandMaterialsScience,HebeiGEOUniversity,Shijiazhuang050031,China3 HebeiProvinceCollaborativeInnovationCenterforStrategicCriticalMineralResearch,Shijiazhuang050031,China4 StateKeyLaboratoryofLithosphericEvolution,InstituteofGeologyandGeophysics,ChineseAcademyofSciences,Beijing100029,China5 CollegeofEarthandPlanetarySciences,UniversityofChineseAcademyofSciences,Beijing100049,China2023 10 22收稿,2023 12 29改回TianEN,XieL,WangRCandWuFY 2024 ThestudyofLi mineralsingraniticpegmatitesfromGyirong,Himalaya.ActaPetrologicaSinica,40(2):484-498,doi:10.18654/1000 0569/2024.02.07Abstract MassiveleucogranitesandgraniticpegmatiteswereexposedintheGyirongregion,themiddleofHimalayanorogen RecentstudiesreportedthattheLiminerals,suchaszinnwaldite,lepidoliteandspodumene,werefoundintheleucogranitesandgraniticpegmatitesfromtheYingxionggouandTsalungdistrictinGyriongpluton Inthisstudy,two typelithium richpegmatitesfromtheTsalungdistrictwereidentifiedbythedetailedpetrographicandmineralogicalstudies,includingspodumenepegmatiteandlepidolite elbaitepegmatite(apliteincluded).ThemajorLi richmineralsinspodumenepegmatitesarespodumene,lepidoliteandpetalitewhichisnew foundinthisstudy Especially,sokolovaite((Cs,K)Li2Al[Si4O10]F2,Cs/(Cs+K)atomicratio>0 5),Cs analoguelepidolite,isfirstlydiscoveredintheHimalayanorogen,withthemarginaloccurrenceadjacenttothelepidoliteandCs2Ocontentupto16 9% ItissuggestedthatsokolovaiteistheproductoflepidolitereactingwithlateCs richfluidsbythemineraltexture Inthelepidolite elbaiteaplite,themainLi richmineralsincludelepidoliteandelbaite Lepidolitecontains0 9%~6 7%Li2Ocontent TourmalinecontainsLi2Ocontentupto2 4%,andlowFeO,MgO,andCaOcontents(<1 1%,<0 01%and2 6%,respectively),closetotheend memberofelbaite CombinedwithabundantpolluciteandmicrolitefoundintheTsalungLi mineralizedpegmatitesinGyirongpluton,itisconfirmedthattheTsalungpegmatiteistypicalLCT(Li Cs Ta) typepegmatite,andthemineralconstitutionandtheirchemicalcompositionsdemonstratethatthepegmatiteisextremelyhigh evolved Keywords Graniticpegmatite;Aplite;Cs richlepidolite;Sokolovaite;Elbaite摘 要 喜马拉雅造山带中部的吉隆岩体出露有大量淡色花岗岩和花岗质伟晶岩,已有文献报道该岩体英雄沟和扎龙沟淡色花岗岩和伟晶岩中有铁锂云母、锂云母、锂辉石等锂矿物产出。
RSC Adv-2015

a
College of Material Chemistry and Chemical Engineering, Hangzhou Normal University, Hangzhou, 310036, China. E-mail: jinhua6903@; Fax: +86-57128866903; Tel: +86-571-28866903 Institute of Analytical and Applied Chemistry, Department of Chemistry, Zhejiang University, Hangzhou, 310027, China Qianjiang College, Hangzhou Normal University, Hangzhou, 310036, China information (ESI) available. See DOI:
RSC Advances
PAPER Thiol-functionalized silica microspheres for online preconcentration and determination of mercury species in seawater by high performance liquid chromatography and inductively coupled plasma mass spectrometry†
1. Introduction
Mercury has become a global environmental concern, especially in the form of methylmercury (MeHg), by virtue of global transport and the biogeochemical cycle.1 The toxicity and bioavailability of mercury are species-specic. It was reported that organomercuric compounds are generally more toxic than inorganic mercuric species and elemental mercury.2 The earth's oceans supply human beings with hundreds and thousands of different kinds of seafood. Considering their high bioaccumulation and biomagnication in the food chain, the amounts of mercury species in seawater are vital to the quality of seafood. Besides, mercury speciation analysis in seawater is benecial to further understand the biogeochemical cycling of mercury.2 The development of accurate and sensitive analytical
MSEA
Author's personal copy
Materials Science and Engineering A 527 (2010) 3245–3252
Contents lists available at ScienceDirect
Materials Science and Engineering A
ห้องสมุดไป่ตู้
scanning electronic microscopy (SEM). The fracture behaviors of the basalt fibers were analyzed from these fractographs. Based on the filament tows model and the statistical theory of fiber strength, a single Weibull statistical model was employed to describe the strength distribution of the basalt filament tows, and the Weibull parameters were obtained by the filament tows testing method. Consistency between the simulated and experimental results indicates that the model and the method are valid and reliable. 2. Experimental 2.1. Basalt fibers The basalt filament tows (as shown in Fig. 1) were manufactured by Hengdian Group Shanghai Russia & Gold Basalt Fiber Co. Ltd. in China. The fineness of the basalt filament tows is 2400tex/21800f (provided by the manufacturer). The diameter of monofilamanet is 7 m. The volume density is 2.6 g/cm3 . The photograph of the bobbin of basalt filament tows is show in Fig. 1. 2.2. Testing The quasi-static tensile tests (with the strain rate of 0.001 s−1 ) and high strain rate tensile tests (impact tensile tests) were performed on a MTS 810.23 materials tester system and a self-designed split Hopkinson tension bar (SHTB) apparatus (as shown in Fig. 2) [12], respectively. The basalt fiber tows were connected with the
IBX氧化的机理研究

Published:February 16,2011ARTICLE/JACSThe Nature of the Catalytically Active Species in Olefin Dioxygenation with PhI(OAc)2:Metal or Proton?Yan-Biao Kang †and Lutz H.Gade*,†,‡†Catalysis Research Laboratory (CaRLa),Im Neuenheimer Feld 584,69120Heidelberg,Germany ‡Anorganisch-Chemisches Institut,Universit €a t Heidelberg,Im Neuenheimer Feld 270,69120Heidelberg,GermanybSupporting Information ABSTRACT:Evidence for the protiocatalytic nature of the diacetoxylation of alkenes using PhI(OAc)2as oxidant is presented.Systematic studies into the catalytic activity in the presence of proton-trapping and metal-complexing agents indicate that protons act as catalysts in the ing tri flic acid as catalyst,the selectivity and reaction rate of the conversion is similar or superior to most e fficient metal-based catalysts.Metal cations,such as Pd(II)and Cu(II),may interact with the oxidant in the initiation phase of the catalytic transformation;however,1equiv of strong acid is produced in the first cycle which then functions as the active catalyst.Based on a kinetic study as well as in situ mass spectrometry,a mechanistic cycle for the proton-catalyzed reaction,which is consistent with all experimental data presented in this work,is proposed.’INTRODUCTIONThere are several classical methods for the dioxygenation of alkenes that are still widely used in organic synthesis.These include two-step-reactions,such as the Woodward -Prevost reaction (pathway a,Scheme 1)1and the epoxidation followed by ring-opening (pathway c).2Both operate under relatively mild reaction conditions,even though the former is not a catalytic reaction.The one-step dioxygenation of alkenes catalyzed by OsO 4,3along with its asymmetric version,the Sharpless dihydroxylation,4are among the most widely used methods but involve an expensive and highly toxic catalyst (pathway b).The development of new e fficient catalytic dioxygenation meth-ods for alkenes has therefore remained a challenge.In recent years,there has been considerable interest in the development of alternative dihydroxylation protocols involving other metal catalysts.With the emergence of palladium(IV)chemistry in catalysis,5-13the dioxygenation of alkenes has been reinvestigated using Pd-or Cu-catalysts instead of the very toxic osmium.14Very recently,Dong et al.reported a Pd(OTf)2-catalyzed diacetoxylation of alkenes using PhI(OAc)215-18as oxidant.14a In this case,a cationic palladium complex with electron-rich diphosphines as ligands as well as the use of the anionic tri flato ligand were claimed to be essential for the reaction because,for instance,Pd(OAc)2itself was found to be inert.Although a Pd IV intermediate was invoked in the proposed catalytic cycle for this reaction,no detailed mechanistic investiga-tions were carried out.Related diacetoxylations were also ob-served as leading to undesired side products in Pd-catalyzedamino acetoxylations.6h It is notable that Chai and co-workers reported the same type of reaction for a copper(II)catalyst,in which the tri flate counterion also proved to be essential.In this case,all other copper salts tested,such as Cu(OAc)2and CuCl 2,were catalytically inert.14b Claims for a mechanism involving Cu III intermediates were based on in situ high resolution mass spectrometry.However,closer inspection of the data revealed signi ficant discrepancies between the expected and observed data,along with the observation of many other unassigned ion peaks,which make this interpretationquestionable.Scheme 1.Approaches for Dioxygenation or Diacetoxylation ofAlkenesReceived:December 2,2010The nature of the active catalyst in both the palladium-and copper-catalyzed diacetoxylations thus remains to be resolved.However,this point is essential for the further development of the method as a synthetic tool.In view of this uncertainty,we set out to further explore the mechanism of dioxygenation reaction of alkenes using PhI(OAc)2as oxidant and to identify the active catalyst(s).In this work,we provide new mechanistic insight into this reaction,both its intramolecular and intermolecular version,the catalytically active species involved,and the key role that tri flate may play as a weakly coordinating anionic ligand or counterion.’RESULTS AND DISCUSSIONScreening of Metal Salts for Catalytic Activity in the Intramolecular Diacetoxylation of Alkenes.As indicated,both palladium and copper salts have been reported as catalysts for the diacetoxylation of alkenes.It was thus essential to establish to which degree these two metals were necessary,or in fact,whether a metal-based catalyst in general was an indis-pensible prerequisite.The results of the screening of metal salts and complexes for the intramolecular diacetoxylation repre-sented in eq 1are summarized in Table 1.Besides Cu(OTf)2and Pd(OTf)2,other transition metal Lewis acids such as Ni(ClO 4)2and Co(BF 4)2were also found to be efficient catalysts,while the corresponding salts with more basic or strongly coordinating counterions,such as Pd(OAc)2,Cu-(OAc)2,CuCl 2,and NiCl 2,proved to be inactive.Surprisingly,we found that alkali earth metal salts also displayed catalytic activity (entries 20-26).For instance,using 0.1mol %of extremely pure Ba(ClO 4)2,a full conversion of 2a was obtained within 20min (entry 26).ICP-OES analysis of the calcium and barium salts established that traces of copper andpalladium in these salts,if present,were well below the 1and 5ppm level,respectively (Supporting Information).Since at these concentrations none of the transition metal salts was found to be active,“hidden ”catalysis by these metals may be ruled out.A similar behavior was observed for the intermolecular diacetox-ylation of styrene with PhI(OAc)2(eq 2).For comparison the conversion curves for the Pd-,Ca-,and TfOH-catalyzed reaction are displayed in Figure 1,using 5mol %of HOTf and [(R )-BINAP-Pd(H 2O)2(OTf)2]as well as 11mol %of Ca(OTf)2.First of all,we note that the Ca(OTf)2catalysis occurs with much lower activity and that [(R )-BINAP-Pd(H 2O)2(OTf)2]and HOTf display very similar activities at the same catalyst loading.However,the metal-catalyzed reactions are characterized by sigmoidal conversion curves which may indicate the (reversible)generation of the catalytically active species in the initial stages of the reaction and its gradual disappearance near the end.Table 1.Catalyst Screening of Metal Salts and Brønsted Acids aentry catalyst loading (mol %)%conv b entry catalyst loading (mol %)%conv b 1Ni(ClO 4)236H 2O110017d Pd(OAc)2162Ni(ClO 4)236H 2O 0.19418d Cu(OAc)2123Ni(ClO 4)236H 2O 0.058819d CuCl 2174Ni(ClO 4)236H 2O 0.011020g Ca(ClO 4)234H 2O 10995Ni(ClO 4)236H 2O 0.001 3.821g Ca(OTf)210996Ni(ClO 4)236H 2O 0.0001122dCaCl 21027cNi(Cl)23glyme 5623Mg(OTf)2101008d Cu(OTf)20.59924Mg(ClO 4)236H 2O101009e Co(BF 4)2109925d ,g Ba(ClO 4)2(99.999%)110010f ,d Pd(L)(H 2O)2(OTf)219926d ,g Ba(ClO 4)2(99.999%)0.12311f ,d Pd(L)(H 2O)2(OTf)20.59627acetic acid (>99.99%)175712f ,d Pd(L)(H 2O)2(OTf)20.259528g HClO 4(99.999%)0.19313f ,d Pd(L)(H 2O)2(OTf)20.19529g tri flic acid (99%)0.18814f ,d Pd(L)(H 2O)2(OTf)20.034330tri fluoroacetic acid 0.1215f ,d Pd(L)(H 2O)2(OTf)20.01331HCl0.1216f ,dPd(L)(H 2O)2(OTf)20.0012324-CF 3-benzoic acid0.12aReaction conditions:1(0.13)mmol;2a (0.1mmol);CH 2Cl 2(1mL).3a forms after a rearrangement of phenyl group in the reaction (see ref 19for details).b Determined by 600MHz 1H NMR.c Refers to NiCl 2-CH 3OCH 2CH 2OCH 3.d Reaction time:20min.e Co(BF 4)236H 2O was used.f (R )-BINAP-Pd(H 2O)2(OTf)2was used.g ICP-OES measurements show the trace amount of metals:Cu <1ppm and Pd<5ppm;see Supporting Information for details.Figure 1.The comparison of the conversion curves for the Pd-,Ca-,and TfOH-catalyzed diacetoxylation of styrene.Note that no in flection point was seen for the tri flic acid-catalyzed transformation.It is clear from these results that high valent Pd IV or Cu III are not necessarily involved in the catalytic diacetoxylation with PhI(OAc)2.Remarkably,several Brønsted acids proved to cata-lyze the reaction,albeit under very speci fic conditions.We note that in a previous study of a noncatalytic version of this reaction 19no conversion had been observed in the presence of a dilute acidic solution.In our investigations of the reaction,very low activity and conversion was found in the presence of AcOH (175mol %,entry 27),while 0.1mol %of HClO 4or HOTf gave rise to complete conversion (entries 28and 29).Again,ICP-OES analyses of the acids established levels of Cu and Pd of below 1and 5ppm,thus again ruling out hidden metal catalysis.However,under the same reaction conditions,other strong acids only induced very low conversions (entries 30-32),thus raising the question as to the speci ficity of the observed acid catalysis.Both metal salts as well as tri flic and perchloric acid thus appear to catalyze the diacetoxylation.The nature of the actual catalytically active species in these reactions therefore remains to be resolved and,in particular,whether there might be a common underlying principle.In Figure 2the conversion curves of the [(R )-BINAP-Pd(H 2O)2(OTf)2]-catalyzed diacetoxylation of styrene with PhI(OAc)2as oxidant (eq 2)are compared for di fferent Pd catalyst loadings (and with HOTf).At all catalyst loadings,the sigmoidal characteristics of the conversion curves,already noticed in Figure 1,are found.At the point of in flection,the activity of the Pd catalyst is essentially the same as that of HOTf at an equal catalyst loading (in this case:5mol %).It appears that for the Pd catalyst,the active species,which we propose to be the “excess ”proton,is being formed initially,an aspect that will be further discussed below.Proton-Trapping Study.To investigate the possible catalytic role of protons in this dioxygenation reaction,proton-trapping agents were added to the reaction in eq 1for various catalysts.As shown in Table 2,the intramolecular reference reaction catalyzed by HOTf was effectively inhibited by either 5mol %of proton sponge (N ,N ,N 0,N 0-tetramethyl-1,8-naphthalenediamine)or 100mol %of Bu 4NOAc (entries 2and 4).On the other hand,EDTA as neutral tetracarboxylic acid,which was added as a metal complexation agent,had no inhibitive e ffect on the Cu(OTf)2,Ba(ClO 4)2,and (R )-BINAP-Pd(H 2O)2-(OTf)2-catalyzed dioxygenation (entries 9,15,and 21),while the ligand EDTA itself (in its neutral,protonated form)was inactive (entry 6).This indicated that the scavenging of the metal by a complexone did not impede the activity of the system.On theother hand,both proton-sponge and Bu 4NOAc were e fficient inhibitors for the Cu(OTf)2-,Pd(OTf)2-,and Ba(ClO 4)2-cata-lyzed reaction (entries 10-13,16-19,22-24)in the presence or absence of EDTA.Analogous proton-trapping experiments were carried out for the intermolecular dioxygenation of styrene with iodobenzene diacetate (eq 2).This reaction proceeded smoothly in the presence of 5mol %of HOTf to give 97%conversion at room temperature within 6h (Table 3,entry 1).When proton sponge or Bu 4NOAc were added at the outset,no conversion was observed even after 24h.In the cases of Cu(OTf)2and Pd(OTf)2,the proton traps also e fficiently suppressed the reaction,and Cu(OAc)2as well as Pd(OAc)2,containing the basic acetate as counteranion,were found to be inactive as noted in previous studies.14In Figure 3the conversion curves of the [(R )-BINAP-Pd-(H 2O)2(OTf)2]-catalyzed diacetoxylation of styrene with or without an equivalent amount of Bu 4N(OAc)are displayed.We note that 1mol of added base essentially quenches 1mol of Pd catalyst.This would be consistent with a mechanistic scenario,in which the catalytically active proton is generated in a first reaction step of the metal complex with the oxygenation agent PhI(OAc)2(vide infra)and is trapped if additional acetate is present.Substrate Scope of the Metal Catalysts and the Proton.The obervations made in the catalyst screening suggested the possibility of theproton alone acting as a catalytically activeFigure 2.The comparison of the catalytic conversion curves for the diacetoxylation of styrene with PhI(OAc)2as oxidant,obtained for di fferent amounts of [(R )-BINAP-Pd(H 2O)2(OTf)2]and compared to 5%of TfOH as catalyst.Table 2.Proton-Trapping Study on the Intramolecular Reaction aentry catalystadditive%conv b1HOTf -992HOTf 5%H-sponge <43HOTf 20%Bu 4NOAc 334HOTf 100%Bu 4NOAc 115HOTf 200%Bu 4NOAc 16EDTA -07AcOH -08Cu(OTf)2-999c Cu(OTf)21%EDTA9910cCu(OTf)21%EDTA þ5%H-sponge 011Cu(OTf)25%H-sponge 012Cu(OTf)220%Bu 4NOAc 713Cu(OTf)2100%Bu 4NOAc 014Ba(ClO 4)2-9915c Ba(ClO 4)21%EDTA9916cBa(ClO 4)21%EDTA þ5%H-sponge 017Ba(ClO 4)25%H-sponge 018Ba(ClO 4)220%Bu 4NOAc 2319Ba(ClO 4)250%Bu 4NOAc <120d Pd(L)(H 2O)2(OTf)2-9921c ,d Pd(L)(H 2O)2(OTf)21%EDTA9922c ,dPd(L)(H 2O)2(OTf)21%EDTA þ5%H-sponge <123dPd(L)(H 2O)2(OTf)25%H-sponge <124dPd(L)(H 2O)2(OTf)220%Bu 4NOAc6aReaction conditions:1(0.13mmol);2a (0.1mmol);catalyst (1mol %);CH 2Cl 2(1mL);20min.Proton sponge refers to N ,N ,N 0,N 0-tetra-methyl-1,8-naphthalenediamine.b Determined by 600MHz 1H NMR.cAdded as neutral tetracarboxylic acid.d (R )-BINAP-Pd(H 2O)2(OTf)2was used.species in the diacetoxylation of alkenes with iodobenzene diacetate.Therefore,the generality of the catalytic capability of protons in this type of reaction had to be established and compared to previous observations made in the apparent metal catalysis.14As shown in Table 4,both copper triflate and triflic acid itself were efficient,the latter possessing only trace amounts of transition metals (<1ppm of Co,Cu,and Ni,<5ppm of Pd).The less reactive substrates required acetic acid as solvent and elevated reaction temperatures (entries 3-9).For the substrates in entries 4and 5possessing longer chains between the carboxyl and acetyloxy groups,both cyclic and acyclic products were observed by 1H NMR.To avoid this problem,water was added to the reaction mixture,which was subsequently worked up by treatment with acetic anhydride to obtain clean diacetoxylations of the terminal alkenes.By tuning the reaction conditions with or without addition of water,both the cyclic ethers and the acyclic diacetoxylation products were obtained,respectively (entries 6and 7).The cyclizations involving carboxyl groups,giving lactones,proceeded more cleanly compared to those of hydroxyl groups,yielding cyclic ethers that may be due to the eliminationof water as a side reaction.Notably,the latter occurred exclusively in the diacetoxylation of 1-allylcyclohexanol 2f in the presence of water (entry 9).As far as the intermolecular version of this reaction is con-cerned,tri flic acid was e fficient for a variety of alkenes.In a comparative study,HOTf gave the same or better yields and diastereoselectivities than the Pd(OTf)2or Cu(OTf)2catalysts (entries 1-4,Table 5).The reactions were carried out with or without water in glacial acetic acid,giving the same yields but quite di fferent diastereoselectivities (entries 3and 4).As dis-cussed below,a possible explanation is the reaction of a non-metalated cyclic cationic intermediate with water,generating a nonacetylated hydroxyl group,which in turn is transformed to OAc after treatment with acetic anhydride in the workup (vide infra).14a Both cis -and trans -stilbene gave the syn-diastereomer as the major product (entries 1-6),which may be due to an intramolecular rotation within the cationic intermediate.Cyclic and terminal aliphatic alkenes also gave good yields and diaster-eoselectivities (entries 7and 8and entries 14and 15)as did styrene itself and its derivates (entries 9and 10).The reaction in wet acetic acid gave the 2-hydroxyl derivative (entries 11and 13),underscoring the interpretation of the role of water given above.In the presence of water in acetic acid,very similar diastereos-electivites were obtained as reported in ref 14a.However,in dry acetic acid,diastereoselectivities decreased,probably due to the change in the attacking nucleophile.For example,cis -stilbene a fforded the diacetoxylation products with the ratio of syn/anti of 10/1and 6/1in our case (entry 4,Table 5)and in ref14a,respectively.When the reactions were carried out in dry acetic acid,in contrast,very low diastereoselectivities were observed both with the palladium catalyst or tri flic acid (entries 2and 3).Finally,the dioxygenation of R ,β-unsaturated ester 4k also gave the corresponding reaction product in moderate yield (entry 16).It is instructive to compare the results obtained in this study for the intra-and intermolecular diacetoxylations/dioxygenations summarized in Tables 4and 5using tri flic acid as catalyst to those obtained previously as well as in our own study as a result ofTable 3.Proton-Trapping Study onthe Intermolecular Reaction of Styrene with Iodobenzene Diacetateentry catalystadditive (mol %)t ,h %conv 1HOTf (5mol %)-6972HOTf (5mol %)6mol %H-sponge 2403HOTf (5mol %)100mol %Bu 4NOAc 2404HOTf (5mol %)6mol %Bu 4NOAc 2405Cu(OTf)2(5mol %)-4446Cu(OTf)2(5mol %)6mol %Bu 4NOAc 4327Cu(OTf)2(5mol %)12mol %Bu 4NOAc 2408Cu(OTf)2(5mol %)6mol %H-sponge 4369Cu(OTf)2(5mol %)12mol %H-sponge 24010(R)BINAP-Pd(H 2O)2(OTf)2(5mol %)-46611(R)BINAP-Pd(H 2O)2(OTf)2(5mol %)6mol %H-sponge 24012(R)BINAP-Pd(H 2O)2(OTf)2(5mol %)6mol %Bu 4NOAc 24013Pd(OAc)2(5mol %)-4014CuCl 2(5mol %)-4015Cu(OAc)2(5mol %)-4aReaction conditions:1(0.5mmol);2(0.25mmol);CH 2Cl 2(0.5mL);AcOH (12.5μL).bDetermined by 600MHz 1H NMR.Figure 3.The comparison of the [(R )-BINAP-Pd(H 2O)2(OTf)2]-catalyzed (3mol %)diacetoxylation of styrene with or without an equivalent amount of Bu 4NOAc:1mol of added base essentially quenches 1mol of Pd catalyst.catalysis by a palladium triflato complex14a as well as copper triflate.14b The intramolecular dioxygenation of2e with triflic acid (entry7,Table4)gave the reaction product in72%yield compared to78%and80%yield reported in the literature using phosphine palladium triflate and copper triflate as catalysts, respectively.14a,b Furthermore,the dioxygenation of2f catalyzed by triflic acid led to almost the same yield of the reaction product as the Pd(dppp)(H2O)2(OTf)2catalyst reported by Dong et al.14a For the intermolecular diacetoxylation reaction,very similar results were obtained under the same reaction conditions.For example,the diacetoxylation of styrene catalyzed by Pd(dppp)-(H2O)2(OTf)2,copper triflate,and triflic acid(entry9,table5) at room temperature gave the corresponding reaction products in90%,80%(at40°C),and91%yields,respectively.The diacetoxylations of4b,4i,and4j catalyzed by triflic acid (Table5)gave the same or higher yields and diastereoselectiv-ities(same major diastereomers)as those catalyzed by the palladium and copper triflate catalysts.14a,b In conclusion,in both the intra-and intermolecular diacetoxylations,triflic acid always gave comparable yields and diastereoselectivities to those ob-tained with the metal triflato complexes.Assuming a general catalytic principal for this transformation,this further supports the aforementioned hypothesis that the diacetoxylation of alkenes with iodobenzene diacetate is a proton-catalyzed reaction.Kinetic Study of the HOTf-Catalyzed Diacetoxylation of Styrene with Iodobenzene Diacetate.The diacetoxylation of styrene with iodobenzene diacetate may be conveniently fol-lowed by1H NMR which was employed in a kinetic study using added2-bromo-1,3-xylene as internal standard.This established a first-order dependence of the reaction rate on both the concentration of HOTf(Figure4)and the oxidant PhI(OAc)2 (Figure5).Remarkably,zeroth order dependence on the reaction rate was established for the substrate styrene(Figure6),indicating a mechanism in which the rate-determining step precedes the interaction of the oxidant with the olefin.In Situ Mass Spectra and Discussion of a Potential Reac-tion Mechanism.In situ high resolution ESI mass spectra recorded during the diacetoxylation of styrene and R-methyl-styrene are depicted in Figure7A and7B,respectively. Samples were taken1-5min after mixing of the reagents and diluted with CH3CN prior to the injection into the mass spectrometer.First of all,we note the presence of peaks at m/z=262.95635, 344.95942,and260.93336,which are assigned to the ions [PhI(OAc)]þ,[PhI(OAc)2-Na]þ,and[PhI(OAc)2-K]þ, respectively.All three species are derived from the oxidizing agent alone and were also found previously in ESI mass spectra of PhI(OAc)2.20Notably,an additional mass peak in Figure7A ata Reaction conditions:1(0.65mmol);2(0.50mmol);solvent(1mL).b Isolated yield.c Reaction product3a is formed by a rearrangement step following the initial diacetoxylation;see ref19.d With3equiv of H2O;after reaction,if treated with acetic anhydride,OH was transformed to OAc.e Using1.0 mmol of2and0.2mL of AcOH.m /z =306.99782and the corresponding peak in Figure 7B at m /z =321.01347are assigned to [PhCCH 2(IPh)]þand [Ph-(Me)CCH 2(IPh)]þ,respectively,which are species generated by the interaction of the oxidant with styrene and R -methylstyrene.They are thought to be derived from one of the key intermediates in the catalytic cycle for the proton-catalyzed diacetoxylation of alkenes.The proposed mechanism of the catalytic cycle for the diacetoxylation of styrene (as example of alkene substrates in general)is represented in Scheme 2.Upon protonation of iodobenzene diacetate,one molecule of AcOH is eliminated,giving rise to the cationic intermediate A .The possibility of the protolytic formation of A has been previously demonstrated and is supported by a series of X-ray crystal structure determinationsaReaction conditions:1(0.65mmol);4(0.50mmol);AcOH (1mL).b Isolated yield.c (R )-BINAP-Pd(H 2O)2(OTf)2was used.d With 3equiv of H 2O;after reaction,if treated with acetic anhydride,OH was transformed to OAc.of such species reported by Ochiai and co-workers.21The cation A was also observed in the HRMS-ESI study discussed above and was previously found in the HRMS-ESI mass spectra of PhI-(OAc)2.20Our kinetic study established first-order dependence of the reaction rate on the concentration of added tri flic acid as well as oxidant but zeroth order dependence on the concentra-tion of the alkene.This suggests that the formation of A is the rate-determining step in the catalytic cycle and that the cationic iodoso reagent is rapidly trapped by the alkene (in this case styrene)to form B .As indicated in the previous section,the formation of B is supported by the observation of the peakm /z =306.99782and the corresponding peak at m /z =321.01347in the in situ recorded HR mass spectra from the diacetoxylation of styrene and R -methylstyrene.These mass peaks are assigned to [PhCCH 2(IPh)]þand [Ph(Me)CCH 2-(IPh)]þ,respectively,which are probably formed by elimination of AcOH from B under the conditions of the HRMS experi-ments.In the following step,intermediate B could be attacked by acetate either from acetic acid attacking externally (pathway b)or,in an intramolecular rearrangement,from OAc in B (pathway a),and both intermediatescould form the cyclic intermediate E ,Figure 4.Dependence of the initial rate on TfOH:(A)Plots of [styrene]vs time using TfOH;(B)initial rate vs TfOH (mol %).Initial rates were calculated as the slopes of time zero using Originlab software.Reaction conditions (initial):[styrene]=0.50M (0.25mmol),[PhI(OAc)2]=0.7M,TfOH (1-7mol %),AcOH (5.0M),CD 2Cl 2,RT,recorded on 600MHz 1H NMR.Figure 5.Dependence of initial rate on initial [PhI(OAc)2]:(A)Plots of [styrene]vs time and (B)initial rate vs initial [PhI(OAc)2].Initial rates were calculated as the slopes of time zero using Originlab software.Reaction conditions:[styrene]=0.50M,[PhI(OAc)2]=0.6-1.0M,[TfOH]=25mM,AcOH (5.0M),CD 2Cl 2,RT,recorded on 600MHz 1H NMR.Figure 6.Dependence of initial rate on initial [styrene]:(A)Plots of [styrene]vs time,(B)initial rate vs initial [styrene].Initial rates were calculated as the slopes of time zero using Originlab software.Reaction conditions:[styrene]=0.30-0.70M,[PhI(OAc)2]=0.7M,[TfOH]=25mM,AcOH (5.0M),CD 2Cl 2,RT,recorded on 600MHz 1H NMR.which had also been proposed by Dong et al.in the published catalytic cycle based on a Pd II /Pd IV catalytic system.14a Finally,the cyclic cation is attacked by AcOH to a fford the diacetoxyla-tion product along with with the liberation of a proton which then acts as catalyst in the next cycle.What remains to be addressed is the role played by the metal dications/metal complexes which catalyze the diacetoxylation of alkenes.The sigmoidal behavior of the conversion curves and the observation of a point of in flection provide an indication that the catalytically active species is being generated during an initiation step.This may be the formation of the cationic key intermediate A ,the generation of which is initially catalyzed by the Lewis acidic metal dications.In the following reaction steps,one excess proton is generated provided that the metal salt or metal complex does not contain a basic counterion such as acetate.The excess proton(s)then act as (more active)catalyst in the subsequent reaction cycle,thus making the proton the e ffective catalyst also in these cases as demonstrated by theabsence of any catalytic activity in the presence of proton-capturing agents.Finally,the presence of chlorido or other potentially coordinating ligands,in turn,will suppress the formation of A due to recombination with the cation and thus deactivation of the actual oxidizing agent.’CONCLUSIONIn this work,we have provided evidence for the protiocatalytic nature of the diacetoxylation of alkenes using PhI(OAc)2as oxidant.Metal cations,such as Pd(II)and Cu(II),may interact with the oxidant in the initiation phase of the catalytic transfor-mation;however,1equiv of strong acid is produced in the first cycle which then functions as the active catalyst.A mechanistic cycle for the protiocatalytic reaction,which is consistent with all experimental data presented in this work,has been proposed.Based on this discovery of proton catalysis for the reaction at hand,we developed the intra-and intermolecular tri flic acid-catalyzed dioxygenation for a range of alkene substrates.On the basis of our observations,particular care has to be taken in the interpretation of metal catalysis involving Ph(OAc)2as a substrate.It is clear that Pd-catalyzed reactions 6performed under basic conditions are not explicable by a simple protolytic scheme as put forward in this work.’ASSOCIATED CONTENTbSupporting Information.Experimental details and char-acterization data.This material is available free of charge via the Internetat .’AUTHOR INFORMATIONCorresponding Authorlutz.gade@uni-hd.deFigure 7.HRMS-ESI experiments for reaction solutions.Reaction conditions:styrene or R -methylstyrene (0.125mmol),PhI(OAc)2(0.25mmol),TfOH (1M in AcOH,50μL),AcOH (0.45mL),RT,1-5min,diluted with CH 3CN before HRMS-ESI tests.Scheme 2.Proposed Mechanism for the TfOH-Catalyzed Intermolecular Diacetoxylation of StyreneBased on the Evidence Presented in This Work’ACKNOWLEDGMENTWe are grateful to Dr.J€u rgen H.Gross(Univ.of Heidelberg) for help concerning the in situ recorded mass spectra.Y.-B.Kang works at CaRLa of the University of Heidelberg,being cofi-nanced by the University of Heidelberg,the state of Baden-W€u rttemberg,and BASF SE.Support from these institutions is greatly acknowledged.’REFERENCES(1)(a)Woodward,R.B.;Brutcher,F.V.J.Am.Chem.Soc.1958,80, 209.(b)Prevost,pt.Rend.1933,196,1129.(2)(a)Hudlicky,M.Oxidations in Organic Chemistry;ACS Mono-graph Series186;American Chemical Society:Washington,DC,1990;p 174.(b)Johnson,R.A.;Sharpless,K.B.In Catalytic Asymmetric Synthesis,2nd ed.;Ojima,I.,Ed.;Wiley-VCH:New York,2000;p357.(c)Haines,A.H.In Comprehensive Organic Synthesis,1st ed.;Trost,B.M.,Fleming,I.,Eds.;Pergamon:Oxford,1991;Vol.7,p437.(3)(a)VanRheenen,V.;Kelly,R.C.;Cha,D.Y.Tetrahedron Lett. 1976,1973.(b)Eames,J.;Mitchell,H.;Nelson,A.;O’Brien,P.;Warren, S.;Wyatt,P.J.Chem.Soc.,Perkin.Trans.11999,1095.(4)(a)Jacobsen,E.N.;Marko,I.;Mungall,W.S.;Schroeder,G.; Sharpless,K.B.J.Am.Chem.Soc.1988,110,1968.(b)Kolb,H.C.;Van Nieuwenhze,M.S.;Sharpless,K.B.Chem.Rev.1994,94,2483.(c) Gonzalez,J.;Aurigemma,C.;Truesdale,anic Syntheses;Wiley: New York,2004;Collect.Vol.10,p603;Org.Synth.2002,79,93.(d) Johnson,R.A.;Sharpless,K.B.In Catalytic Asymmetric Synthesis;,2nd ed.; Ojima,I.,Ed.;VCH:New York,2000.(5)For recent review on Pd(IV):(a)Sehnal,P.;Taylor,R.J.K.; Fairlamb,I.J.S.Chem.Rev.2010,110,824.(b)For a review on reactions of hypervalent iodine reagents with palladium:Deprez,N.R.;Sanford, M.S.Inorg.Chem.2007,46,1924.(c)Mu~n iz,K.Angew.Chem.,Int.Ed. 2009,48,9412.(d)Xu,L.-M.;Li,B.-J.;Yang,Z.;Shi,Z.-J.Chem.Soc.Rev. 2010,39,712.(6)For functionalization of alkenes:(a)Mu~n iz,K.;Hovelmann,C.H.;Streuff,J.J.Am.Chem.Soc.2008,130,763.(b)Mu~n iz,K.; Hovelmann,C.;Streuff,J.;Campos-Gomez,E.Pure Appl.Chem.2008, 80,1089.(c)Mu~n iz,K.;Streuff,J.;Chavez,P.;Hovelmann,C.H.Chem. Asian J.2008,3,1248.(d)Hovelmann,C.H.;Streuff,J.;Brelot,L.; Mu~n iz,mun.2008,2334.(e)Streuff,J.;Hovelmann,C.H.; Nieger,M.;Mu~n iz,K.J.Am.Chem.Soc.2005,127,14586.(f)Bar, G.L.J.;Lloyd-Jones,G.C.;Booker-Milburn,K.I.J.Am.Chem.Soc.2005, 127,7308.(g)Alexanian,E.J.;Lee,C.;Sorensen,E.J.J.Am.Chem.Soc. 2005,127,7690.(h)Liu,G.S.;Stahl,S.S.J.Am.Chem.Soc.2006,128, 7179.(i)Welbes,L.L.;Lyons,T.W.;Cychosz,K.A.;Sanford,M.S. J.Am.Chem.Soc.2007,129,5836.(j)Desai,L.V.;Sanford,M.S.Angew. Chem.,Int.Ed.2007,46,5737.(k)Lyons,T.W.;Sanford,M.S. Tetrahedron2009,65,3211.(l)Hull,K.L.;Sanford,M.S.J.Am.Chem. Soc.2009,131,9651.(m)Schultz,M.J.;Sigman,M.S.J.Am.Chem.Soc. 2006,128,1460.(n)Zhang,Y.;Sigman,M.S.J.Am.Chem.Soc.2007, 129,3076.(o)Wolfe,J.P.;Rossi,M.A.J.Am.Chem.Soc.2004,126, 1620.(p)Lira,R.;Wolfe,J.P.J.Am.Chem.Soc.2004,126,13906.(q) Nakhla,J.S.;Kampf,J.W.;Wolfe,J.P.J.Am.Chem.Soc.2006,128,2893. (r)Fritz,J.A.;Nakhla,J.S.;Wolfe,.Lett.2006,8,2531.(7)For study on Pd(IV)complexes:(a)Whitfield,S.R.;Sanford, M.S.J.Am.Chem.Soc.2007,129,15142.(b)Lanci,M.P.;Remy,M.S.; Kaminsky,W.;Mayer,J.M.;Sanford,M.S.J.Am.Chem.Soc.2009,131, 15618.(c)Dick,A.R.;Kampf,J.W.;Sanford,M.S.J.Am.Chem.Soc. 2005,127,12790.(d)Furuya,T.;Benitez,D.;Tkatchouk,E.;Strom, A.E.;Tang,P.P.;Goddard,W.A.;Ritter,T.J.Am.Chem.Soc.2010,132, 5922.(e)Powers,D.C.;Ritter,T.Nat.Chem.2009,1,302.(8)Recent review on palladium-catalyzed oxidative C-H functio-nalization reactions:(a)Lyons,T.W.;Sanford,M.S.Chem.Rev.2010, 110,1147.(b)Chen,X.;Engle,K.M.;Wang,D.H.;Yu,J.Q.Angew. Chem.,Int.Ed.2009,48,5094.(9)(a)Moritani,I.;Fujiwara,Y.Tetrahedron Lett.1967,1119.(b) Jia,C.;Kitamura,T.;Fujiwara,Y.Acc.Chem.Res.2001,34,633.(10)(a)Stuart,D.R.;Fagnou,K.Science2007,316,1172.(b)Stuart,D.R.;Villemure,E.;Fagnou,K.J.Am.Chem.Soc.2007,129,12072.(c) Stuart,D.R.;Bertrand-Laperle,M.;Burgess,K.M.N.;Fagnou,K.J.Am. Chem.Soc.2008,130,16474.(d)Leclerc,J.P.;Fagnou,K.Angew.Chem., Int.Ed.2006,45,7781.(e)Campeau,L.C.;Schipper,D.J.;Fagnou,K. J.Am.Chem.Soc.2008,130,3266.(f)Liegault,B.;Fagnou,K. Organometallics2008,27,4841.(g)Campeau,L.C.;Stuart,D.R.; Leclerc,J.P.;Bertrand-Laperle,M.;Villemure,E.;Sun,H.Y.;Lasserre, S.;Guimond,N.;Lecavallier,M.;Fagnou,K.J.Am.Chem.Soc.2009 131,3291.(11)(a)Dick,A.R.;Hull,K.L.;Sanford,M.S.J.Am.Chem.Soc. 2004,126,2300.(b)Desai,L.V.;Hull,K.L.;Sanford,M.S.J.Am.Chem. Soc.2004,126,9542.(c)Hull,K.L.;Lanni,E.L.;Sanford,M.S.J.Am. Chem.Soc.2006,128,14047.(d)Desai,L.V.;Malik,H.A.;Sanford, .Lett.2006,8,1141.(e)Deprez,N.R.;Sanford,M.S.J.Am. Chem.Soc.2009,131,11234.(f)Arnold,P.L.;Sanford,M.S.;Pearson, S.M.J.Am.Chem.Soc.2009,131,13912.(12)(a)Wang,X.S.;Truesdale,L.;Yu,J.Q.J.Am.Chem.Soc.2010, 132,3648.(b)Mei,T.S.;Giri,R.;Maugel,N.;Yu,J.Q.Angew.Chem.,Int. Ed.2008,47,5215.(c)Shi,B.F.;Maugel,N.;Zhang,Y.H.;Yu,J.Q. Angew.Chem.,Int.Ed.2008,47,4882.(d)Wang,D.H.;Wasa,M.;Giri, R.;Yu,J.Q.J.Am.Chem.Soc.2008,130,7190.(e)Wang,D.H.;Mei, T.S.;Yu,J.Q.J.Am.Chem.Soc.2008,130,17676.(f)Mei,T.S.;Wang, X.S.;Yu,J.Q.J.Am.Chem.Soc.2009,131,10806.(g)Zhang,Y.H.;Yu, J.Q.J.Am.Chem.Soc.2009,131,14654.(h)Giri,R.;Lam,J.K.;Yu,J.Q. J.Am.Chem.Soc.2010,132,686.(i)Shi,B.F.;Zhang,Y.H.;Lam,J.K.; Wang,D.H.;Yu,J.Q.J.Am.Chem.Soc.2010,132,460.(j)Wasa,M.; Engle,K.M.;Yu,J.Q.J.Am.Chem.Soc.2010,132,3680.(k)Vickers,C.J.;Mei,T.S.;Yu,.Lett.2010,12,2511.(13)(a)Delcamp,J.H.;White,M.C.J.Am.Chem.Soc.2006,128, 15076.(b)Fraunhoffer,K.J.;White,M.C.J.Am.Chem.Soc.2007,129, 7274.(c)Reed,S.A.;White,M.C.J.Am.Chem.Soc.2008,130,3316.(d)Covell,D.J.;White,M.C.Angew.Chem.,Int.Ed.2008,47,6448.(e) Delcamp,J.H.;Brucks,A.P.;White,M.C.J.Am.Chem.Soc.2008,130, 11270.(f)Young,A.J.;White,M.C.J.Am.Chem.Soc.2008,130,14090.(g)Reed,S.A.;Mazzotti,A.R.;White,M.C.J.Am.Chem.Soc.2009,131, 11701.(h)Stang,E.M.;White,M.C.Nat.Chem.2009,1,547.(i)Rice,G.T.;White,M.C.J.Am.Chem.Soc.2009,131,11707.(14)(a)Li,Y.;Song,D.;Dong,V.M.J.Am.Chem.Soc.2008,130, 2962.(b)Seayad,J.;Seayad,A.M.;Chai,.Lett.2010,12, 1412.(15)For reviews on polyvalent iodines:(a)Zhdankin,V.V.;Stang, P.J.Chem.Rev.2008,108,5299.(b)Zhdankin,V.V.;Stang,P.J.Chem. Rev.2002,102,2523.(c)Stang,P.J.;Zhdankin,V.V.Chem.Rev.1996, 96,1123.(d)Ochiai,M.;Miyamoto,.Chem.2008,4229.(e) Ochiai,M.In Chemistry of Hypervalent Compounds;Akiba,K.,Ed.;Wiley-VCH:New York,1999;Chapter12.(f)Dohi,T.;Kita,Y.Chem. Commun.2009,2073.(g)Kita,Y.;Takada,T.;Tohma,H.Pure Appl. Chem.1996,68,627.(h)Uyanik,M.;Ishihara,mun.2009, 2086.(i)Varvoglis,A.Hypervalent Iodine in Organic Synthesis;Academic Press:San Diego,CA,1997.(j)Kitamura,T.;Fujiwara,.Prep. Proced.Int.1997,29,409.(k)Moriarty,.Chem.2005,70, 2893.(l)Wirth,T.Angew.Chem.,Int.Ed.2005,44,3656.(m) Hypervalent Iodine Chemistry;Wirth,T.,Ed.;Springer-Verlag:Berlin, Heidelberg,2003.(16)For oxidative functionalization of carbonyl derivatives and unsaturated compounds:(a)Uyanik,M.;Okamoto,H.;Yasui,T.; Ishihara,K.Science2010,328,1376.(b)Wirth,T.;Hirt,U.H.Tetra-hedron:Asymmetry1997,8,23.(c)Hirt,U.H.;Schuster,M.F.H.; French,A.N.;Wiest,O.G.;Wirth,.Chem.2001,1569.(d) Hirt,U.H.;Spingler,B.;Wirth,.Chem.1998,63,7674.(e) Ochiai,M.;Takeuchi,Y.;Katayama,T.;Sueda,T.;Miyamoto,K.J.Am. Chem.Soc.2005,127,12244.(f)Ochiai,M.;Kitagawa,Y.;Takayama,N.; Takaoka,Y.;Shiro,M.J.Am.Chem.Soc.1999,121,9233.(g)Haas,J.; Piguel,S.;Wirth,.Lett.2002,4,297.(h)Miyamoto,K.;Sei,Y.; Yamaguchi,K.;Ochiai,M.J.Am.Chem.Soc.2009,131,1382.(i) Moroda,A.;Togo,H.Tetrahedron2006,62,12408.(j)Fujita,M.;Kim, W.H.;Sakanishi,Y.;Fujiwara,K.;Hirayama,S.;Okuyama,T.;Ohki,Y.;。
新疆阿克陶县乌孜别里地区流纹岩的形成时代及成因分析
第50卷 第6期Vol.50, No.6, 562–5782021年11月GEOCHIMICANov., 2021收稿日期(Received): 2020-01-03; 改回日期(Revised): 2020-03-21; 接受日期(Accepted): 2020-04-02基金项目: 新疆维吾尔自治区重点研发专项(2019B00011); 新疆维吾尔自治区重大科技专项(2018A03004); 国家自然科学基金(91962215, 41972088); 国家重点研发计划(2019YFC06005201); 第二次青藏科考项目(2019QZKK0802-01); 国家十二五科技支撑项目(2015BAB05B03); 中国科学院广州地球化学研究所135项目(135TP201601)作者简介: 李沛(1986–), 男, 博士研究生, 构造地质学专业。
E-mail:***************** 通讯作者(Corresponding author):WANGHe,E-mail:*************.cn;Tel:+86-20-85290986Geochimica▌ Vol. 50▌ No. 6▌ pp. 562–578▌Nov., 2021新疆阿克陶县乌孜别里地区流纹岩的形成时代及成因分析李 沛1,2, 王 核1*, 普 强3, 丘增旺1,2,闫庆贺1,2, 董 瑞1,2, 张晓宇1,2(1. 中国科学院 广州地球化学研究所 矿物学与成矿学重点实验室, 广东 广州 510640; 2. 中国科学院大学, 北京 100049; 3. 河北省地矿局第五地质大队, 河北 唐山 063000)摘 要: 西昆仑乌孜别里山口南侧一带火山岩地层的时代归属一直存有争议。
该套地层虽普遍发育以流纹岩为主的火山岩系, 但尚未有人对其开展系统的年代学与地球化学研究。
本次研究对该套地层中的流纹岩进行元素地球化学、锆石U-Pb 定年及Hf 同位素的研究。
rigaku 简介
(Teflon) and conductor (acetylene black). The anode is typically pure lithium, lithium intercalated graphite or a lithium alloy. The electrolyte is an organic solvent with added lithium salt to allow the transport of lithium ions between the two electrodes. A separator, which is wetted by the electrolyte system, prevents electronic shorting so that only lithium ions can move back and forth. When the battery is discharging, the Li ions move through the electrolyte towards the cathode and intercalates into the open structure material. The electrons move towards the cathode though the load (upper half of the circuit) and are absorbed by the transition metal oxide or phosphate framework. The transition metal is being reduced decreasing its oxidation state. When the battery is charged, all processes are reversed; the electrons, the Li ions, and the current flow in the opposite direction and transition metal is being oxidized. All that demands certain specific requirements of the cathode material. It should be able intercalate and deintercalate lithium without substantial structural changes in the open framework.
Cheng Hao,2009,Lithos
Transitional time of oceanic to continental subduction in the Dabie orogen:Constraints from U –Pb,Lu –Hf,Sm –Nd and Ar –Ar multichronometric datingHao Cheng a ,b ,⁎,Robert L.King c ,Eizo Nakamura b ,Jeffrey D.Vervoort c ,Yong-Fei Zheng d ,Tsutomu Ota b ,Yuan-Bao Wu e ,Katsura Kobayashi b ,Zu-Yi Zhou aaState Key Laboratory of Marine Geology,Tongji University,Shanghai 200092,ChinabInstitute for Study of the Earth's Interior,Okayama University at Misasa,Tottori 682-0193,Japan cSchool of Earth and Environmental Sciences,Washington State University,Pullman,Washington 99164,USA dCAS Key Laboratory of Crust-Mantle Materials and Environments,School of Earth and Space Sciences,University of Science and Technology of China,Hefei 230026,China eState Key Laboratory of Geological Processes and Mineral Resources,Faculty of Earth Sciences,China University of Geosciences,Wuhan 430074,Chinaa b s t r a c ta r t i c l e i n f o Article history:Received 22August 2008Accepted 9January 2009Available online 8February 2009Keywords:Continental subduction Dabie EclogiteGeochronologyOceanic subduction Tectonic transitionWe investigated the oceanic-type Xiongdian high-pressure eclogites in the western part of the Dabie orogen with combined U –Pb,Lu –Hf,Sm –Nd and Ar –Ar geochronology.Three groups of weighted-mean 206Pb/238U ages at 315±5,373±4and 422±7Ma are largely consistent with previous dates.In contrast,Lu –Hf and Sm –Nd isochron dates yield identical ages of 268.9±6.9and 271.3±5.3Ma.Phengite and amphibole Ar –Ar total fusion analyses give Neoproterozoic apparent ages,which are geologically meaningless due to the presence of excess 40Ar.Plagioclase inclusions in zircon cores suggest that the Silurian ages likely represent protolith ages,whereas the Carboniferous ages correspond to prograde metamorphism,based on the compositions of garnet inclusions.Despite weakly-preserved prograde major-and trace element zoning in garnet,a combined textural and compositional study reveals that the consistent Lu –Hf and Sm –Nd ages of ca.270Ma record a later event of garnet growth and thus mark the termination of high-pressure eclogite –facies metamorphism.The new U –Pb,Lu –Hf and Sm –Nd ages suggest a model of continuous processes from oceanic to continental subduction,pointing to the onset of prograde metamorphism prior to ca.315Ma for the subduction of oceanic crust,while the peak eclogite –facies metamorphic episode is constrained to between ca.315and 270Ma.Thus,the initiation of continental subduction is not earlier than ca.270Ma.©2009Elsevier B.V.All rights reserved.1.IntroductionSubduction zones are essential to the dynamic evolution of the earth's surface due to plate tectonics.Subduction of oceanic and continental crust eventually leads to closure of backarc basins and arc-continent and continent-continent collisions (O'Brien,2001;Ernst,2005;Zheng et al.,2008),forming various types of high-pressure (HP)and ultrahigh-pressure (UHP)metamorphic rocks.Subduction of oceanic lithosphere causes a complex continuum of diagenetic and metamorphic reactions;many kilometres of oceanic lithosphere are ultimately consumed prior to the subsequent continental slab subduction and collision.Subducted continental slabs that detach from the oceanic lithosphere that was dragging them into the mantle are expected to rapidly rise to Moho depths because of their positive buoyancy.Thus,studying subducted oceanic crust in subduction zones can provide clues to the incorporation rate of supercrustal materialinto the mantle and can shed light on the initiation of successive continental subduction.Determining a geochronological framework for determining the sequence and duration of oceanic to continental subduction and HP and UHP metamorphism plays an essential role in this respect.Zircon has long been recognized as a promising geochronometer of the U –Pb decay system because of its refractory nature,commonly preserved growth zones and mineral inclusions within a single grain.Recent developments in analytical techniques allow us to unravel a wealth of information contained in zircons with respect to their growth history and thus the prograde and retrograde metamorphic evolution of the host rock (Gebauer,1996;Wu et al.,2006;Zheng et al.,2007).The Lu –Hf garnet technique has been applied to constrain the prograde and high-temperature histories of metamorphic belts (e.g.,Duchêne et al.,1997;Blichert-Toft and Frei,2001;Anczkiewicz et al.,2004,2007;Lagos et al.,2007;Kylander-Clark et al.,2007;Cheng et al.,2008a )because of its high closure temperature (Dodson,1973;Scherer et al.,2000)and the fact that garnet strongly partitions Lu over Hf,resulting in a high parent/daughter ratio (Otamendi et al.,2002).Combined with Sm –Nd age determination,the Lu –Hf garnet geochronometer can potentially be used to estimate the duration ofLithos 110(2009)327–342⁎Corresponding author.State Key Laboratory of Marine Geology,Tongji University,Shanghai 200092,China.Tel.:+862165982358;fax:+862165984906.E-mail address:chenghao@ (H.Cheng).0024-4937/$–see front matter ©2009Elsevier B.V.All rights reserved.doi:10.1016/j.lithos.2009.01.013Contents lists available at ScienceDirectLithosj ou r n a l h o m e pa g e :ww w.e l s ev i e r.c o m/l o c a t e /l i t h o sFig.1.Simpli fied geologic map of the Huwan mélange area (b)in southern Dabie orogen (a),modi fied after Ye et al.(1993)and Liu et al.(2004b),showing the sample localities for the Xiongdian eclogite.References:asterisk,this study;[1],Ratschbacher et al.(2006);[2],Jahn et al.(2005);[3],Liu et al.(2004a);[4],Eide et al.(1994);[5],Webb et al.(1999);[6],Xu et al.(2000);[7],Ye et al.(1993);[8],Sun et al.(2002);[9],Jian et al.(1997);[10],Jian et al.(2000);[11],Gao et al.(2002);[12],Li et al.(2001);[13],Wu et al.(2008).amp —amphibole;brs —barroisite;phen —phengite;zrn —zircon.328H.Cheng et al./Lithos 110(2009)327–342garnet growth,which either reflects early prograde metamorphism (Lapen et al.,2003),exhumation(Cheng et al.,2009)or a particular garnet growth stage(Skora et al.,2006).Dating the exhumation of high-pressure(HP)and ultra-high-pressure(UHP)metamorphic rocks by conventional step-heating Ar–Ar technique was largely hampered and discredited due to the presence of excess/inherited argon(Li et al.,1994;Kelley,2002).However,the Ar–Ar geochron-ometer remains irreplaceable in constraining the exhumation of HP/ UHP metamorphic rocks because of its intermediate closure tempera-ture.Nevertheless,timing must be integrated with textures and petrology in order to quantify the dynamics of geological processes, whichever geochronological method is used.During the past two decades,considerable progress has been made in constraining the prograde metamorphism and exhumation of HP/ UHP metamorphism of the Dabie–Sulu orogen by a variety of geochronological methods,indicating a Triassic collision between the South China and North China Blocks(e.g.,Eide et al.,1994;Ames et al., 1996;Rowley et al.,1997;Hacker et al.,1998;Li et al.,2000,2004; Zheng et al.,2004).The initiation of continental subduction is pinned to ca.245Ma(Hacker et al.,2006;Liu et al.,2006a;Wu et al.,2006; Cheng et al.,2008a),but the exact time is poorly constrained.On the other hand,thefingerprints of early continental subduction may not be preserved in continental-type metamorphic rocks due to the succes-sive high-temperature prograde and retrograde overprints.Alterna-tively,the timing of initiation of continental subduction subsequent to the termination of oceanic subduction may be registered in the HP/ UHP eclogites,whose protoliths are of oceanic origin.Currently,the only outcropping candidate is the Xiongdian HP eclogite in the western part of the Dabie orogen(Li et al.,2001;Fu et al.,2002).However,U–Pb zircon ages ranging from216±4to449±14Ma have been obtained for the Xiongdian eclogite(Jian et al.,1997;Sun et al.,2002;Gao et al., 2002);the geological significance of this age spread is controversial. Efforts to clarify the geochronological evolution of the Xiongdian eclogite were hampered by a much older Sm–Nd garnet-whole-rock isochron of533±13Ma(Ye et al.,1993)and the fact that further Sm–Nd and Rb–Sr analyses failed to produce mineral isochrons(Li et al., 2001;Jahn et al.,2005),although oxygen isotopic equilibrium was largely attained(Jahn et al.,2005).Here,we present a combined U–Pb,Lu–Hf,Sm–Nd,Ar–Ar and oxygen multi-isotopic and mineral chemical study of the Xiongdian eclogite.The differences in these systems,in conjunction with chemical profiles in garnet porphyroblasts and zircons,provide a window into the time-scales of the oceanic subduction and sub-sequent exhumation.2.Geochronological background and sample descriptionsThe Qinling–Dabie–Sulu orogen in east-central China marks the junction between the North and South China Blocks(Cong,1996; Zheng et al.,2005).The western part of the Dabie orogen,usually termed the West Dabie and sometimes the Hong'an terrane,is separated from the Tongbaishan in the west by the Dawu Fault and from the East Dabie by the Shangma fault in the east(Fig.1a).It contains a progressive sequence of metamorphic zones characterized by increasing metamorphic grade,from transitional blueschist–greenschist in the south,through epidote–amphibolite and quartz eclogite,to coesite eclogite in the north(e.g.,Zhou et al.,1993;Hacker et al.,1998;Liu et al.,2004b,2006b).The Xiongdian eclogites crop out in the northwestern corner of the West Dabie,in the Xiongdian mélange within the Huwan mélange after the definition of Ratschba-cher et al.(2006),in analogy to the terms of the Sujiahe mélange(Jian et al.,1997)and Huwan shear zone(Sun et al.,2002).The Huwan mélange consists of eclogite,gabbro,amphibolite,marble,and quartzite.The eclogitic metamorphic peak for the Xiongdian eclogite is estimated at600–730°C,1.4–1.9GPa(Fu et al.,2002),550–570°C,∼2.1GPa(Liu et al.,2004b)and540–600°C,∼2.0GPa(Ratschbacher et al.,2006),followed by retrogression at530–685°C and∼0.6GPa (Fu et al.,2002).Except for the Xiongdian eclogite,consistent Triassic metamorphic ages have been obtained for other eclogites across the West Dabie (Webb et al.,1999;Sun et al.,2002;Liu et al.,2004a;Wu et al.,2008). This indicates that West Dabie is largely a coherent part of an HP–UHP belt elsewhere in the Dabie–Sulu orogenic belt.Geochronological debate is limited to the Xiongdian eclogite(Fig.1b).U–Pb zircon ages ranging from ca.216to ca.449Ma have been obtained for the Xiongdian eclogite.Jian et al.(1997)reported ca.400,ca.373and 301±0.6Ma ages by ID–TIMS method.Weighted-mean SHRIMP ages range from335±2to424±5Ma(Jian et al.,2000).The Silurian U–Pb zircon ages were interpreted as the age of the protolith,while the Carboniferous ages mark high-pressure metamorphism(Jian et al., 1997,2000).Weighted-mean206Pb/238U SHRIMP U–Pb zircons ages of 433±9,367±10and398±5Ma were interpreted as the protolith age,while323±7and312±5Ma likely date the high-pressure metamorphism(Sun et al.,2002).A Triassic age of216±4Ma together with449±14and307±14Ma weighted-mean206Pb/238U SHRIMP U–Pb zircon ages appear to argue for the involvement of the Triassic subduction in the Xiongdian eclogite(Gao et al.,2002).A garnet-whole-rock Sm–Nd isochron of533±13Ma(Ye et al.,1993)was interpreted to reflect the high-pressure metamorphism age.Several Table1Chemical compositions of the Xiongdian eclogite from the western Dabie.Sample number DB17DB18(Major oxides in%)SiO254.5452.45 TiO20.370.43 Al2O314.6212.35 Fe2O38.7710.15 MnO0.150.16 MgO 6.669.91 CaO10.3510.26 Na2O 2.88 2.65 K2O0.600.28 P2O50.060.05 Cr2O3⁎6601118 NiO⁎137247 L.O.I0.87 1.28 Total99.95100.11 (Trace elements in ppm)Li27.627.0 Be0.560.47 Rb9.7813.8 Sr178130Y12.612.7 Cs0.89 3.67 Ba86552.4 La 2.21 1.77 Ce 5.97 5.12 Pr0.880.80 Nd 4.35 4.10 Sm 1.25 1.26 Eu0.470.39 Gd 1.53 1.52 Tb0.280.29 Dy 1.83 1.91 Ho0.410.42 Er 1.14 1.19 Tm0.190.19 Yb 1.31 1.34 Lu0.200.20 Pb 6.44 1.85 Th0.050.07 U0.110.06 Zr28.828.2 Nb 1.19 1.77 Hf0.870.88 Ta0.050.08⁎In ppm.329H.Cheng et al./Lithos110(2009)327–342Sm –Nd and Rb –Sr analyses failed to produces isochrons (Li et al.,2001;Jahn et al.,2005),which was believed to be due to unequilibrated isotopic systems despite the fact that oxygen isotopic equilibrium was largely attained (Jahn et al.,2005).Phengite 40Ar/39Ar ages of ca.430–350Ma have been explained as the retrograde metamorphic age (Xu et al.,2000).The 310±3Ma phengite 40Ar/39Ar age (Webb et al.,1999)is likely geologically meaningless due to the concave-upward age spectrum,indicating the presence of excess argon.Collectively,existing geochronology provides an apparently con flicting picture for the Xiongdian eclogites.The timing of the oceanic crust subduction and exhumation essentially remains to be resolved.The two eclogites examined in this study were selected based on their mineral assemblages,inclusion types and geological context (Fig.1).The one (DB17)from the east bank of the river to the east of Xiongdian village is a coarse-grained and strongly foliated banded eclogite,composed mainly of garnet,omphacite and phengite.A second (DB18)eclogite was sampled about 50m to the north of DB17and is strongly foliated with a similar mineralogy assemblage but smaller garnet grains.3.MethodsSample preparation,mineral separation and chemical procedures for isotope analysis,instrumentation and standard reference materials used to determine whole rock and bulk mineral compositions,in situ major and trace element analyses (Institute for Study of the Earth's Interior,Okayama University at Misasa,Japan),zircon U –Pb isotope and trace element analyses (China University of Geosciences in Wuhan),Lu –Hf and Sm –Nd isotope analyses (Washington State University),Ar –Ar isotope analyses (Guangzhou Institute of Geo-chemistry,Chinese Academy of Sciences)and oxygen isotope analyses (University of Science and Technology of China)are described in the Appendix .4.Results4.1.Bulk chemical compositionThe Xiongdian eclogites are mainly of basaltic composition,but they show a wide range of major and trace element abundances.Despite the high SiO 2(52–58%)and low TiO 2(0.32–0.43%)contents,Fig.2.Whole rock chemical analysis data.(a)Chondrite-normalized REE distribution patterns of the Xiongdian eclogites.(b)Primitive-mantle-normalized spidergrams of the Xiongdianeclogites.Fig.3.Backscattered-electron images and rim-to-rim major-element compositional zoning pro files of representative garnets in the matrix and as inclusions in zircon.Amp —amphibole;Ap —apatite;Cal —calcite;Cpx —clinopyroxene;Zo —zoisite;Phen —phengite;Omp —omphacite;Qtz —quartz;Zrn —zircon.330H.Cheng et al./Lithos 110(2009)327–342they have MgO=5.1–9.9%,Cr=430–1118ppm,Ni=88–247ppm (Table 1;Li et al.,2001;Fu et al.,2002;Jahn et al.,2005).In contrast to existing LREE-enriched chondritic REE patterns,our samples have rather flat REE patterns around ten times more chondritic abundances with small,both negative and positive Eu anomalies (Fig.2a).Rubidium is depleted and Sr displays enrichment with respect to Ce.Both negative and no Nb anomalies relative to La were observed (Fig.2b).The N-MORB-normalized value of Th is around 0.5,lower than previous reported values of up to 25(Li et al.,2001).4.2.Petrography and mineral compositionThe Xiongdian eclogites occur as thin layers intercalated with dolomite –plagioclase gneiss and phengite –quartz schist (Fu et al.,2002),mainly consisting of garnet,omphacite,epidote (clinozoisite),phengite and minor amphibole,quartz and kyanite (Fig.3).Zircons were observed both as inclusions in garnet porphyroblasts and in the matrix.The samples have similar mineral assemblages,but differ in modal compositions.Omphacite (X Jd =0.46–0.48)is unzoned.Phengite has 3.30–3.32Si apfu and ∼0.4wt.%TiO 2.Garnets range in size from 0.5to 5mm in diameter,either as porphyroblasts or as coalesced polycrystals,mostly with idioblastic shapes with inclusions of quartz,calcite,apatite and omphacite (Fig.3).Garnet is largely homogeneous (Prp 24–25Alm 49–50Grs 24–25Sps 1.5–1.9),but shows a slightly Mn-enriched core (Fig.3d;Table 2).HREEs in large garnet porphyroblasts,such as Yb and Lu,display weak but continuous decreases in concentration from core to rim (Fig.4a),mimicking the MnO zoning pattern,which could be explained by their high af finity for garnet and likely arises from an overall Rayleigh distillation process during early garnet growth (Hollister,1966;Otamendi et al.,2002).However,the limited variation in MREE concentrations,such as Sm and Nd,in garnet with respect to the weak zoning in HREE (Fig.4a)might be explained by growth in an environment where MREEs are not limited and continuously supplied by the breakdown of other phases.Hafnium has a fairly flat pro file (Table 3),re flecting its incompatible character in garnet and absence of Hf-competing reactions involved in garnet growth.Two distinct domains can be de fined in the large garnet porphyroblasts based on the chemical zoning and the abundance of inclusions.These zones are an inclusion-rich core with richer Mn and HREE and an inclusion-free rim with poorer Mn and HREE (Fig.3d).The inclusion-free rim for individual garnet has a rather similar width of 200–250μm (Fig.3).Although concentrations of Nd (0.22–0.41ppm)and Sm (0.33–0.48ppm)vary within single garnet grains,the Sm/Nd ratios (0.8–2.2)are consistentTable 2Representative major-element data of the garnets,omphacites,phengites,amphiboles and zoisites.(wt.%)Grt Omp RimCore Inclusions-in-zircon Rim Core SiO 238.6838.6438.6638.5338.6538.6637.8637.7555.9356.1256.1356.20TiO 20.050.060.050.050.050.050.050.080.120.110.110.11Al 2O 321.9221.9422.0721.9921.9921.8421.6821.8611.2611.2211.3311.26FeO ⁎22.9823.0523.0623.1623.0523.1124.4224.33 4.25 4.23 4.32 4.27MnO 0.680.720.790.880.750.680.990.930.030.020.030.02MgO 6.37 6.38 6.28 6.31 6.36 6.35 4.23 4.748.158.027.968.13CaO 9.108.949.028.929.038.9910.579.5013.2213.3613.3213.34Na 2O 0.030.030.030.030.030.030.020.01 6.65 6.41 6.39 6.42K 2O 0.000.000.000.000.000.000.000.000.000.000.000.00Total 99.8099.7799.9699.8799.9199.7199.8299.2199.6099.6099.7099.87O.N.12121212121212126666Si 2.986 2.984 2.981 2.975 2.980 2.988 2.958 2.962 1.996 2.010 2.010 2.007Al 1.994 1.997 2.006 2.001 1.999 1.990 1.997 2.0210.4740.4730.4780.474Ti 0.0030.0030.0030.0030.0030.0030.0030.0050.0030.0030.0030.003Fe 2+ 1.486 1.491 1.489 1.499 1.489 1.496 1.596 1.5990.1270.1270.1290.128Mn 0.0440.0470.0520.0580.0490.0440.0660.0620.0010.0010.0010.001Mg 0.7330.7350.7220.7260.7310.7320.4930.5540.4340.4280.4250.433Ca 0.7530.7400.7450.7380.7460.7440.8850.7980.5060.5130.5110.511Na 0.0040.0050.0050.0050.0050.0050.0030.0020.4600.4450.4430.445K0.0000.0000.0000.0000.0000.0000.0000.0000.0000.0000.0000.000Phn Amp Zo RimCore Rim Core Mantle Core SiO 248.8649.0949.3349.0147.0847.0746.7246.7539.0538.9239.0239.02TiO 20.400.410.410.400.220.220.220.220.130.130.130.12Al 2O 329.0328.6829.0129.1912.6612.8112.5812.6228.5528.2128.7328.62FeO ⁎ 1.99 1.99 2.00 1.9711.6011.4811.4611.36 6.01 6.01 6.03 6.07MnO 0.000.000.000.010.100.090.090.090.050.050.060.05MgO 2.79 2.77 2.78 2.8012.2012.4712.4412.300.070.060.070.07CaO 0.010.010.010.019.9710.0910.0710.1024.1023.8624.1324.14Na 2O 0.930.920.920.91 2.79 2.77 2.82 2.830.000.000.000.00K 2O 10.009.919.819.780.480.470.470.470.000.000.000.00Total 94.0293.7894.2894.0997.0997.4996.8896.7697.9697.2498.1698.09O.N.111111112323232312.512.512.512.5Si 3.302 3.323 3.318 3.304 6.831 6.800 6.799 6.809 3.008 3.019 3.000 3.003Al 2.313 2.288 2.300 2.319 2.164 2.182 2.158 2.167 2.592 2.579 2.603 2.596Ti 0.0200.0210.0210.0200.0240.0240.0240.0240.0070.0070.0070.007Fe 2+0.1120.1130.1130.111 1.407 1.387 1.394 1.3830.3870.3900.3880.390Mn 0.0000.0000.0000.0000.0120.0120.0120.0120.0040.0040.0040.004Mg 0.2820.2800.2790.282 2.639 2.686 2.699 2.6700.0070.0070.0070.008Ca 0.0010.0010.0010.001 1.550 1.562 1.570 1.577 1.989 1.983 1.988 1.990Na 0.1220.1210.1200.1190.7840.7770.7950.7980.0000.0000.0000.000K0.8620.8550.8420.8410.0890.0870.0880.0880.0000.0000.0000.000⁎Total iron;concentrations reported as wt.%.331H.Cheng et al./Lithos 110(2009)327–342with those obtained by ID-MC-ICPMS (1.9–2.4)within error (Fig.5a),indicating that the Nd isotopic analyses in this study are essentially unaffected by MREE-rich inclusions,likely due to ef ficient mineral picking and/or concentrated H 2SO 4pre-leaching.The consistent Hf concentrations of 0.10–0.13ppm within single grains with those (0.11–0.13ppm)by ID-MC-ICPMS indicates the Hf-rich phases were essentially removed during digestion (Fig.5b).The overall Lu concentration slightly skews towards the garnet rim because of the weak zoning pattern and the spherical geometry effect,i.e.,the outershells dominate the volume of Lu (Cheng et al.,2008a ).The 0.90–0.93ppm Lu contents by ID-MC-ICPMS apparently resemble those of the garnet rim,which could be readily explained by the spherical geometry effect.However,we interpret this with caution because individual garnet porphyroblasts could have different zoning patterns and the individual Lu pro file might not be representative of the population of garnet grains,although the chemical zoning center (nucleation site)coincides with the geometric center (Fig.3d),suggesting asymmetric garnet growth.In addition,biased mineral hand-picking should be considered (Cheng et al.,2008a,b ).Moreover,since the thin-section preparation method for this study cannot ensure that the real center of the garnet was exposed,the observed zoning here likely only represents a minimum zoning of particular garnet porphyroblasts.4.3.Estimation of P –T conditionsMetamorphic peak P –T conditions of 2.2GPa and 620°C for the DB17Xiongdian eclogite (Fig.6)are evaluated on the basis of recent cali-brations of the assemblage garnet+omphacite+phengite+kyanite+quartz,according to the dataset of Holland and Powell (1998).Higher P –T values of 2.4GPa and 650°C are calculated with the calibrations of Krogh Ravna and Terry (2004).While a temperature of 620±29°C is estimated by quartz –garnet O isotope thermometer (Zheng,1993),Ti-in-zircon thermometer (Watson et al.,2006;Ferry and Watson,2007)gives similar value of 695±22°C.Zr-in-rutile thermometer (Watson et al.,2006;Ferry and Watson,2007)yields a lower value of 634–652°C and a similar temperature of 683–701°C (Fig.6)when using the pressure-dependent calibration of Tomkins et al.(2007)at 2.2GPa.Calibration 1uses updated versions of the thermodynamic dataset and activity models in the programs THERMOCALC3.26and AX (Holland,Powell,1998;latest updated dataset;Powell et al.,1998)by using an avPT calculation in the simpli fied model system NCKFMASH with excess SiO 2and H 2O.Calibration 2uses thermobarometry based on the database of Holland and Powell (1998)and activity models for garnet (Ganguly et al.,1996),clinopyroxene (Holland and Powell,1990)and phengite (Holland and Powell,1998).Analyses of garnet,omphacite and phengite (Table 2)were processed according to the two calibrations.Calibration 3uses mineral O isotope compositions (Table 4)to estimate temperature based on the quartz –garnet O isotope thermometer (Zheng,1993).Calibrations 4and 5use Ti contents in zircon by LA-ICPMS and Zr concentration of rutile by SIMS (Table 5)to temperature estimations based on the Ti-in-zircon and Zr-in-rutile thermometers,respectively (Watson et al.,2006;Ferry and Watson,2007;Tomkins et al.,2007).The assemblage of garnet –omphacite –kyanite –phengite –quartz is representative of metamorphic peak conditions of theXiongdianFig.4.Chondrite-normalized REE patterns (Sun and McDonough,1989)of zircons,garnets and omphacite from Xiongdian eclogite (a)and REE distribution patterns between zircon and garnet (b).The equilibrium D REE(Zrn/Grt)values of Rubatto (2002),Whitehouse and Platt (2003)and Rubatto and Hermann (2007)are presented for comparison.Table 3SIMS Sm,Nd,Hf and Lu concentration pro files of the garnets in Figs.4and 5.(ppm)RimCore Cpx Li 0.93 1.140.880.840.890.980.750.520.990.580.690.870.670.7522.1Sr 0.100.130.120.120.100.100.100.120.110.120.130.100.110.1033.5Y 45.646.846.647.346.447.148.350.052.053.553.155.354.657.80.92Hf 0.110.130.120.120.110.110.120.120.120.100.110.100.100.100.41La 0.010.020.020.010.000.000.010.010.010.010.010.010.020.010.02Ce 0.040.050.050.060.050.040.040.040.050.030.040.040.050.030.12Pr 0.010.020.030.020.020.020.020.020.020.020.030.020.020.020.03Nd 0.390.330.280.380.350.270.220.280.340.310.270.410.280.260.36Sm 0.450.360.380.440.470.410.480.450.450.410.340.330.420.410.31Eu 0.270.270.270.280.300.240.280.280.250.300.290.240.250.220.22Gd 1.85 1.96 1.75 1.80 1.85 1.78 1.85 1.84 1.93 1.82 1.57 1.92 1.69 1.530.65Dy 5.68 5.86 5.58 6.18 5.87 5.84 5.79 6.19 6.46 6.40 5.50 6.91 6.09 6.400.26Er 3.74 4.13 4.04 4.25 4.23 4.16 3.76 4.15 4.65 4.99 4.53 4.98 4.63 5.200.06Yb 4.10 4.18 4.01 3.86 4.23 4.11 4.49 4.34 4.97 5.19 5.19 5.65 5.10 5.690.12Lu0.900.910.880.840.840.891.131.151.281.261.261.331.321.420.01332H.Cheng et al./Lithos 110(2009)327–342eclogite.A partly-calibrated thermobarometer is de fined by the three reactions of 3Celadonite +1Pyrope +2Grossular =3Muscovite +6Diopside,2Kyanite+3Diopside =1Pyrope +1Grossular +2Quartz,and 3Celadonite +4Kyanite=3Muscovite +1Pyrope +4Quartz.An intersection point of 2.2GPa and 620°C is de fined and therefore independent of commonly-used Fe –Mg exchange thermometers.This offers an advantage with regards to garnet –clinopyroxene,which is prone to retrograde reactions and problems stemming from ferric iron estimation of omphacite (Li et al.,2005).Results are plotted according to the calibrations mentioned above.The three reactions and intersection points are shown according to programs of calibrations 1–5in Fig.6.4.4.Oxygen isotopic dataThe O isotope compositions of minerals for the two eclogites are presented in Table 4.When paired with quartz for isotope geothermo-metry,garnet,omphacite,phengite,kyanite,zoisite and amphibole yield temperatures of 620±29,563±35,567±43,508±31,404±28and 685±39°C for eclogite DB17,respectively.Because these temperatures are concordant with rates of O diffusion and thus closure temperatures in the mineral assemblage garnet +omphacite +kyanite+phengite+quartz (Zheng and Fu,1998),representative of metamorphic peak conditions,a continuous resetting of O isotopes in the different mineral-pair systems is evident during cooling (Giletti,1986;Eiler et al.,1993;Chen et al.,2007).Quartz –garnet pairs from eclogite DB17give temperatures of 620±29°C,which are consistent with those calibrated by the THERMOCALCmethod,indicating that O isotope equilibrium was achieved and preserved during eclogite –facies recrystallization (Fig.7a).This is also evidenced by the apparent equilibrium fractionation between garnet and omphacite (Fig.7b).In contrast,equilibrium fractionation was not attained between garnets and omphacites in eclogite DB18.The calculated quartz –amphibole pair temperature of 685±39°C is distinctly higher than the 508±31°C from the quartz –zoisite pair.Because oxygen diffusion in amphibole is faster than in zoisite and kyanite (Zheng and Fu,1998),amphibole exchanges oxygen isotopes with water faster than zoisite during retrogression.Consequently,the O isotope temperature increases for the quartz –amphibole pair,whereas the quartz –zoisite temperature decreases relative to the formation temperature.In this regard,the retrograde metamorphism of amphibolite –facies should take place at a temperature between ∼685and ∼508°C.On the other hand,the low quartz –kyanite pair temperature (404±28°C)could be interpreted as a result of in fluence by retrogressive metamorphism without a clear geologicalmeaning.Fig.5.Sm/Nd versus Nd and Lu/Hf versus Hf plots for garnet and whole rock.ID:data obtained by the isotope dilution method using MC-ICPMS.IMS:data obtained by ion microprobe.bombWR —whole rock by bomb-digestion,savWR —whole rock by Savillex-digestion.Error bars for both IMS and ID methods are signi ficantly smaller than thesymbols.Fig.6.Peak P –T estimates of the Xiongdian eclogite.Reactions of py +2gr +3cel =6di +3mu;3di+2ky =py+gr +2q;and 3cel +4ky =py +3mu +4q and intersection points are plotted according to the calibrations of Holland and Powell (1998,latest updated dataset)in solid lines and Krogh Ravna and Terry (2004)in dashed lines.Coesite quartz equilibrium is also shown (Holland and Powell,1998).Abbreviations:alm —almandine,gr —grossular,py —pyrope,cel —celadonite,mu —muscovite,di —diopside,jd —jadeite,coe —coesite.Temperatures estimated by quartz –garnet oxygen isotope thermometry (Zheng,1993),Ti-in-zircon and Zr-in-rutile thermometries (Watson et al.,2006;Tomkins et al.,2007)are also shown.Table 4Oxygen isotope data of minerals for the Xiongdian eclogite.Sample number Mineral δ18O (‰)Pair Δ18O (‰)T 1(°C)T 2(°C)DB17Quartz 12.86,12.66Phengite 10.26,10.14Qtz –Phn 2.57567±43Garnet 8.83,8.85Qtz –Grt 3.93620±29605±22Omphacite 9.64,9.56Qtz –Omp 3.17563±35574±28Zoisite 9.31,9.43Qtz –Zo 3.40508±31494±21Amphibole 9.83,9.60Qtz –Amp 3.06685±39Kyanite 9.36,–Qtz –Ky3.41404±28WR 9.85,9.91DB18Garnet 9.74,9.59Omphacite 8.58,8.48Omp –Grt −1.14WR10.15,9.99T 1and T 2were calculated based on the theoretical calibrations of Zheng (1993)and Matthews (1994),respectively,with omphacite (Jd 45Di 55).Uncertainty on the temperature is derived from error propagation of the average reproducibility of ±15‰for δ18O (‰)values in the fractionation equations.333H.Cheng et al./Lithos 110(2009)327–342。
High-pressure vibrational and optical study of Bi(2)Te(3)
PHYSICAL REVIEW B84,104112(2011)High-pressure vibrational and optical study of Bi2Te3R.Vilaplana,1,*O.Gomis,1F.J.Manj´o n,2A.Segura,3E.P´e rez-Gonz´a lez,4P.Rodr´ıguez-Hern´a ndez,4A.Mu˜n oz,4 J.Gonz´a lez,5,6V.Mar´ın-Borr´a s,3V.Mu˜n oz-Sanjos´e,3C.Drasar,7and V.Kucek71Centro de Tecnolog´ıas F´ısicas,MALTA Consolider Team,Universitat Polit`e cnica de Val`e ncia,46022Valencia,Spain 2Instituto de Dise˜n o para la Fabricaci´o n y Producci´o n Automatizada,MALTA Consolider Team,Universitat Polit`e cnica de Val`e ncia,46022Valencia,Spain3Instituto de Ciencia de Materiales de la Universidad de Valencia—MALTA Consolider Team—Departamento de F´ısica Aplicada,Universitatde Val`e ncia,46100Burjassot,Valencia,Spain4MALTA Consolider Team—Departamento de F´ısica Fundamental II and Instituto Universitario de Materiales y Nanotecnolog´ıa,Universidad de La Laguna,La Laguna,Tenerife,Spain5DCITIMAC,MALTA Consolider Team,Universidad de Cantabria,Avda.de Los Castros s/n,39005Santander,Spain6Centro de Estudios de Semiconductores,Universidad de los Andes,M´e rida5201,Venezuela7Faculty of Chemical Technology,University of Pardubice,Studentsk´a95,53210-Pardubice,Czech Republic(Received8June2011;revised manuscript received25July2011;published9September2011)We report an experimental and theoretical lattice dynamics study of bismuth telluride(Bi2Te3)up to23GPa together with an experimental and theoretical study of the optical absorption and reflection up to10GPa.The indirect bandgap of the low-pressure rhombohedral(R-3m)phase(α-Bi2Te3)was observed to decrease withpressure at a rate of−6meV/GPa.In regard to lattice dynamics,Raman-active modes ofα-Bi2Te3were observedup to7.4GPa.The pressure dependence of their frequency and width provides evidence of the presence of anelectronic-topological transition around4.0GPa.Above7.4GPa a phase transition is detected to the C2/mstructure.On further increasing pressure two additional phase transitions,attributed to the C2/c and disorderedbcc(Im-3m)phases,have been observed near15.5and21.6GPa in good agreement with the structures recentlyobserved by means of x-ray diffraction at high pressures in Bi2Te3.After release of pressure the sample reverts backto the original rhombohedral phase after considerable hysteresis.Raman-and IR-mode symmetries,frequencies,and pressure coefficients in the different phases are reported and discussed.DOI:10.1103/PhysRevB.84.104112PACS number(s):61.50.Ks,62.50.−p,78.20.Ci,78.30.−jI.INTRODUCTIONBismuth telluride(Bi2Te3)is a layered chalcogenide with a tremendous impact for thermoelectric applications.1The thermoelectric properties of Bi2Te3and their alloys have been extensively studied due to their promising operation in the temperature range of300–400K.In fact Bi2Te3is the material with the best thermoelectric performance at ambient temperature.2,3Recently,it has been shown that Bi2Te3can be exfoliated like graphene and that a single layer exhibits high electrical conductivity and low thermal conductivity so that a new nanostructure route can be envisaged to improve dramatically the thermoelectrical properties of this compound by means of either charge-carrier confinement or acoustic-phonon confinement.4,5Bi2Te3is a narrow bandgap semiconductor with tetradymite crystal structure[R-3m,space group(S.G.)166,Z=3].6 This rhombohedral-layered structure is formed by layers, which containfive hexagonal close-packed atomic sublayers (Te-Bi-Te-Bi-Te)and is named a quintuple linked by van der Waals forces.The same layered structure is common to other narrow bandgap semiconductor chalcogenides,like Bi2Se3and Sb2Te3,and has been found in As2Te3at high pressures.7 Bi2Te3,as well as Bi2Se3and Sb2Te3,has been recently predicted to behave as a topological insulator8;i.e.,a new class of materials that behave as insulators in the bulk but conduct electrical current in the surface.The topological insulators are characterized by the presence of a strong spin-orbit(SO) coupling that leads to the opening of a narrow bandgap and causes certain topological invariants in the bulk to differ from their values in vacuum.The sudden change of invariants at the interface results in metallic,time-reversal invariant-surface states whose properties are useful for applications in spintronics and quantum computation.9,10Therefore,in recent years a number of papers have been devoted to the search of the 3D-topological insulators among Sb2Te3,Bi2Te3,and Bi2Se3, and different works observed the features of the topological nature of the band structure in the three compounds.11–13 High-pressure studies are very useful to understand mate-rials properties and design new materials because the increase in pressure allows us to reduce the interatomic distances and tofinely tune the materials properties.It has been verified that the thermoelectric properties of semiconductor chalcogenides improve with increasing pressure,and that the study of the properties of these materials could help in the design of better thermoelectric materials by substituting external pressure by chemical pressure.14–18Therefore,the electrical and thermoelectric properties of Sb2Te3,Bi2Te3,and Bi2Se3, as well as their electronic-band structure,have been studied at high pressures.19–27In fact a decrease of the bandgap energy with increasing pressure was found in Bi2Te3.19,20 Furthermore,recent high-pressure studies in these compounds have shown a pressure-induced superconductivity28,29that has further stimulated high-pressure studies.30However,the pressure dependence of many properties of these layered chalcogenides is still not known.In particular the determi-nation of the crystalline structures of these materials at high pressures has been a long puzzle15,23,31,32and the space groups of the high-pressure phases of Bi2Te3have been elucidatedR.VILAPLANA et al.PHYSICAL REVIEW B84,104112(2011)only recently by powder x-ray diffraction measurements at synchrotron-radiation sources33,34specially with the use of particle-swarm optimization algorithms for crystal-structure prediction.34Recent high-pressure powder x-ray diffraction measure-ments have evidenced a pressure-induced electronic topolog-ical transition(ETT)in Bi2Te3around3.2GPa as a changein compressibility.29,31,32,35,36An ETT or Lifshitz transitionoccurs when an extreme of the electronic-band structure,whichis associated to a Van Hove singularity in the density of states,crosses the Fermi-energy level.37This crossing,which canbe driven by pressure,temperature,doping,etc.,results in achange in the topology of the Fermi surface that changes theelectronic density of states near the Fermi energy.An ETTis a2.5transition in the Ehrenfest description of the phasetransitions so no discontinuity of the volume(first derivativeof the Gibbs free energy)but a change in the compressibility(second derivative of the Gibbs free energy)is expected inthe vicinity of the ETT.Anomalies in the phonon spectrumare also expected for materials undergoing an ETT38,39andhave been observed in a number of materials40,41as well as inSb1.5Bi0.5Te3.31The lattice dynamics of Bi2Te3have been studied ex-perimentally at room pressure42–44and a recent study sug-gests that Raman spectroscopy can be used to monitorthe number of single quintuple layers in nanostructuredBi2Te3,as in graphene.45Theoretical studies of the lat-tice dynamics of Bi2Te3at room pressure have also beenperformed;46–49however,Raman measurements at high pres-sures have only been reported up to0.5GPa,50and to ourknowledge there is no theoretical study of the lattice dynamicsproperties of Bi2Te3under high pressure.As a part of oursystematic study of the structural stability and the vibrationalproperties of the semiconductor chalcogenide family,wereport in this work room-temperature Raman-scattering mea-surements in Bi2Te3up to23GPa together with total-energyand lattice-dynamical ab initio calculations at different pres-sures.We discuss the recent observation of a pressure-inducedETT in the rhombohedral phase ofα-Bi2Te3and study whetherthe Raman-scattering signal of the Bi2Te3at pressures above7.4GPa match with the proposed high-pressure phases recentlyreported for this compound33,34and which have also beenfound in Sb2Te3at high pressures.51II.EXPERIMENTAL DETAILSWe have used single crystals of p-type Bi2Te3that weregrown using a modified Bridgman technique.A polycrystallineingot was synthesized by the reaction of stoichiometricquantities of the constituting elements(5N).Afterward,thepolycrystalline material was annealed and submitted to thegrowth process in a vertical Bridgman furnace.Preliminaryroom-temperature measurements on single crystalline samples(15mm×4mm×0.3mm)yield in-plane electrical resistivityρ⊥c=1.7·10−5 m and Hall coefficient R H(B c)= g0.52cm3C−1.Following the calculation presented in Ref.52,the latter gives hole concentration of7.2·1018cm−3andminority electron concentration of2.1·1017cm−3.A smallflake of the single crystal(100μm×100μm×5μm)was inserted in a membrane-type diamond anvil cell(DAC)with a4:1methanol-ethanol mixture as pressure-transmitting medium,which ensures hydrostatic con-ditions up to10GPa and quasihydrostatic conditions between 10and23GPa.53,54Pressure was determined by the ruby luminescence method.55Unpolarized room-temperature Raman-scattering measure-ments at high pressures were performed in backscattering geometry using two setups:(i)A Horiba Jobin Yvon LabRAM HR microspectrometer equipped with a TE-cooled multichan-nel CCD detector and a spectral resolution below2cm−1. HeNe laser(6328˚A line)was used for excitation.(ii)A Horiba Jobin Yvon T64000triple-axis spectrometer with resolution of1cm−1.In this case an Ar+laser(6470˚A line)was used for excitation.In order not to burn the sample,power levels below2mW were used inside the DAC.This power is higher than that used in Raman measurements at room pressure due to superior cooling of the sample in direct contact with the pressure-transmitting media and the diamonds.Optical transmission and reflection measurements under pressure were performed by putting the DAC in a home-built Fourier Transform infrared(FTIR)setup operating in the mid-IR region(400–4000cm−1).The pressure-transmitting medium was KBr.The setup consists of a commercial TEO-400FTIR interferometer by ScienceTech S.L.,which includes a Globar thermal-infrared source and a Michelson interferome-ter,and a liquid-nitrogen cooled Mercury-Cadmium-Telluride (MCT)detector with wavelength cutoff at25μm(400cm−1) from IR Associates Inc.A gold-coated parabolic mirror focuses the collimated IR beam onto a calibrated iris of1 to3mm diameter.A gold-coated X15Cassegrain microscope objective focuses the IR beam inside the DAC to a size of70–200μm.A second Cassegrain microscope objective collects the transmitted IR beam and sends it to the detector after being focused by another parabolic mirror.In the reflection configuration,aflat gold mirror is placed at45◦before the focusing Cassegrain objective,blocking half of the IR beam. The half-beam let into the DAC is reflected by the sample, then by theflat gold mirror,andfinally focused on the MCT detector by another parabolic mirror.III.AB INITIO CALCULATIONSTwo recent works have reported the structures of the high-pressure phases of Bi2Te3up to52GPa.33,34The rhombohedral(R-3m)structure(α-Bi2Te3)is suggested to transform to the C2/m(β-Bi2Te3,S.G.12,Z=4)and the C2/c (γ-Bi2Te3,S.G.15,Z=4)structures above8.2and13.4GPa, respectively.34Furthermore,a fourth phase(δ-Bi2Te3)has been found above14.5GPa and assigned to a disordered bcc structure(Im-3m,S.G.229,Z=1).33,34In order to explore the relative stability of these phases in Bi2Te3we have performed ab initio total-energy calculations within the density functional theory(DFT)56using the plane-wave method and the pseudopotential theory with the Vienna ab initio simulation package(V ASP)57We have used the projector-augmented wave scheme(PAW)58implemented in this package.Ba-sis set,including plane waves up to an energy cutoff of 320eV,were used in order to achieve highly converged results and accurate descriptions of the electronic properties. We have used the generalized gradient approximation(GGA)HIGH-PRESSURE VIBRATIONAL AND OPTICAL STUDY...PHYSICAL REVIEW B84,104112(2011)for the description of the exchange-correlation energy with the PBEsol59exchange-correlation prescription.Dense special k-points sampling for the Brillouin zone(BZ)integration were performed in order to obtain very well-converged energies and forces.At each selected volume,the structures were fully relaxed to their equilibrium configuration through the calculation of the forces on atoms and the stress tensor.In the relaxed equilibrium configuration,the forces on the atoms are less than0.002eV/˚A and the deviation of the stress tensor from a diagonal hydrostatic form is less than1kbar(0.1GPa). Since the calculation of the disordered bcc phase was not possible to do,we have attempted to perform calculations for the bcc-like monoclinic C2/m structure proposed in Ref.34. The application of DFT-based total-energy calculations to the study of semiconductors properties under high pressure has been reviewed in Ref.60,showing that the phase stability, electronic and dynamical properties of compounds under pressure are well describe by DFT.Furthermore,since the calculation of the disordered bcc phase is not possible to do with the V ASP code,we have attempted to perform calculations for the bcc-like mono-clinic C2/m structure proposed in Ref.34.Also,because the thermodynamic-phase transition between two structures occurs when the Gibbs free energy(G)is the same for both phases,we have obtained the Gibbs free energy of the different phases using a quasiharmonic Debye model61that allows obtaining G at room temperature from calculations performed for T=0K in order to discuss the relative stability of the different phases proposed in the present work.In order to fully confirm whether the experimentally mea-sured Raman scattering of the high-pressure phases of Bi2Te3 agree with theoretical estimates for these phases,we have also performed lattice-dynamics calculations of the phonon modes in the R-3m,C2/m,and C2/c phases at the zone center ( point)of the BZ.Our theoretical results enable us to assign the Raman modes observed for the different phases of Bi2Te3. Furthermore,the calculations also provide information about the symmetry of the modes and polarization vectors,which is not readily accessible in the present experiment.Highly converged results on forces are required for the calculation of the dynamical matrix.We use the direct-force constant approach(or supercell method).62Highly converged results on forces are required for the calculation of the dynamical matrix. The construction of the dynamical matrix at the point of the BZ is particularly simple and involves separate calculations of the forces in which afixed displacement from the equilibrium configuration of the atoms within the primitive unit cell is considered.Symmetry aids by reducing the number of such independent displacements,reducing the computational effort in the study of the analyzed structures considered in this work.Diagonalization of the dynamical matrix provides both the frequencies of the normal modes and their polarization vectors.It allows to us to identify the irreducible representation and the character of the phonon’s modes at the point.In this work we provide and discuss the calculated frequencies and pressure coefficients of the Raman-active modes for the three calculated phases of Bi2Te3.The theoretical results obtained for infrared-active modes for the three calculated phases of Bi2Te3are given as supplementary material of this article.63Finally,we want to mention that we have also checked the effect of the SO coupling in the structural stability and the phonon frequencies of the different phases.We have found that the effect of the SO coupling is very small and did not affect our present results(small differences of1–3cm−1in the phonon frequencies at the point)but increased substantially the computer time so that the cost of the computation was very high for the more complex monoclinic high-pressure phases, as already discussed in Ref.34.Therefore,all the theoretical values corresponding to lattice-dynamics calculations in the present paper do not include the SO coupling.In order to test our calculations,we show in Table I the calculated lattice parameters in the different phases of Bi2Te3at different pressures.For the sake of comparison we show in Table I other theoretical calculations and experimental results available.As far as the R-3m phase is concerned,our calculated lattice parameters are in relatively good agreement with experimental values from Refs.6and36.Our calculations with GGA-PBEsol give values which are intermediate between those calculated with GGA-PBE and local density approximation (LDA),as it is generally known.Additionally,we give the calculated lattice parameters of Bi2Te3in the monoclinic C2/m and C2/c structures at7.7and15.5GPa,respectively,for comparison with experimental data.Note that in Table I the a and b lattice parameters of the C2/m and C2/c structures at7.7and15.5GPa are very similar to those reported by Zhu et al.;34however,the c lattice parameter andβangle for monoclinic C2/m and C2/c structures differ from those obtained by Zhu et al.34The reason is the results of our ab initio calculations are given in the standard setting for the monoclinic structures,in contrast with Ref.34,for a better comparison to future experiments since many experimentalists use the standard setting.IV.RESULTS AND DISCUSSIONA.Optical absorption ofα-Bi2Te3under pressureIt is known thatα-Bi2Te3has an indirect forbidden bandgap, E gap,between130and170meV.19,64–66Figure1shows the optical transmittance of ourα-Bi2Te3sample in the mid-IR region at room pressure outside the DAC.The spectrum near the fundamental absorption edge is dominated by large interferences.The large amplitude of the interference fringe pattern in the transparent region is a result of the high value of the refractive index,that is larger than9.42,65,66The sample transmittance and the interference-fringe amplitude decreases at low-photon energy due to the onset of free-carrier absorption and to high energies due to the fundamental absorption edge caused by band-to-band absorption.The absorption coefficient can be accurately determined from the transmittance spectrum only in a small photon energy range between the end of the interference pattern and the photon energy at which the transmitted intensity merges into noise.In this interval the absorption coefficient exhibits an exponential dependence on the photon energy.This prevents a detailed analysis of the absorption edge shape.Consequently,the optical bandgap has been determined byfitting a calculated transmittance to the experimental one.We calculate the transmittance by assumingR.VILAPLANA et al.PHYSICAL REVIEW B 84,104112(2011)TABLE I.Calculated (th.)and experimental (exp.)lattice parameters,bulk modulus (B 0),and its derivative (B 0 )of Bi 2Te 3in the R -3m structure at ambient pressure and calculated lattice parameters of Bi 2Te 3in the C 2/m and C 2/c structures at 8.4and 15.5GPa,respectively.a(˚A)b(˚A)c(˚A)β(∞)B 0(GPa)B 0 Ref.α-Bi 2Te 3(0GPa)th.(GGA-PBEsol)4.38029.98241.924.89This work th.(GGA-PBESol)a 4.37530.16741.614.68This workth.(GGA-PBE)4.4531.6349th.(GGA-PBE)a 4.4731.1249th.(LDA)a 4.3630.3847exp.4.38530.4976exp.4.38330.38032.5b 10.1b 3640.9c3.2c β-Bi 2Te 3(8.4GPa)th.(GGA-PBESol)14.8834.0669.12189.7341.254.06This workth.(GGA-PBE)d 14.8654.05617.468148.3934exp.d14.6454.09617.251148.4834γ-Bi 2Te 3(15.5GPa)th.(GGA-PBESol)9.8956.9627.70970.3045.283.57This workth.(GGA-PBE)e 9.9567.14610.415134.8634exp.e10.2336.95510.503136.034a Calculations including the SO coupling.bAt room pressure.cAbove 3.2GPa.dAround 12-12.6GPa.eAround 14-14.4GPa.an absorption coefficient with two termsα(E )=A E 2+Be−E gap −E (1)where the first one corresponds to the free-carrier contribution and the second one corresponds to the Urbach tail of the fundamental absorption edge.Equation (1)was used to fit the calculated transmittance spectra to the experimental ones.The dotted line in Fig.1was calculated with Equation (1)by using only A and E gap as fitting parameters,where E gap =159meV at roompressure.FIG.1.(Color online)Experimental transmittance of a 7-μm-thick α-Bi 2Te 3sample at room pressure outside the DAC (solid line).Dotted line indicates the fit of the experimental spectrum.Figure 2shows the Bi 2Te 3transmittance spectrum for several pressures up to 5.5GPa.Above that pressure the signal-to-noise ratio is too low to determine the optical bandgap energy.Figure 3shows the pressure dependence of the optical bandgap of Bi 2Te 3,as determined from the previously described procedure.The pressure coefficient turns out to be −6.4±0.6meV /GPa.This pressure coefficient of the optical bandgap is close to the value we obtained for the pressure dependence of the indirect bandgap from ab initio calculations (−10meV /GPa).From this result it appears that,even if the sample becomes opaque at 5.5GPa,Bi 2Te 3still has a finite bandgap of some 120meV.FIG.2.(Color online)Experimental transmittance of α-Bi 2Te 3at different pressures up to 5.5.GPa.A shift of the absorption edge to low energies is observed with increasing pressure.HIGH-PRESSURE VIBRATIONAL AND OPTICAL STUDY...PHYSICAL REVIEW B84,104112(2011)FIG.3.(Color online)Pressure dependence of the optical bandgap ofα-Bi2Te3according to reflectance(red squares)and to transmittance(black circles)measurements.Sample opacity above5.5GPa seems to be then a result of the free-carrier absorption tail shifting to higher energies as the carrier concentration increases.Consequently,the sample opacity is likely caused by the overlap of the free-carrier absorption tail with the fundamental-absorption tail rather than a real closure of the bandgap.We have to note that our pressure coefficient of the optical bandgap is somewhat smaller in module than the pressure coefficient previously reported for the indirect bandgap:−22meV/GPa19;−12meV/GPa below3GPa;and−60meV/GPa above3GPa.20We have to consider that the estimation of these pressure coefficients in Refs.19and20were indirectly obtained from the pressure dependence of the electrical conductivity and those estimations suffer considerable errors since they assume that the change in resistivity is only due to the change of the indirect bandgap energy,which is not a well-founded assumption in extrinsic degenerate semiconductors.In order to confirm our results on optical absorption we have performed high-pressure reflectance measurements in a3-μm-thick sample whose results are shown in Fig.4.The reflectance spectrum also exhibits a large interference fringe pattern in the transparency region,with amplitude decreasing to lowand high photon energies.The reflectance spectrum at6GPaFIG.4.(Color online)Experimental reflectance ofα-Bi2Te3at different pressures.shows that the sample exhibits a clear onset of the fundamental absorption edge at around120meV and also that the free-carrier absorption edge,even if it has shifted to higher energies, has not overlapped the fundamental absorption.Therefore our reflectance measurements allow us to confirm the results obtained from absorption measurements.Furthermore,the bandgap pressure coefficient,as determined from the shift of the photon energy at which interferences disappear,agrees with the one determined from the transmission spectra.At 7GPa,a clear change in the reflectance occurs,with a large increase of the reflectance by80%in the low-energy range.A large reflectance minimum(not shown here)appears at some 4000cm−1(500meV),suggesting a phase transition to a metallic phase.The metallic nature of the high-pressure phases is in good agreement with previously reported resistivity measurements.17,21,28–30If the reflectance minimum is taken as an estimation of the plasma frequency of the high-pressure phase above7GPa,the carrier concentration would be larger than1021cm−3(assuming the same dielectric constant as in the rhombohedral phase).If the dielectric constant inβphase is much smaller,the carrier concentration should be close to1022cm−3,which is more consistent with the observed superconducting behavior.28–30The shift of the free-carrier absorption tail follows the in-crease of the free-carrier plasma frequency.Then the pressure dependence of the plasma frequency can be estimated from the shift of the photon energy at which the free-carrier absorption tail quenches the interference fringe pattern.Reflectance measurements outside the cell show that the plasma frequency at ambient pressure is below50meV,consistently with the hole concentration that is of the order of7·1018cm−3,as measured by Hall effect.At4.3GPa interference fringes are observed down to some60meV(560cm−1).This upper limit to the plasma frequency would correspond to hole concentration of lower than1019cm−3,typical of a degenerate semiconductor.This increase in the hole concentration should result in a Burstein-Moss positive contribution to the optical bandgap, which explains the discrepancy between the experimental and theoretical value of the bandgap pressure coefficient.The bandgap around5GPa is in fact smaller than the measured optical gap.Given the band structure of Bi2Te3,67with six equivalent minima in the valence band,the density of states is very large and the hole concentration per minimum would be only of some1.5×1018cm−3,which would lead to a Burstein-Moss shift of some50meV for a hole effective mass of0.09m0.68Then even taking into account the Burstein-Moss shift,Bi2Te3at5GPa would still be a low-gap semiconductor. In fact this estimation of the Burstein-Moss shift is based on the ambient-pressure electronic structure.At pressures above the ETT transition the density of states in the valence-band maximum is expected to be much larger as the ellipsoids merge into a thoroidal ring,as proposed by Istkevitch et al.69 Consequently,the Burstein-Moss shift above the ETT should be much lower than50meV.Finally,we must note that our analysis of the optical absorption edge in Bi2Te3have not allowed us to detect any change in the pressure dependence of the indirect bandgap around3GPa to confirm the presence of an ETT as observed in other works.20,29,31,32,35,36The very small change in the pressure coefficient of the indirect bandgap seems not toR.VILAPLANA et al.PHYSICAL REVIEW B 84,104112(2011)FIG.5.Experimental Raman spectra of α-Bi 2Te 3at pressures between room pressure and 7.4GPa.be affected by the ETT since there is no change in volume but in volume compressibility,and the change is very subtle to be measured in our transmission or reflection spectra in comparison with the drastic effects observed in transport measurements or even in the parameters of the Raman modes (as will be discussed in the next section).B.Raman scattering of α-Bi 2Te 3under pressureThe rhombohedral structure of α-Bi 2Te 3is a centrosym-metric structure that has a primitive cell with one Te atom located in a 3a Wyckoff position and the remaining Bi(2)and Te(2)atoms occupying 6c Wyckoff sites.Therefore,group theory allows 10zone-center modes,which decompose in the irreducible representations as follows 70:10=2A 1g +3A 2u +2E g +3E u .(2)The two acoustic branches come from one A 2u and a doubly degenerated E u mode,while the rest correspond to optic modes.Gerade (g)modes are Raman active while ungerade (u)modes are infrared (IR)active.Therefore,there are four Raman-active modes (2A 1g +2E g )and four IR-active modes (2A 2u +2E u ).The E g modes correspond to atomic vibrations in the plane of the layers,while the A 1g modes correspond to vibrations along the c axis perpendicular to the layers.42–44,50Figure 5shows the experimental Raman spectra of α-Bi 2Te 3at different pressures up to 7.4GPa.We have observed and followed under pressure three out of the four Raman-active modes.The E g mode calculated to be close to 40cm −1has not been observed in our experiments as it was also not seen in previous Raman-scattering measurements at room and high pressures.42,50,71–73Figure 6(a)shows the experimental-pressure dependence of the frequencies of the three first-orderRaman modes measured in α-Bi 2Te 3,and Table II summarizes our experimental and theoretical first-order Raman-mode frequencies and pressure coefficients in the rhombohedral phase.Our experimental frequencies at room pressure are in good agreement with those already measured in Ref.42and Ref.50and with those recently measured in Refs.45and 71–73.On the other hand our theoretical frequencies at room pressure are also in good agreement with those reported in Ref.49without SO coupling (see Table II )and are slightly larger than those calculated including SO coupling (see Ref.49).In Fig.6(a)it can be observed that all the measured Raman modes exhibit a hardening with increasing pressure.The experimental values of the pressure coefficients of the Raman-mode frequencies are in a general good agreement with our theoretical calculations and with the values reported in Ref.50up to 0.5GPa;however,a decrease of the pressure coefficient of two modes around 4.0GPa should be noted [see dashed lines in Fig.6(b)].We have attributed the less positive pressure coefficient of these two Raman modes to the pressure-induced ETT observed in Sb 2Te 3and Bi 2Te 3.20,29,31,32,35,36In fact in a previous study in Sb 2Te 3under pressure we have found a change in the pressure coefficient of the frequency of all modes measured.51In order to support our hypothesis we also plot as Fig.6(b)the pressure dependence of the full width at half maximum (FWHM)of the three measured Raman modes.Curiously,it is observed that the FWHM changes its slope around 4GPa thus confirming an anomaly related to the ETT.Therefore,both our results of the pressure dependence of the frequency and linewidth give support to the observation of the ETT around 4.0GPa in α-Bi 2Te 3similarly to the case of α-Sb 2Te 3.51As previously commented,anomalies in the phonon spec-trum are also expected for materials undergoing a ETT and have been observed in Sb 1.5Bi 0.5Te 3.15In the latter work the high-frequency A 1g mode was not altered near the ETT in good agreement with our measurements;however,we have noted a change both in the lower A 1g and the higher-frequency E g modes.Since A 1g modes are polarized in the direction perpendicular to the layers while the E g modes are polarized along the layers,our observation of a less positive pressure coefficient at 4.0GPa of both modes in α-Bi 2Te 3suggests that the ETT in Bi 2Te 3is related to a change of the structural compressibility of both the direction perpendicular to the layers and the direction along the layers.This seems not to be in agreement with Polian et al.’s observations,which suggest that the ETT in Bi 2Te 3only affects the plane of the layers.36Consequently,more work is needed to understand the mechanism of the ETT in this material.To conclude this section regarding the rhombohedral structure of α-Bi 2Te 3,we want to make a comment on the pressure coefficients of the Raman modes of this structure in comparison to those recently measured in α-Sb 2Te 3.51It is known that in chalcogenide laminar materials,the two lowest frequency E and A modes are usually related to shear vibrations between adjacent layers along the a -b plane and to vibrations of one layer against the others along the c axis,respectively.It has been commented that the E mode displays the smallest pressure coefficient due to the weak bending force constant between the interlayer distances (in our case,Te-Te distances)while。
- 1、下载文档前请自行甄别文档内容的完整性,平台不提供额外的编辑、内容补充、找答案等附加服务。
- 2、"仅部分预览"的文档,不可在线预览部分如存在完整性等问题,可反馈申请退款(可完整预览的文档不适用该条件!)。
- 3、如文档侵犯您的权益,请联系客服反馈,我们会尽快为您处理(人工客服工作时间:9:00-18:30)。
[8]BagianteS,ScaleseS,ScuderiV,D’UrsoL,MessinaE,CompagniniG,etal.RoleofthegrowthparametersonthestructuralorderofMWCNTsproducedbyarcdischargeinliquidnitrogen.PhysStatSolB2010;247(4):884–7.[9]ScaleseS,ScuderiV,BagianteS,GibiliscoS,FaraciG,PriviteraV.Orderanddisorderofcarbondepositproducedbyarcdischargeinliquidnitrogen.JAppPhys2010;108(6):064305-1–5.[10]ScaleseS,ScuderiV,BagianteS,GibiliscoS,FaraciG,PilusoN,etal.Morphologyanddistributionofcarbonnanostructuresinadepositproducedbyarcdischargeinliquidnitrogen.PhysE2011.doi:10.1016/j.physe.2011.08.004.[11]IijimaS,IchihashiT,AndoY.Pentagons,heptagonsandnegativecurvatureingraphitemicrotubulegrowth.Nature1992;356(6372):776–8.[12]FerrariAC,MeyerJC,ScardaciV,CasiraghiC,LazzeriM,MauriF,etal.Ramanspectrumofgrapheneandgraphenelayers.PhysRevLett2006;97:187401-1–4.[13]MaitiA,BrabecCJ,RolandC,BernholcJ.Theoryofcarbonnanotubegrowth.PhysRevB1995;52(20):14850–8.
High-resolutionTEMobservationsofisolatedrhombohedralcrystallitesingraphiteblocks
QingYunLina,d,TongQiLib,ZhanJunLiuc,YanSongc,LianLongHea,*,ZiJunHub,QuanGuiGuoc,HengQiangYea
aShenyangNationalLaboratoryforMaterialsScience,InstituteofMetalResearch,ChineseAcademyofSciences,Shenyang110016,China
bNationalKeyLaboratoryofAdvancedFunctionalCompositeMaterials,AerospaceResearchInstituteofMaterials&ProcessingTechnology,
Beijing100076,ChinacKeyLaboratoryofCarbonMaterials,InstituteofCoalChemistry,ChineseAcademyofSciences,Taiyuan030001,China
dGraduateSchoolofChineseAcademyofSciences,Beijing100049,China
ARTICLEINFOArticlehistory:Received4August2011Accepted17January201211
ABSTRACTGraphiteblocksproducedfromnaturalgraphiteflakehavebeenstudiedbyhigh-resolutiontransmissionelectronmicroscopy(HRTEM).Previously,therhombohedralstructurewaswidelyconsideredasamosaicdistributioninahexagonalhostandwasprobablyproducedonlybymechanicalshearormilling.Inpresentinvestigation,isolatedrhombohedralcrys-talliteshavebeendetectedingraphiteblocks,inadditiontothehexagonalhostwithmosaicdistributionsoftherhombohedralphase.Thiswasconfirmednotonlybytheinclinedangleofabout12°between{10–11}planesandthe[0001]direction,butalsotherhombohedralABC...stackingofgraphitebasalplanesbasedontheHRTEMimage.Ó2012ElsevierLtd.Allrightsreserved.
Asaprototypicallayeredmaterial,graphiteformshexago-nalstructureinaplanarcondensedringsystemwithaveryweakbondingbetweengraphenesheets.Normally,tradi-tionalhexagonalgraphitewithAB...stackingsequencealongthec-axishasbeenwellrecognizedsinceitsstructurewasconfirmedin1924[1].However,rhombohedralgraphitewithABC...typestackinglayershasneverbeenisolatedlyob-servedalthoughitsenergyisonly0.11meVatomÀ1higher
thanthatof2Hgraphite[2].Hexagonalgraphite,includingtwographenesintheunitcellwiththestackingsequenceAB...,isgenerallynoted2H,whilerhombohedralgraphiteisnamed3RbecauseofitsstackingsequenceABC...withthreegraphenesasaunitcell.
Supportedbytheoreticalcalculationsandexperiments[3,4],the3Rmodificationisonlyembeddedina2Hhostasamosaicdistributionofmicrocrystallinedefectregionsandrhombohedralstackingonlyextendsover10layerplanesapproximatelywhen2Hstructureissubjectedtoveryseveresheardeformation.Inpresentinvestigation,toauthors’knowledge,itisthefirsttimethatthespecificstackingse-quenceofbasalplanesandlargeregionsofisolatedrhombo-hedralgraphitecrystallitesareobservedingraphiteblocks.Therawmaterialsofthegraphiteblocksconsistedofthefillerofnaturalgraphiteflake(NG),binderofmesophasepitchandrelevantdopantsofSiandTipowders,thesourcesandpropertiesofwhichcanbefoundin[5].Firstly,NGwasmilled
Availableonline24January2012
0008-6223/$-seefrontmatterÓ2012ElsevierLtd.Allrightsreserved.doi:10.1016/j.carbon.2012.01.054
*Correspondingauthor:Fax:+862423971841.E-mailaddress:llhe@imr.ac.cn(L.He).
CARBON50(2012)2347–23742369for20htoobtaintheparticleswiththemeansizeof246lm.AndthenmilledNG,mesophasepitch(29wt.%)aswellasbi-dopants(4wt.%Siand12wt.%Ti)weremixedforabout30mininaball-millingmachinewithpolyethyleneanddis-tilledwaterasthesolvent.Finally,themixturewascompactedinagraphitemoldandpresseduni-axiallytocylindricalbodiesbyahot-pressingapparatuswithaheatingrateof300°C/hupto2700°C;afterheating,theprocessingdwelledfor0.5hunderthisconditionandthenprovidedapressureof30MPa.Duringthefinalprocedure,themixturewouldcreepintosolutiongraduallyandresultedingraphiteblocksthroughthesolutionofdisorderedcarbonandprecipitationofgraphitecrystal[5].Followingthepreparation,X-raydiffraction(XRD)andtransmissionelectronmicroscopy(TEM)observationhavebeenperformedonthegraphiteblockstoinvestigatethemicrostructures.TEMspecimenswerecarefullypreparedbytheconventionalprocessesofslicing,grindingandfinalion-milling.AccordingtotheXRDresultaspresentedinFig.1,asidefromtraditionalhexagonalgraphite,thediffractionpeaksat43.45°and46.32°canbeascribedto{10–11}and{10–12}reflec-tionsofrhombohedralphase.Thefractionofrhombohedralmodificationisapproximately4.8%inthegraphiteblocks,de-rivedbycomparingtheratiooftheintegratedintensitiesforthe{10–11}rhombohedralpeakandthesumofthe{10–11}peakspresentinginthepattern[4].Tounveilthedistributionofthe3R,TEMwasperformedasshowninFigs.2and3.Severalstripsofgraphitegrainwasob-servedalong(0002)planessincethestrongintralayerrbond-ingandweakinterlayerpbondinginducethebasalplanesinclinedtodelaminatewithafinitenumberofgraphenelay-ers,asexhibitedinFig.2(a).Moreover,theselected-areaelec-trondiffraction(SAED)patternat[11–20]zoneaxis,asaninsetofFig.2(a),revealsthecoexistenceof2Hcrystalwithrectangularunitcellsand3Rphasewithrhombicunitcells.Furthermore,thehigh-resolutionTEM(HRTEM)image,asillustratedinFig.2(b),revealsthemosaicdistributionsofrhombohedralstackinginthebackgroundofhexagonalstruc-tures.Duetotheextremelylowstackingfaultenergyof0.51to0.58ergscmÀ2ingraphite[6],profusestackingfaultscan