VisionShow软件说明书
PTV Vision VISUM软件用户手册说明书
TESTING OF THE SYNTHETIC MODEL FOR TRANSPORT DEMAND AND FOR FORECAST ON VEHICLES, THE CASE STADYProfessor dr.sc. Atanasova V., Assoc. prof.dr.sc. Angelevska B. Professor dr.sc. Krstanoski N.Faculty of Technical Sciences, University “St. Kliment Ohridski”, Bitola, MacedoniaAbstract: Choosing a model, shaping and using a model represent a sensitive stage of the transport system planning process. Considering the fact that contemporary software packages exist, based on modern technology and long - term experience it is decided to rely on the software package PTV Vision VISUM, for forecast in the traffic in Bitola town. Synthetic model is designed by this software package, modeling is done on existing situation and model’s calibration. In this paper will be represented testing on the model for transport demand for the city of Bitola, their validation.KEYWORDS: SYNTHETIC MODEL, TRANSPORT DEMAND FORECAST, MODEL’S VALIDATION1.IntroductionThe forecast has always been a big challenge for scientist who conduct research in the field of future prediction and for others. The traffic forecast will be described in this paper for the Bitola town. Considering the fact that contemporary software packages exist, based on modern technology and long - term experience it is decided to rely on the software package PTV Vision – VISUM, for forecast in the traffic in Bitola town. With this software package, modeling is done on existing situation, model’s calibration and forecast on vehicles in Bitola town, for next 10 years.First data collection is done for the purposes of traffic planning. Synthetic model is designed by this software package where as input data are used values performed by counting the traffic at selected intersections in Bitola town.Model’s calibration is done in VISUM, with Projection of routes, tool. Thus simultaneously, testing of results and comparison of numbered model sizes (dimensions) is done and for the same will be presented cooperative view.Based on the created synthetic model, corrections are made and obtained predictions for the size of flows of thoroughfares in Bitola, for next 10 years, individually for the flows of personal cars.The model is based on facts that event A can describe the event B, if the event B contain the essential elements of the event A. According to the basic definition, the model should have ability to “reflect” the appearance that simulates. Formalization of the model is prepared for the final stage of determining the initial model. In this stage the model of general form is transferred to separate and determine the values. The whole procedure of determining these values represent the model’s ca libration. Then follow his validation.The goal of this paper is to represent the model’s validation of the model for transport demand for the city of Bitola, for cars, made in software package PTV Vision VISUM.2.Data collection for build synthetic model fortraffic flow in Bitola town2.1Zoning of the city of BitolaZoning is the process of determining and drawing the zones of a city. Zones are origin and destination of trips within the transport network. They are objects which describe areas with a particular land use and their location within the network (e.g. residential areas, commercial areas, shopping centres, schools).Metropolitan municipality of Bitola was divided on 46 areas in accordance with the recommendations for creating clean zones.2.2. Cordon counting and counting on intersectionsCordon implies notional boundary line around the city of Bitola, and counting of vehicles was carried out on all roads that intersect cordon line.The goal of cordon counting is to provide assessment of the accumulation of vehicles, and purpose of the survey is to give estimates on the number and structure of transit vehicles through the territory of Bitola town.The accumulation of vehicles on cordon line is determined by summing the total number of vehicles entering and leaving the space in a given period. Data collection for cordon counting was made for time of 1 hour, at the time from 2:00 pm to 3:00 pm.Counting on selected intersection in Bitola town was done during the period of 7:00 am. until 9:00 pm., 290 counters were included in two shifts.Data from 38 intersections were analyzed, rush hour was determined and these values were used as input values in the model.Values were written by ,,Turns” tool and then by the help of software flows of links were received.3. Modeling of transport demandModeling is done on existing situation, model’s calibration and forecast on vehicles in Bitola town and synthetic model is designed by software package PTV Vision-VISUMFig. 1 represents nodes and links of the network in the area where research is done. Accordingly, each link was added to the section capacity and vehicles speed. With red color are shown roads with a speed of 50 km / h, with green color are shown roads with a speed of 40 km / h and with blue color are shown roads with a speed of 30 km / h.Figure 1.Graphic display of roads network with different speed.First, in the proces of modeling in exsiting situation,for the purposes of the model is further zoning done. The main area include a different number of zones, so there are 46 zones. Fig. 2 represented the main zones (total 13) with blue, zones (total 40) with green and zones outside the city (total 6) with red color.Figure 2.Separation of the major areas in Zones.Second, we did choosing a model forecast of transport demand. The formulation of the model depends on the initial sizes and input variables that will encompass. The basic definition is that the model should have the ability to "reflect" the appearance that simulates.As input sizes in synthetic model are used the values of the counting of traffic at selected intersections, marked in red and shown on Fig. 3. Also are used data from cordon counting (cordon counting results are given in Section 2.2).Figure 3.Intersections counting in the area where research is done. Model’s calibration is done in VISUM, with Projection of routes, tool. The goal of calibration is bringing on counting and modals sizes together. Thus simultaneously, testing of results and comparison of numbered model sizes (dimensions) is done.Following comparative display of counting values (green color) and model’s sizes (in red) for personal cars.Figure 4.Counted values for cars on intersections, calculate in Visum, presented in sections.Figure 5.Modal values for cars on all network - existing situation.Figure 6.Counted and modal values for cars - existing situation.4. Forecast of traffic flow in Bitola townForecast is scientific prediction of some phenomena that are of great importance to human society. Based oncreatedsynthetic model, corrections are made and forecast on vehicles in Bitola town, for next 10 years.In the process of forecast the increase of 2% annually is taken into account. For the zones 26 and 27, taking into account the DUP (detailed urban plan) in this part of town, taken a balanced growth of 3% annually for the next years, in the process of forecast on vehicles for next 10 years.Figure 7.Forecast on vehicles in Bitola town, for next 10 years.Illustrative, in particular section would look like this: The section between the two junctions Partizanska –Toso Daskalot and Partizanska – Gorgi Naumov, are counted 555 vehicles, while the model gives us the value of 504 vehicles. The projected forecast for 10 years, obtained 651 vehicle.On Fig. 8 counted values are represented by green, and red-values obtained model sizes.Figure 8.An illustrated example for the section Partizanska - Ivo Lola Ribar and Partizanska –VaskoKarangelevski.Figure 9.Forecast on vehicle for next 10 years, on an illustrated example for the section Partizanska -Ivo Lola Ribar and Partizanska –VaskoKarangelevski.5.Model’s validationIn the frame of data collected analysis, in the traffic engineering practice often are used different statistical tests. Common used tests are the following:∙Testing the reliability of the sample,∙Compared or ,,Before and after” tests,∙Unparametric tests.In the actual study model’s validation is made according to the international standards. The cost of the reliability of the model is made according to the Design Manual for Roads and Bridges, Vol 12a, which is released the English Department for Transport. Model is good if it meets the following criteria:∙85% of obtained modal val ues shouldn’t have values of GEH greater than 5. The statistic method GEH isshape of the X2test, which is calculate with thefollowing formula:)(5,0)(2iriiriyyyyGEH+⋅-=Where:- y ri – is traffic flow from the model- y i – is counting traffic flow∙When the maximum deviation is 15%, deviations of modal from the counted values is according to thefollowing criteria:−for flows less than 700 veh/h, difference can be at most 100 veh/h−for flows from 700 to 2000 veh/h, difference can be most to 15%−For flows greater from 2700 veh/h, difference can be at most 400 veh/h.Testing the model, with Assignment analysis tool in software package PTV Vision Visum, got values from 92% (Photo 1) which is quite high value and indicate suitability for modal used.Standard deviation is:99,62)(2=-=∑nyyS iriywhich is as full acceptable value.Photo 1: Model’s validation6.ConclusionUsing the software package PTV Vision –VISUM we made forecast on vehicles in Bitola town, for next 10 years, based on a lot of input data, we got investigation outreach and data collection. We made comparative analyses of counted, modal and forecasted values. From output results can conclude that have an acceptable deviation of modals values from counted values that mean suitability for modal’s usage.Model testing, with Assignment analysis tool in software package PTV Vision Visum, indicate suitability for modal used. In output results for GEH are got values 0 and 1 which is smaller than 5, and with this is meet criteria obtained modal values to have values of GEH smaller than 5. Because this criteria is meet, that means that the model is good. For standard deviations is obtained value 62,99 which is as full acceptable. In this paper are represented photos which represented counted values for cars on intersections, calculate in Visum, presented in sections and obtained modal values for cars on all network.REFERENCES[1] Atanasova V., Ph. D., M.S.E., grad. traffic. Eng."Transport datacollection and analysis", internal lectures, University "St.Kliment Ohridski ", Faculty of Technical Sciences, Bitola, 2011.[2] Atanasova, V., Detelbach, S., Markovik, l., HANDBOOK PTVVision VISUM, Faculty of Technical Sciences, Bitola, 2012 [3] Traffic study for Bitola town, Agreement number 08-1124/1,from 03.06.2010, during one year (June 1 2010 to June 2011). [4] General urban plan of the city of Bitola, I book, Institute ofUrban Planning and Design, LLC, Bitola, Bitola, 1999.[5] Vaska Atanasova, Ph. D., M.S.E., grad. traffic. Eng."TrafficPlanning", internal lectures, University"Ss.Kliment Ohridski ", Faculty of Technical Sciences, Bitola, 2010.[6] Towards sustainable urban transport policies, Recommendationfor local authorities, SMILE project, European Commission, 2004.[7] PTV America, VISUM User Manual, Version 7.50. 2. MODELDESCRlPTlON. 2.1. Network Model. 2-3. 2.1.1. Transport systems, April 2001.。
全能视觉软件说明书(视觉)2015.9.28

视觉联机激光控制软件-使用说明书-深圳市智远数控有限公司目录上层软件使用操作说明第一章驱动和软件的安装 (2)1.1 数控系统软件简介 (3)1.2 控制系统的组成 (3)1.3 驱动和软件的安装 (3)1.3.1视觉驱动MIL的安装与卸载 (4)1.3.2视觉切割软件的安装 (10)1.4软件特点 (13)1.5单反相机应用步骤 (14)1.6界面说明 (15)第二章设备参数的设置 (17)第三章工作面板 (21)3.1 图层管理 (21)3.2 手动控制 (23)3.2.1标定管理 (24)3.2.2 模版切割设置 (29)3.2.3 寻边切割设置 (38)3.2.4寻边切割功能对材料要求 (40)3.3设备控制 (40)3.4加工信息 (41)底层软件/硬件使用说明及接线 (42)第一章概述 (42)1.1 系统功能 (42)第二章安装接线说明 (43)2.1 安装尺寸 (43)2.2 接线说明 (44)2.21 接口板 (44)2.22 接线图 (44)2.3 端口定义说明 (47)2.32 U盘接口 (48)2.33 PC接口 (48)2.34 网络接口 (48)2.35 端口定义 (48)第三章常见问题排除 (51)3.1 电脑连接问题 (51)3.2 U盘读写问题 (51)3.3 相机连接问题 (51)3.4 问题现象: (51)3.5 机器不动作 (52)第四章经典激光切割机接线图 (53)4.1 标准激光切割机接线图 (53)第一章驱动和软件的安装1.1 数控系统软件简介PowerCut视觉激光切割控制软件是深圳市智远数控有限公司集多年行业经验、业内知名研发团队精心打造的一款激光切割数控精品。
该软件简单易学、运动控制算法成熟稳定、切割工艺完备、人机交互界面友好,适用于服装、亚克力、家俱等非金属激光切割控制。
1.2 控制系统的组成控制系统由硬件(运动控制卡及配件)和软件两部分组成。
LEDVISION软件说明书

目录第一章简介 (1)一、概述 (1)二、软件运行环境 (1)第二章安装与卸载 (3)一、软件安装 (3)二、软件卸载 (5)第三章LEDVISION概述 (6)一、认识LEDVISION软件界面 (6)二、节目结构 ............................................................ 错误!未定义书签。
三、菜单和工具条按钮 (7)第四章节目编辑流程 (18)一、设定LED屏幕大小 (18)二、新建节目页 (19)三、添加节目窗 (21)四、添加播放内容条 (27)第五章节目窗的详细制作 (36)一、图片播放 (36)二、视频播放 (39)三、文本播放 (40)四、时钟与计时器显示 (43)五、天气预报播放 (46)六、外部视频播放 (47)七、PowerPoint、Word、Excel 播放 (49)八、Flash、Gif 文件播放 (50)第六章播放通知和体育比分 (52)一、播放通知 (60)二、体育比分 (60)第七章定时播放和控制 (62)一、定时指令表 (62)第八章双模卡内容管理 (65)一、参数设置 (65)二、向接收卡发送图片视频文件 (66)三、向接收卡发送节目文件 (68)第九章电源和亮度控制 (73)一、电源控制 (73)二、亮度调节 (74)第十章LED大屏逐点校正 (75)一、逐点校正技术简介 (75)二、接收卡参数设置中启用校正 (76)三、校正操作 (77)第十一章远程操作 (86)一、设置远程控制服务器 (86)二、客户机远程控制LED显示屏 (87)第十二章软件设置 (89)一、自动设置 (89)二、其他设置 (91)第十三章用户管理 (93)一、用户信息 (93)二、权限 (93)第十四章常见问题解答 (94)第一章简介一、概述LEDVISION是一款用于LED显示屏控制和播放的专业软件。
该软件采用了先进的软件技术,功能丰富、性能优越,兼具良好的操作界面,易学易用。
康耐视视觉软件说明书
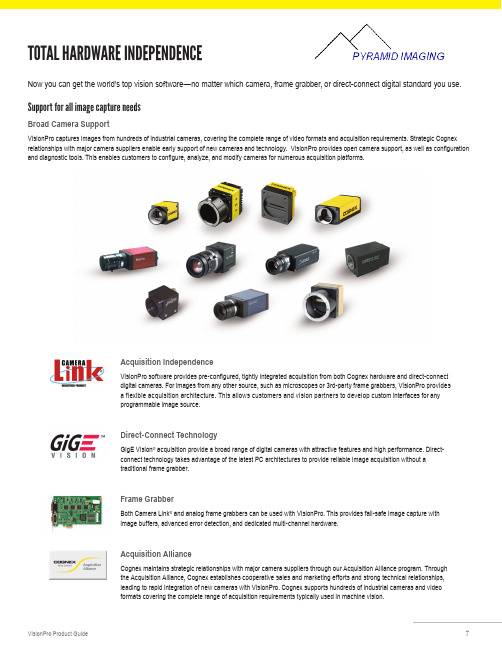
Now you can get the world’s top vision software—no matter which camera, frame grabber, or direct-connect digital standard you use.Support for all image capture needsBroad Camera SupportVisionPro captures images from hundreds of industrial cameras, covering the complete range of video formats and acquisition requirements. Strategic Cognex relationships with major camera suppliers enable early support of new cameras and technology. VisionPro provides open camera support, as well as configuration and diagnostic tools. This enables customers to configure, analyze, and modify cameras for numerous acquisition platforms.Acquisition IndependenceVisionPro software provides pre-configured, tightly integrated acquisition from both Cognex hardware and direct-connect digital cameras. For images from any other source, such as microscopes or 3rd-party frame grabbers, VisionPro provides a flexible acquisition architecture. This allows customers and vision partners to develop custom interfaces for any programmable image source.Direct-Connect TechnologyGigE Vision ® acquisition provide a broad range of digital cameras with attractive features and high performance. Direct-connect technology takes advantage of the latest PC architectures to provide reliable image acquisition without a traditional frame grabber.Frame GrabberBoth Camera Link ® and analog frame grabbers can be used with VisionPro. This provides fail-safe image capture with image buffers, advanced error detection, and dedicated multi-channel hardware.Acquisition AllianceCognex maintains strategic relationships with major camera suppliers through our Acquisition Alliance program. Through the Acquisition Alliance, Cognex establishes cooperative sales and marketing efforts and strong technical relationships, leading to rapid integration of new cameras with VisionPro. Cognex supports hundreds of industrial cameras and videoformats covering the complete range of acquisition requirements typically used in machine vision.TOTAL HARDWARE INDEPENDENCENotes:*1 Cognex Designer is only available with the Development dongle, VC5, CC24 Comm Card, or 8704E GigE Framegrabber*2 3D Measurements Tools are exclusive to the Cognex Displacement Sensor series。
全能视觉软件说明书视觉2015928

视觉联机激光控制软件-使用说明书-深圳市智远数控有限公司目录上层软件使用操作说明第一章驱动和软件的安装 (2)1.1 数控系统软件简介 (3)1.2 控制系统的组成 (3)1.3 驱动和软件的安装 (3)1.3.1视觉驱动MIL的安装与卸载 (4)1.3.2视觉切割软件的安装 (10)1.4软件特点 (13)1.5单反相机应用步骤 (14)1.6界面说明 (15)第二章设备参数的设置 (17)第三章工作面板 (21)3.1 图层管理 (21)3.2 手动控制 (23)3.2.1标定管理 (24)3.2.2 模版切割设置 (29)3.2.3 寻边切割设置 (38)3.2.4寻边切割功能对材料要求 (40)3.3设备控制 (40)3.4加工信息 (41)底层软件/硬件使用说明及接线 (42)第一章概述 (42)1.1 系统功能 (42)第二章安装接线说明 (43)2.1 安装尺寸 (43)2.2 接线说明 (44)2.21 接口板 (44)2.22 接线图 (44)2.3 端口定义说明 (47)2.32 U盘接口 (48)2.33 PC接口 (48)2.34 网络接口 (48)2.35 端口定义 (48)第三章常见问题排除 (51)3.1 电脑连接问题 (51)3.2 U盘读写问题 (51)3.3 相机连接问题 (51)3.4 问题现象: (51)3.5 机器不动作 (52)第四章经典激光切割机接线图 (53)4.1 标准激光切割机接线图 (53)第一章驱动和软件的安装1.1 数控系统软件简介PowerCut视觉激光切割控制软件是深圳市智远数控有限公司集多年行业经验、业内知名研发团队精心打造的一款激光切割数控精品。
该软件简单易学、运动控制算法成熟稳定、切割工艺完备、人机交互界面友好,适用于服装、亚克力、家俱等非金属激光切割控制。
1.2 控制系统的组成控制系统由硬件(运动控制卡及配件)和软件两部分组成。
LEDVISION 使用手册

LEDVISION使用手册目录第一章简介 (1)1.1概述 (1)1.2软件运行环境 (2)第二章安装与卸载 (3)2.1软件安装 (3)2.2软件卸载 (5)第三章 LEDVISION概述 (6)3.1认识LEDVISION软件界面 (6)3.2菜单和工具条按钮 (7)3.3主工具条 (10)3.4播放页面右键菜单 (11)3.5节目编辑工具栏 (11)3.6点播列表 (12)第四章节目编辑 (13)4.1节目播放文件组成 (13)4.2节目结构 (13)4.3节目页 (14)4.4节目窗口 (15)4.5节目编辑流程 (16)第五章节目播放详细说明 (23)5.1视频播放 (23)5.2图片播放 (25)5.3动画播放 (27)5.4O FFICE文件播放 (29)5.5文本播放 (31)5.6时钟播放 (34)5.7计时播放 (37)5.8网页播放 (38)5.9表格播放 (38)5.10数据库播放 (40)5.11天气预报播放 (41)5.12外部视频播放 (44)5.13环境信息播放 (45)5.14体育比分播放 (47)5.15桌面播放 (49)第六章特殊应用播放 (50)6.1播放通知 (50)6.2P OWER P OINT播放 (50)第七章定时播放和控制 (52)7.1定时指令表 (52)第八章电源和亮度控制 (54)8.1电源控制 (54)8.2亮度调节 (55)第九章远程管理 (57)9.1实时显示屏连接 (57)9.2实时显示屏管理 (59)第十章软件设置 (61)10.1软件设置 (61)第十一章用户管理 (64)11.1用户登录 (64)11.2用户信息 (64)11.3权限 (65)第十二章常见问题解答 (66)第一章简介1.1 概述LEDVISION是一款用于LED显示屏控制和播放的专业软件。
该软件功能丰富、性能优越,兼具良好的操作界面,易学易用。
LEDVISION支持视频、音频、图像、文字、Flash、Gif等形式的媒体文件播放;支持Microsoft office的Word、Excel、PPT显示;支持时钟、计时、天气预报显示;支持外部视频信号(TV、AV、S-Video、复合视频)播放;支持多页面多分区节目编辑;软件提供了丰富灵活的视频切换功能、分区特效,以及三维特效动画,让显示屏的显示效果得到完美展现。
视觉软件操作手册电子教案
视觉软件操作手册视觉软件使用手册(Version 1.0)目录第一章总述 (4)第二章配置相机环境 (5)第三章进入主界面 (6)第四章图像处理流程 (8)第五章脚本变量设置 ..................... 错误!未定义书签。
第六章状态机设置 .. (13)第七章信息栏查看 ....................... 错误!未定义书签。
第一章总述该视觉软件是通过摄像装置进行图像处理计算,实现对各个行业不同产品高精度定位、检测等,本文档为软件使用基本操作手册,主要介绍该软件基本操作和具体处理流程的概况以及常见问题的解决方法。
第二章选择相机环境相机设置好IP后,启动软件选择已连接的相机第三章进入主界面软件的主界面如图所示:主界面的布局分为几个部分:顶部是菜单和工具栏;左侧是图像处理流程框;右侧是图像显示区域;左下边是信息栏;下面详细介绍各个部分:1.菜单,工具栏以:菜单栏的层次分布如下:文件保存图像 ----- 保存图像窗口当前图像;测量结果导出excel ----- 对处理结果保存(需脚本语句);设置账户管理----- 登录,添加,删除,修改账户;运动控制卡 ----- 实时数据交换、实时控制;创建坐标系 ----- 绑定坐标系设置启动延时时间 ----- 启动延时设置脚本变量 ----- 添加、修改、删除脚本变量添加Action ----- 添加图像处理功能、设置模板修改当前模板名 ----- 修改配置文件名另存模板 ----- 复制一份文件配置(做另种产品用)工具栏关联了大部分功能性的菜单项。
在未添加图像处理流程前,部分功能是不可用的,显示为灰色。
工具栏图标说明:- 画圆形搜索区域。
添加Action后有效。
- 画矩形搜索区域。
添加Action后有效。
- 画四边形搜索区域。
添加Action后有效。
- 选择合集,交集,差集。
添加Action后有效。
- 选择处理对象与搜索区域。
添加Action后有效。
中达大屏幕管理软件使用手册
显示效果和显示数据。克服了很多软件操作员看不到投影墙上的信号图像、不知道投
影墙上显示的信号状态的弱点。
-2-
8、支持 4:3 摄像机信号的全屏显示:
大屏幕控制软件使用手册
大屏幕显示系统管理软件 Vision DWCS 采用专有的图像实时剪切技术,实现了摄 像机信号图像不变形全屏显示。 9、具有实用的显示信号源的预备与快速调用功能:
可对信号的色彩、亮度等信号参数进行设置、调整。具有信号源信息提示功能,方便
用户随时随地了解每一路信号源的详细信息。支持音频信号源的独立选择播放。
6、支持强大的预案功能:
可方便的实现预案编制、保存、修改、删除,可预设预案执行时间,同时支持使
用“热键”(快捷键)调用预案。
7、强大的信号图像监视功能:
支持各类信号图像在操作员模拟屏上的显示,使操作员能够直观看到投影墙上的
示、共屏显示、叠加显示、任意大小显示、整屏漫游等多种显示模式,可以对窗口风
格、开窗参数、窗口比例、窗口位置、窗口大小等进行设置,支持画中画开窗。可根
据操作使用的便利性需要灵活设置操作员桌面显示方式。
5、全面、灵活、快捷的信号源管理:
可方便、快捷的实现视频信号、RGB 信号、网络信号源的选择调用、切换显示,
目录
大屏幕控制软件使用手册
第一章 软件简介.................................................................................................................... - 2 第二章 软件的组成结构 ........................................................................................................ - 4 第三章 软件的安装与卸载 .................................................................................................... - 6 -
VISUAL SLOPE软件操作说明书
CCD视觉检测软件操作说明书(In-Vision 6.2版本)
工业检测、CCD检测In-Vision6.2视觉检测软件操作说明书功能:1、产品的二维、三维尺寸测量;2、颜色的识别、线材等安装次序的检测;3、字符、条码、二维码的识别;4、金属、塑胶、印刷品、药品、玻璃等表面缺陷检测;5、配合自动化非标设备检测、定位,机器人定位;6、自带影像二次元测量软件。
CCD检测软件In-Vision6.2操作说明目录1软件安装 (1)1.1安装In-Vision6.2软件 (1)1.2安装相机驱动 (2)1.3安装加密狗驱动 (2)1.4安装IO卡驱动 (2)1.5安装串口组件 (3)1.6安装VS2008最小库 (4)1.7安装IO信号管理工具 (4)2软件使用 (5)2.1软件启动 (5)2.2连接相机 (8)2.3界面介绍 (10)2.3.1菜单 (10)2.3.2工具栏 (13)2.3.3任务导航栏 (13)2.3.4相机视图显示栏 (15)2.3.5检测设置和规则设置栏 (16)2.3.6规则设置预览和检测结果预览 (17)2.3.7状态栏 (17)2.3.8鼠标操作 (18)2.4功能介绍及操作流程 (18)2.4.1绘制检测区域 (18)2.4.2设置检测区域定位位置 (20)2.4.3辅助相机聚焦 (22)2.4.4检测规则设置 (22)2.4.5动态跟踪 (40)2.2.6相机标定 (41)2.2.7自定义IO (43)2.2.8结果输出 (43)2.2.9颜色识别 (44)2.2.10目标定位 (45)2.2.11表面缺陷检测 (46)2.2.12影像二次元 (47)2.4部分案例 (48)3关于我们 (54)1软件安装 (55)1.1安装软件 (55)1.2安装相机驱动 (55)1.3安装加密狗驱动 (55)2软件使用 (56)2.1界面介绍 (56)2.1.1菜单 (56)2.1.2工具栏 (58)2.1.3状态栏 (58)2.2功能介绍 (58)2.2.1载入数据 (58)2.2.2相机标定 (59)2.2.3直线距离测量 (59)2.2.4圆测量 (61)2.2.5角度测量 (62)2.2.6修改测量 (63)2.2.7自动捕捉 (63)2.2.8保存测量 (63)1软件安装1.1安装In-Vision6.2软件右键查看属性双击图标进行安装界面默认下一步安装完In-Vision软件1.2安装相机驱动()然后下一步自动安装相机驱动:1.3安装加密狗驱动然后下一步自动安装加密狗驱动:1.4安装IO卡驱动然后下一步自动安装IO卡驱动:1.5安装串口组件1.6安装VS2008最小库1.7安装IO信号管理工具注:整个安装过程一次完成,自动安装所有驱动程序。
- 1、下载文档前请自行甄别文档内容的完整性,平台不提供额外的编辑、内容补充、找答案等附加服务。
- 2、"仅部分预览"的文档,不可在线预览部分如存在完整性等问题,可反馈申请退款(可完整预览的文档不适用该条件!)。
- 3、如文档侵犯您的权益,请联系客服反馈,我们会尽快为您处理(人工客服工作时间:9:00-18:30)。
实用文档
标准
VisionShow软件说明
一、启动软件
1.双击鼠标左键点击程序图标。 或者单击右键选择打开,则会如下图
当出现请输入系统密码时键入初始密码88888888,单击回车,进入软件。
实用文档
标准
二、控制卡参数设置
步骤1:在菜单栏选择系统设置 控制卡设置,输入系统密码键入初始密码88888888单击回车。
系统设置
控制卡设置
实用文档
标准
步骤2:进入控制卡设置界面,单击 建立通讯 与显示屏控制板建立通信。
备注:每次要输入新的数据都要进行建立通讯
建立通讯
实用文档
标准
界面上出现读取控制卡参数正常 控制卡地址=00 说明计算机与控制卡连接正常
步骤3 :参数设置
1、基本参数设置 高度、宽度、通讯方式、串口号、IP地址
高度:LED显示屏纵向点数
宽度:LED显示屏横向点数
通讯方式:串口通讯或是网络通讯
串口号:串口通讯时,串口的选择。
IP地址:网络通讯时,设置IP地址
选择通讯方选择串口高度
宽度
IP地址的设置
读取控制卡参
数正常 控制卡地
址=00
实用文档
标准
2、扫描输出参数设置 单击扫描输出参数
(1)设置控制信号特性
极性相反选择不正确时为黑字 黄底色
使能相反选择不正确时屏幕非常的暗
逆向扫描选择不正确时字是显示镜像
行取反选择不正确时字上下相反
红绿反色选择不正确时发红时出绿字
根据显示屏出现的现象选择!
(2)设置扫描方式选择
户外选择:1/4扫描D
户内选择:1/16扫描
扫描输出参数
控制信号特性
扫描方式选择
实用文档
标准
步骤4:将设置好的参数下载到主板,主板将按照新的参数运行。
单击“是”控制板的基本设置参数完成
单击设置参数:将
设置好的参数下载到主
板,主板将按照新的参数
单击“是”
实用文档
标准
控制卡设置完成
三、传输数据
步骤1:单击一下控制卡,设置高度、宽度、通讯方式、
宽度和高度的设置根据显示屏的横、纵点数来设置,设置后显示的黑屏就是显示屏的虚拟屏。
通讯方式的设置根据连接的方式是串口通讯还是网络通讯。
控制卡设置成功
控制卡
黑
屏
实用文档
标准
步骤2:单击显示页面设置,设置所发数据在显示屏上显示的时间。时间以秒计算
步骤3:添加数据,在红色框里选择添加自己所要添加的文本、word对象、图片、时钟。
实例:
通常我们使用的是“单行文本”
出现如下图所示
显示设置
页面显示时间设置
选择添加数据样
在此处单击
后增加“单
行文本”
实用文档
标准
然后在单行文本上双击鼠标左键,如下图示
实用文档
标准
在文字输入窗口中输入要发送到屏幕上的文字例如“欢迎光临哈尔滨依格电子”后再单击”确定”按钮如下图
注意:一定要单击确定才能保存改变文字
也
可以用鼠标拖动文本框的边角上的白方块改变大小,点住左键来移动文本框的位置.总而言之:
整个文本框的.字的颜色,大小,尺寸,位置, 显示方式(左滚动右滚动上翻页等)各种属性都在”对象属性的对
应栏里更改.
当更改完成后:我们再单击”显示页面1”
单击此处更改字
此处更改数字改变字大小
此处更改字的进入方式
此处更改数
字更改单行
文本的宽度
实用文档
标准
设置页面的显示时间和显示速度:页面显示时间从0—999999999秒内选择,单行
文本字最多可以输入32768个汉字.显示速度一级最慢,八级最快.
这样我们就完成了单行文本的输入,然后单击上面(图1-1)标注的位置的类似卫星
的图标发送内容到显示屏上.
,
在此处修改这
个页面显示的
时间
单击这里把改好的内容发送到
屏幕上(图1—1)
实用文档
标准
单击”添加显示页”然后再重复上面的添加文本的操作,
实用文档
标准
三.增加时间窗口
比较重要的是”时间格式属性:这里可以选择:
年月日格式 ,但是只能选择一种,如果想要年
单击此处增加
时间窗口
在此对象属性栏
中修改日期时间
的属性.和单行文
本的修改类似,修
改完成后把位置
调整好,再发送到
屏幕上
实用文档
标准
月日,时分秒都显示的话,需要再增加一个”日期时间”然后排好两个日期时间窗口
的位置,选好时间格式.再发送到显示屏上.
再次单击增
加,再排好位
置