IELTS写作task1--9分范文(33篇)

001
The chart and graph below give information about sales and share prices for Coca-Cola. Write a report for a university lecturer describing the information shown below.
You should write at least 150 words.
You should spend about 20 minutes on this task.
The pie chart shows the worldwide distribution of sales of Coca-Cola in the year 2000 and the graph shows the change in share prices between 1996 and 2001.
In the year 2000, Coca-Cola sold a total of 17.1 billion cases of their fizzy drink product worldwide. The largest consumer was North America, where 30.4 per cent of the total volume was purchased. The second largest consumer was Latin America. Europe and Asia purchased 20.5 and 16.4 per cent of the total volume respectively, while Africa and the Middle East remained fairly small consumers at 7 per cent of the total volume of sales.
Since 1996, share prices for Coca-Cola have fluctuated. In that year, shares were valued at approximately $35. Between 1996 and 1997, however, prices rose significantly to $70 per share. They dipped a little in mid-1997 and then peaked at $80 per share in mid-98. From then until 2000 their value fell consistently but there was a slight rise in mid-2000.
002
The chart below gives information about global sales of games software, CDs and DVD or video.
Write a report for a university lecturer describing the information.
You should write at least 150 words.
You should spend about 20 minutes on this task.
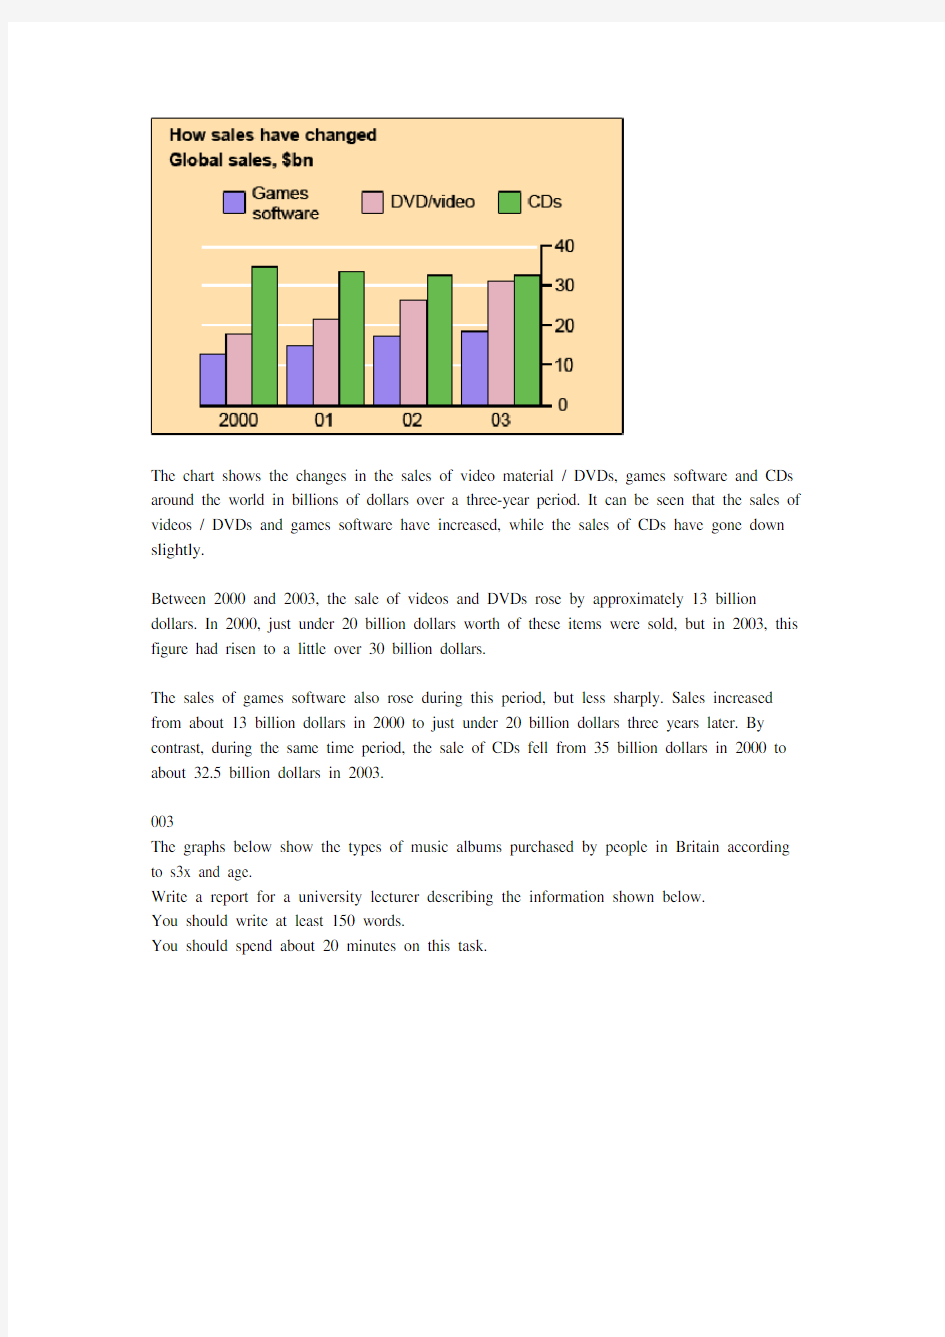
The chart shows the changes in the sales of video material / DVDs, games software and CDs around the world in billions of dollars over a three-year period. It can be seen that the sales of videos / DVDs and games software have increased, while the sales of CDs have gone down slightly.
Between 2000 and 2003, the sale of videos and DVDs rose by approximately 13 billion dollars. In 2000, just under 20 billion dollars worth of these items were sold, but in 2003, this figure had risen to a little over 30 billion dollars.
The sales of games software also rose during this period, but less sharply. Sales increased from about 13 billion dollars in 2000 to just under 20 billion dollars three years later. By contrast, during the same time period, the sale of CDs fell from 35 billion dollars in 2000 to about 32.5 billion dollars in 2003.
003
The graphs below show the types of music albums purchased by people in Britain according to s3x and age.
Write a report for a university lecturer describing the information shown below.
You should write at least 150 words.
You should spend about 20 minutes on this task.
The three graphs provide an overview of the types of music people purchase in the UK. At first glance we see that classical music is far less popular than pop or rock music.
While slightly more women than men buy pop music, the rock market is dominated by men with 30% buying rock, compared to 17% of women. From the first graph we see that interest in pop music is steady from age 16 to 44 with 20% of the population continuing to buy pop CDs after the age of 45.
The interest in rock music reaches its peak among the 25 to 34 year olds, though it never sells as well as pop. Interest also drops off after the age of 35 with an even sharper fall from age 45 onwards, a pattern which is the opposite to the classical music graph.
004
You should spend about 20 minutes on this task.
The graphs below show the numbers of male and female workers in 1975 and 1995 in several employment sectors of the republic of Freedonia.
Write a report for a university teacher describing the information shown.
You should write at least 150 words.
The two decades between 1975 and 1995 brought significant changes in the representation of women in Freedonia's work force, according to the graphs.
In 1975, for example, some 300 000 men and 250 000 women worked in the communications sector. Twenty years later, though the number of men remained unchanged, the number of women rose to 550 000.
A similar situation was seen in the wholesale and retail trade sector, where the number of women rose from about 550 000 in 1975 to almost 800 000 two decades later. The number of men in this sector remained stable over the period, at around 700 000.
Women also made gains in both the finance/banking industries and in the defence-related public sector. Whereas some 125 000 women worked in finance and banking institutions in 1975, the number increased to 450 000 by 1995. The number of men grew only marginally from 425 000 to 480 000 over the same period. In defence, the number of men declined from 225 000 to 200 000, while the number of women rose from 25 000 to over 100 000.
Two sectors that retained stable employment numbers for both men and women were manufacturing, which had about 300 000 women and 650 000 men in both surveyed years, and the public sector (non-defence), which employed 650 000 women and 850 000 men.
Thus, women appear to have made gains in the Freedonian work force but not at the expense of men.
You should spend about 20 minutes on this task.
Eating sweet foods produces acid in the mouth, which can cause tooth decay. (High acid levels are measured by low pH values)
Describe the information below and discuss the implications for dental health.
You should write at least 150 words.
Anyone who has visited a dentist has been told that eating excessive amounts of sweets risks harming the teeth. This is because sweets lower pH levels in the mouth to dangerous levels.
When the pH level in the mouth is kept above 5.5, acidity is such that teeth are unlikely to be in danger of decay. Sweet foods, however, cause pH in the mouth to drop for a time, and the longer pH levels remain below 5.5, the greater the opportunity for decay to occur.
By comparing fruit sugar, cane sugar and honey, which are all common ingredients of sweet foods, we find that cane sugar lowers pH levels for the longest period, thus producing the greatest risk of the three. Approximately five minutes aftfter consuming cane sugar, pH levels drop to as little as pH 3.5. They then begin to rise slowly, but do not rise above pH 5.5 until at least 30 minutes have elapsed. By contrast, fruit sugar, which causes the mouth's acidity to fall to just above pH 4, poses a danger for a shorter period: tooth decay is unlikely 20 minutes after consumption. Honey appears an even less risky substance. Though acidity falls to about pH 4.75 within five minutes of consumption, it returns to above pH 5.5 in under fifteen minutes.
The implications, then, are that people who insist on eating sweet foods should be aware of the ingredients, and that fruit sugar or honey appear preferable to cane sugar.
The diagram below shows the typical stages of consumer goods manufacturing, including the process by which information is fed back to earlier stages to enable adjustment.
Write a report for a university lecturer describing the process shown.
You should write at least 150 words.
You should spend about 20 minutes on this task.
Most consumer goods go through a series of stages before they emerge as finished products ready for sale.
Raw materials and manufactured components comprise the initial physical input in the manufacturing process. Once obtained, these are stored for later assembly. But assembly first depends upon the production planning stage, where it is decided how and in what quantities the stored materials will be processed to create sufficient quantities of finished goods. The production planning stage itself follows the requirements of the goods' design stage that proceeds from extensive research. After assembly, the products are inspected and tested to maintain quality control l Those units that pass the inspection and testing stages are then packaged, despatched and offered for sale in retail outlets. The level of sales, which is the end point of the manufacturing process, helps determine production planning.
A product's design is not only the result of product research, but is also influenced by testing and market research. If the testing stage (after assembly and inspection) reveals unacceptable problems in the finished product, then adjustments will have to be made to the product's design. Similarly, market research, which examines the extent and nature of the demand for products, has the role of guiding product design to suit consumer demands which may change with time. Market research, while influenced by product sales, also serves to foster future sales by devising suitable advertising for the goods.
Thus the reality of consumer goods manufacturing goes well beyond a simple linear production process.
007
The table below shows social and economic indicators for four countries in 1994, according to United Nations statistics.
Describe the information shown below in your own words. What implications do the indicators have for the countries?
You should write at least 150 words.
Allow yourself 20 minutes for this task.
A glance at four indicators of economic and social conditions in four countries, Canada, Japan, Peru and Zaire, in 1994 reflects the great differences that exist between wealthier and poorer nations.
The table shows that Japan and Canada had annual incomes of $15 760 and $11 100 per person, respectively. These figures were overwhelmingly greater than the corresponding figures of $160 in Peru and $130 in Zaire.
Health indicators, too, reflected overall levels of affluence in the four nations. Life expectancy at birth, for example, was higher among the more economically developed countries. Japan reported the highest life expectancy, 78. This was followed by Canada, 76; Peru, 51; and Zaire, 47; This suggests that richer societies are able to put more money into health care than poorer ones.
The amount of calories consumed daily per person roughly followed the same ranking. Canadians each consumed some 3 326 calories per day while the Japanese took 2846 calories. The corresponding figures for Peru and Zaire were 1927 and 1749, respectively.
Literacy rates among adults, too, were higher in wealthier countries, no doubt a reflection of ability to invest in education. Canada and Japan both reported literacy rates of 99%, while Peru claimed 68%. Zaire, the least economically developed of the four countries, had a literacy rate of 34%.
The data appear to confirm the often cited link between national wealth and health and education standards.
008
The diagram below shows the average hours of unpaid work per week done by people in different categories. (Unpaid work refers to such activities as childcare in the home, housework and gardening.)
Describe the information presented below, comparing results for men and women in the categories shown. Suggest reasons for what you see.
You should write at least 150 words.
You should spend about 20 minutes on this task.
The diagram reveals that the number of hours per week spent in unpaid work is unequally distributed between men and women.
In households where there are no children, women are reported to work some 30 hours per week in such tasks as housework and gardening. Men's contribution to these unpaid jobs averages a considerably lower 18 hours.
When children enter the household, however, the inequality becomes even more pronounced. In families of 1 - 2 children, men maintain approximately the same number of hours of unpaid work as in childless households, but the number of hours women work in the home rises to 52 per week, much of it, on doubt, due to childcare responsibilities.
Interestingly, when there are three or more children in the household, men are found to work even fewer hours around the house than before the appearance of the third child. Whereas women's unpaid hours rise to approximately 56 per week, the corresponding figure for men, 16, actually represents a decrease.
The data suggest that the increased presence of women in the paid work force has yet to lead to an increased role for men in the home.
009
The chart below shows the amount of leisure time enjoyed by men and women of different employment status.
Write a report for a university lecturer describing the information shown below.
You should write at least 150 words.
Allow yourself 20 minutes for this task.
The chart shows the number of hours of leisure enjoyed by men and women in a typical week in 1998-9, according to gender and employment status.
Among those employed full-time, men on average had fifty hours of leisure, whereas women had approximately thirty-seven hours. There were no figures given for male part-time workers, but female part-timers had forty hours of leisure time, only slightly more than women in
full-time employment, perhaps reflecting their work in the home.
In the unemployed and retired categories, leisure time showed an increase for both sexes, as might have been expected. Here too, men enjoyed more leisure time over eighty hours, compared with seventy hours for women, perhaps once again reflecting the fact that women spend more time working in the home than men.
Lastly, housewives enjoyed approximately fifty-four hours of leisure, on average. There were no figures given for househusbands! Overall, the chart demonstrates that in the categories for which statistics on male leisure time were available, men enjoyed at least ten hours of extra leisure time.
010
Write a report for a university lecturer describing the information in the graph below.
You should write at least 150 words.
Allow yourself 20 minutes for this task.
The graph compares the rate of smoking in men and women in Someland between the years 1960 and 2000. It can be clearly seen that the rate of smoking for both men and women is currently declining and that fewer women have smoked throughout the period.
In 1960, 600 men in every 1,000 was smoking. This number decreased gradually to 500 by 1974 and continued to decrease but more steeply to 250 in 2000. In contrast, the rate of smoking in women in 1960 was very low at only 80 in every 1,000. By 1968 this increased to 170, and increased again but more steeply to 320 in 1977. The rate of female smokers then remained stable at 320 until 1984 at which point the figures began to decline and had dropped to 200 by 2000.
In conclusion we can see that the rate of smoking in men dropped throughout the whole period but was always at a higher level than the female figures. The rate of smoking in women increased until 1977 but then decreased for the rest of the period.
011
Write a report for a university lecturer describing the information in the graphs below.
You should write at least 150 words.
Allow yourself 20 minutes for this task.
The graphs compare the number of deaths caused by six diseases in Someland in 1990 with the amount of research funding allocated to each of those diseases. It can be clearly seen that the amount of research funding in many cases did not correlate with the seriousness of the disease in terms of numbers of deaths.
In 1990 there were around 0.2 million deaths from AIDS, 0.1 million deaths from leprosy, 0.3 million deaths from tropical diseases, 0.5 million deaths from diarrhoea, 0.4 million deaths from malaria and 1.8 million deaths from TB. These figures can be contrasted with the amount of funding allocated for each disease. In 1990 AIDS received 180 million dollars in research funding, leprosy 80 million dollars in research funding, tropical diseases 79 million dollars in research funding, diarrhoea 60 million dollars in research funding, malaria 50 million dollars and TB 20 million dollars in research funding.
In conclusion it is clear that funding allocation for disease research in Someland is not wholly determined by the number of deaths for which each disease is responsible in a given year.
012
Write a report for a university lecturer describing the information in the two graphs below. You should write at least 150 words.
Allow yourself 20 minutes for this task.
The pie charts compare the highest level of education achieved by women in Someland across two years, 1945 and 1995. It can be clearly seen that women received a much higher level of education in Someland in 1995 than they did in 1945.
In 1945 only 30% of women completed their secondary education and 1% went on to a first degree. No women had completed post-graduate studies. This situation had changed radically by 1995. In 1995, 90% of women in Someland had completed secondary education and of those, half had graduated from an initial degree and 20% had gone on to postgraduate studies. At the other end of the scale we can see that by 1995 all girls were completing lower secondary, although 10% ended their schooling at this point. This is in stark contrast with 1945 when only 30% of girls completed primary school, 35% had no schooling at all and 35% only completed the third grade.
In conclusion, we can see that in the 50 years from 1945 to 1995 there have been huge positive developments to the education levels of women in Someland.
013
Write a report for a university lecturer describing the information in the table below.
You should write at least 150 words.
Allow yourself 20 minutes for this task.
The table shows how people in different age groups spend their leisure time in Someland over the course of a year. It can be clearly seen that the amount of leisure time available varies considerably across the age groups and that people of different age levels have very different ways of spending their leisure time.
According to the figures, as people age in Someland their social lives reduce. Teenagers and people in their twenties spend on average 500 hours per year on socialising and 350 hours of that time is with a group of more than 4 people. Although the total hours of socialising in their 30s, 40s, 50s and 60s is fairly constant (between 300-350), socialising with more than 4 people drops dramatically to 50 hours in the 30s and 40s age groups and only 25 from 50 years old. Group and individual exercise follow a similar pattern.
People of all ages spend a good part of their leisure time on entertainment such as TV/video viewing and cinema. In both cases, teenagers and retired people spend around twice as much time as those who are at working age. Home entertainment ranges from just over a thousand hours for teenagers and retired people and an average of 600 hours for everyone else. Cinema accounts for 100 hours o f the teenagers and retired people’s leisure time and 25-50 hours for the rest.
In conclusion we can see there is a significant trend towards solitary and smaller group activities as people grow older and that teenagers and retired people spend a lot more time on entertainment than those of working age do.
014
Write a report describing the information in the graph below.
You should write at least 150 words.
You should spend about 20 minutes on this task.
The chart shows striking differences in the level of computer and Internet penetration in the Arab world.
The UAE and Kuwait are by far the most computerized countries, with Lebanon a distant third. The UAE has over 150 computers for every 1000 inhabitants, compared to Kuwait's 130 and Lebanon's 60. In contrast, countries such as Egypt, Morocco and Syria have less than 20 computers per 1000 inhabitants.
There are also great differences in Internet use and availability. The UAE has by far the highest proportion of users, with more than one-third of its population using the Internet. Kuwait and Lebanon are second and third again, with 100 users per thousand in Kuwait and 80 in Lebanon. In some countries the number using the Internet is negligible: Saudi Arabia has less than 20 users per thousand, and there are fewer than 5 users per thousand in Syria.
One unusual feature of the graph is that Internet use does not seem to be directly related to the number of computers. In several countries (the UAE, Lebanon, Jordan and Oman), there are more Internet users per thousand people than computers. However, in other countries, such as Kuwait, Saudi Arabia and Syria, the number of Internet users is lower than the number of computers.
In summary, there are major differences between computer use and Internet use in the Arab world, but the UAE clearly leads the area in both number of computers and number of internet users per capita.
015
The graph below shows the different modes of transport used to travel to and from work in one European city in 1960, 1980 and 2000.
Write a report for a university lecturer describing the information below.
You should write at least 150 words.
You should spend about 20 minutes on this task.
The graph shows the changing patterns in commuting by train, car, tube or bus for commuters in London in the years 1960, 1980 and 2000.
The number of people using trains at first rose from just under 20% in 1960 to about 26% in 1980, but then fell back to about 23% in 2000.
Use of the tube has been relatively stable, falling from around 27% of commuters in 1960 to 22% in 1980, but climbing back to reach 25% by 2000.
On the other hand, the use of cars increased steadily from just over 5% in 1960 to 23% in 1980, reaching almost 40% by 2000, whereas the popularity of buses has declined since 1960, falling from just under 35% in 1960 to 27% in 1980 and only 15% in 2000.
The graph indicates the growing use of cars for commuting to work between 1960 - 2000, and the corresponding decline in the popularity of buses from being the most popular mode of transport in 1960 to the least popular in 2000.
016
Write a report for a university lecturer describing the information below.
You should write at least 150 words.
You should spend about 20 minutes on this task.
The graphs show health and education spending and changes in life expectancy and infant mortality in the UAE. Overall, as the percentage spent on health and education increases, infant mortality and life expectancy improve.
Graph 1 shows the percentage of GDP spent on health and education between 1985 and 1993. There were big increases in both areas. Health spending stood at about 8% in 1985 but rose to 9% in 1990 and 10% in 1993. Spending on education was even higher. It was 10% in 1985, and shot up to 14% in 1990 and 15% in 1993, a 50% increase in just 8 years.
Graph 2 shows improvements in life expectancy and infant mortality between 1970 and 1992. Life expectancy was just 60 in 1970 but rose to almost 72 in 1992. In contrast, the number of babies dying dropped dramatically, from 60 per 1000 in 1970 to only 22 in 1992.
In conclusion, people in the UAE are living longer and healthier lives because of the government's spending on education and medical facilities.
017
Write a report for a university lecturer describing the information below.
You should write at least 150 words.
You should spend about 20 minutes on this task.
The graph shows weekly expenditure on fast food in Britain by food and income group. There are two main trends. First, the expenditure is directly related to income. Secondly, there are differences in the types of fast food eaten by each group.
The amount of money spent on fast food is related to income. People in the high-income group spent the most - over 85 pence per person per week. People in the low-income group spent the least - less than half of what the high-income earners spent.
The type of fast food eaten also depends on the group. High-income earners spent 3 times more on hamburgers than people in the low-income group. Pizza was generally the least favorite food. Fish and chips was the most popular food with the low-income group but consumption was fairly similar among all groups.
018
Write a report for a university lecturer describing the information below.
You should write at least 150 words.
You should spend about 20 minutes on this task.
雅思大作文范文三十篇
Topic 1: When international media (including movies, fashion shows, advertisements and other TV programs) convey the same messages to the global audience, people argue that the expansion of international media has negative impacts on cultural diversity. What is your opinion? 媒体信息一致的缺点: ?国际媒体(global media)—般掌握在少数几个有实力的机构手中(in the hands of a few, large, powerful organizations);有了媒体的宣传(propaganda)后,西方文化成了主流(domineering force),大规模的、有吸引力的广告(mass seductive advertising )唤起了落后地区人们对物质新的向往(create fresh desires),经济联系增强(strong economic ties),西方产品取代了本地产品,使人们更加向往西方的文化; ?文化开始融合在一起(mingle),人们被新的价值观所围绕(bombarded with new values),对自己的文化失去信心和自豪感(confidence and pride),拒绝接受自己的文化传统(rejection of their cultural heritage)转而接受西方的文化习惯(adoption of Western cultural practices);西方媒体削弱了民族的特征(ethnic identity)和社会的凝聚力(social cohesion);因为担心失去观众(a loss of viewers),当地的电视台也开始播放西方的电视节目(television shows), ?国际媒体的普遍会降低世界文化的品质和多样性(degrade the quality and diversity of world culture);文化被商业化(commercialized), —些文化产品(cultural goods),如音乐、服装,都变成了商品(commodities in the marketplace)。因此,即便一些文化在世界其他地方传播,它原来的性质(authenticity)已经丧失。 媒体信息一致的优点: ?国家之间的频繁交往会促进文化之间的交流。因此,相互了解和相互认同的可能性(likelihood of mutual understanding and mutual acceptance )就会增加,这是顺应全球化的趋势; ?未必一定放弃传统观念(not necessarily lead to the abolition of traditional values),事实上媒体可以起到宣传和稳固传统文化的作用; ?主流媒体一般都会反应文化多元性(The dominant media reflect cultural diversity.); —些外国节目其实促进了文化多元性(Most foreign programming is promoting cultural diversity.),适应了当地的条件(adapt to local conditions),注意到了当地文化的敏感性(aware of cultural sensitivity).自我调节来适应市场(exercise self-censorship to suit the market :)。 As international media companies expand across the world, the growing popularity and uniformity of some media programs (such as TV shows, movies, fashion shows) is causing worldwide concern. Many people have strong views toward this trend. In my opinion, international media is closely linked to cultural globalization and cultural homogeneity. The dominance of international media is a sign of Western cultural imperialism and has the potential to thwart cultural diversity. It is not a secret that international media is owned and operated by a handful of giant corporations, such as Time Warner. They control large sectors of the media market and place national media companies at risk. The contraction in the number of media owners will cause a proportional reduction, in the variety of programs broadcasted. For example, painting, music and movies accessible in the media have a small number of genres, imposing restraints on one's knowledge of artworks of different cultural backgrounds. In addition to seizing control over those creative industries, global entertainment companies affect cultural diversity by reshaping the perceptions, beliefs and norms of ordinary citizens in different countries. Most of the cultural values and ideals promoted by the leading mainstream media are of American origin. American culture values individuality, maximization of one's benefits and material wealth, rather than communal life and family solidarity, the values and norms previously treasured in" many Asian countries. Unfortunately, many Asian people now imitate American people, causing the alteration of their perceptions of family. This radical change can be attributed to those movies and TV programs that portray the success of American individuals or corporations.
雅思写作经典范文 雅思小作文数据描述模板25个
雅思写作经典范文雅思小作文数据描述模板25个 1.the table shows the changes in the number of……over the period from……to…… 该表格描述了在……年之……年间……数量的变化。 2.the bar chart illustrates that…… 该柱状图展示了…… 3.the graph provides some interesting data regarding…… 该图为我们提供了有关……有趣数据。 4.the diagram shows (that)…… 该图向我们展示了…… 5.the pie graph depicts (that)……. 该圆形图揭示了……
6.this is a cure graph which describes the trend of…… 这个曲线图描述了……的趋势。 7.the figures/statistics show (that)…… 数据(字)表明…… 8.the tree diagram reveals how…… 该树型图向我们揭示了如何…… 9.the data/statistics show (that)…… 该数据(字)可以这样理解…… 10.the data/statistics/figures lead us to the conclusion that…… 这些数据资料令我们得出结论……
11.as is shown/demonstrated/exhibited in the diagram/graph/chart/table…… 如图所示…… 12.aording to the chart/figures…… 根据这些表(数字)…… 13.as is shown in the table…… 如表格所示…… 14.as can be seen from the diagram, great changes have taken place in…… 从图中可以看出,……发生了巨大变化。 15.from the table/chart/diagram/figure, we can see clearly that……or it is clear/apparent from the chart that…… 从图表我们可以很清楚(明显)看到……
雅思英语大作文范文100篇
some people claim that the disadvantages of the car are more than t he advantages, do you agree or disagree? 范文1 the birth of cars have made an enormous change to our life.in th e past,we travel from one place to another only by foot,nowaday,car s can do it .its goes withour saying that the invention of cars br ing great benefit to all of us.but as proverb goes:no garden withou t weeds.car is not exception. owing a car has a lot of advantages.for one thing,car provide us th e most convient way of transportation.we can get around freely withou t spenting a lot of time.emotionally,i always found driving is so ex citing.for another,its the comfortable to drive a car.In winter.driver s always can stay warm and dry even in rainy whether,in addition,dri vers are usually safe in their cars when they are out at night. Cars bring the human merits,their side-effects gradually come to th e surface.firstly,to run a car need a lot o f oil,which is gettin g l ess and less.the increasing number of cars contribute the lacking o f energy.secondlly,as more and more cars are used,the traffic ecpeci ally in bi g cities is getting heaver and heavier,whic h lead to th e serious social problem--traffic jam.in addition,the inceasing number s of cars ,which excaust sent a huge quantities of carbon monoxid e into atmosphere.it make the air o f cities unbreathabe,it strip peop le contact with frensh air. therefore, new energy should be explored to replace the oil so tha t our envionmental pollution can be avioded .and the strick law shou ld be issued to keep the numbers of cars under control.thus,our heav ier traffic can be solluted! 范文2 Private cars vs Public traffic As traffic problems become more and more serious in many cities o f developed and developin g countries, their governments have to try h ard and loads of money and energy have been spent to deal with the m. Firstly, it is not efficient for the commuters to use their privat e cars to and back from their workplaces. Occasionally we can see t
雅思写作九分作文范文欣赏
雅思写作九分作文范文欣赏: There is no doubt that helping students find a job is one of the primary functions of university education,but universities do exist for other purposes such as improving students’ analytical skills and raising students’ moral standards. A university education can be seen as a process of improving students’ analytical thinking. The variety of courses offered at university inspires students in various ways,therefore improving their analytical ability. For example,science courses such as math and biology help students develop a rational way of thinking whereas arts courses such as literature may let students ponder over issues from a logical,multi- dimensional perspective; and courses in social sciences force students to recognize the ideas that have been traditionally assumed to be acceptable and unproblematic.
雅思经典图表作文范文
# 43. You should spend about 20 minutes on this task. The table below shows CO2 emissions for different forms of transport in the European Union. The Pie Chart shows the percentage of European Union funds being spent on different forms of transport. You should write at least 150 words.
model answer: The chart shows CO2 emissions per passenger kilometre for variuos methods of transport in the European Union while the pie chart shows European Union spending on transport. Flying by air produces by far the greatest CO2 emissions, approximately three times as much as passenger cars which are the next largest producers. Very little is spent by the EU on air travel while roads make up more than half of the EU transport budget. Trains produce about three times less CO2 emissions per passenger kilometre than passenger cars and eight times less than air travel. Nearly a third of EU transport funds are spent on railways. Ships are a clean form of transport and produce about the same amount of CO2 per passenger kilometre as trains do. However, only 2 percent of EU funds are spent on ports. A further one percent is spent on inland waterways. Coaches are the cleanest form of transport. Emissions of CO2 per passenger kilometre from coaches are half those of buses. Buses emit less than half as much CO2 per passenger kilometre as cars. The European Union spends 10 percent of its transport budget on public transport, such as buses and coaches. (197 words)
雅思写作-小作文范文-柱状图
雅思经典小作文柱状图4篇范文+写作要点分析 C1T3 题目 The chart below shows the amount of money per week spent on fast foods in Britain. The graph shows the trends in consumption of fast foods. Write a report a university lecturer describing the information shown below. The chart shows that high income earners consumed considerably more fast foods than the other income groups, spending more than twice as much on hamburgers (43 pence per person per week) than on fish and chips or pizza (both under 20 pence). Average income earners also favored hamburgers, spending 33 pence per person per week, followed by fish and chips at 24 pence, then pizza at 11 pence. Low income earners appear to spend less than other income groups on fast foods, though fish and chip remains their most popular fast food, followed by
雅思写作范文100篇(完整资料).doc
【最新整理,下载后即可编辑】 范文的思路好了。这样好的东西,可惜不是我整理的,是一个叫landfish姑娘收集的,厉害! v105 Some people claim that the disadvantages of the car are more than the advantages,do you ag ree or disagree? 范文1 The birth of cars has made an enormous change to our life. In the past, we travelled fro m one place to another only by foot, nowadays, cars can do the same job . It goes withou r saying that the invention of cars bring great benefits to all of us. but as an ancient prove rb goes, no garden without weeds. Car is no exception. Owing a car has a lot of advantages. For one thing, car provides us the most convenient wa y of transportation. we can get around freely without spenting a lot of time. Emotionally, I always found driving is so exciting. For another , it is comfortable to drive a car.in winte r.Drivers always can stay warm and dry even in rainy weather .In addition, drivers are saf er in their cars when they are out at night. While cars bring the human a large number of merits ,their side-effects gradually come t o the surface .Firstly, running a car needs a lot of oil,which is getting less and less.The incre asing number of cars contributes the lack of energy.Secondlly,as more and more cars are util zed,the traffic ecpecially in big cities is getting heaver and heavier,which leads to the seriou s traffic jam.Moreover,the inceasing numbers of cars ,which excaust sent a huge quantitie s of carbon monoxide into atmosphere.It makes the air of cities unbreathable, it strips peop le’s contact with fresh air. Therefore, the new energy should be explored to replace the oil so that our envionmental p ollution can be avioded , and the strick law should be issued to keep the numbers of cars un der control. Thus, our heavier traffic can be solved!
英语考试作文-9分雅思图表写作范文全集之地图篇 滨海村庄
英语考试作文 9分雅思图表写作范文全集之地图篇滨海 村庄 9分雅思图表小作文范文全集之地图滨海村庄The map below shows the development of a seaside village between 1995 and present.Write a short report for a university lecturer describing the information shown below.Write at least 150 words. 范文集结:全部9篇9分雅思写作地图范文汇总放送 参考范文: The two maps show the layout of the same seaside village in 1995 and at present. Overall, it is evident that the infrastructure for housing and recreation has increased at the expense of agricultural land and commercial fishing. The most notable changes are the disappearance of the fishing port and adjacent fish market, as well as the creation of a golf course and tennis courts in the north-east, where
farmland and a forest park were still found in 1995. furthermore, a new housing development containing apartments is now found on the waterfront at the former site of the fish market, and a number of restaurants have been built on the opposite side of the road where shops used to be. There was also an increase in the total number of houses, from 12 in 1995 to 16 at present. In addition, the road encircling a small housing development west of the main road has been extended further westward. The hotel and cafe in the south-east have remained as is. A new car park has been added next to the hotel. Total Words: 180 Task Achievement: 9 Coherence & Cohesion: 9 Lexical resources: 9 Grammar: 9 Overall Score: Band 9
雅思10范文急求雅思范文10篇
雅思10范文急求雅思范文10篇 无忧雅思网论坛: 这是他主页: 3g雅思网: 上面都有范文!希望对你有帮助! 首先分析这种现象的利与弊 advantages:pany 会进一步推进科学研究的发展,由于公司大多数会投资有生产或者市场价值的研究,这样就弥补了政府在这方面投入的不足。而且商业性研究会带来利益,进而带来一系列好处。。。 disadvantages: 也许会导致科研商业化,吸引研究者更多的从事商业研究而忽略基础研究,造成基础研究薄弱,科学技术研究水平发展不平衡。 然后,假设你认同利大于弊,进一步阐述你的理由,强化利大于弊的观点。
假如你不认同,同上。 最后别忘了作总结,再次重申你的观点 Training Experience in Shanghai chmin 发表于 xx-3-28 8:29:00 Last week I went to Shanghai for the taining classes held by Altair, a famous engineering software pany.I can't remember the exactly times that I have been to Shanghai, but this time, i'd like to say, is very memorable. Not because I excursed some splendid artifical sights nor I was taken to some characteristic restaurants, just only since the afflictive time in autobus every morning. Life in school is quite fortable. If there's no class in the morning, I just need to wake up naturally, and inordinate some time, the moment i opened my eyes, it's alreay 12 o'clock. Incredible, I got up before 7 o'clock the whole last week, and spent more than one and half an
雅思写作八分经典范文背诵
第一篇 The chart below shows the amount of money per week spent on fast foods in Britain. The graph sho ws the trends in consumption of fast foods. Write a report for a university lecturer describing the information shown below. 柱状图显示的是1970-1990二十年间英国人每周在快餐上花费了多少钱;曲线图展示的是这二十年间快餐消费的趋势。 The bar chart shows how much money was spent on fast foods per week in the UK over a span of 2 0 years from 1970 to 1990 while the graph reveals the trend of fast food consumption over the same period of time. 从柱状图看,各收入阶层在汉堡和鱼煎薯条这两种快餐上的支出相对高于在皮萨上的消费;曲线图反映出汉堡与皮萨的消费呈现上升趋势,鱼煎薯条则呈现出波动趋势。 As we can see from the chart, the weekly expenses of people of different income levels on hamburg ers and fish and chips were relatively higher than that on pizza. The graph indicates that while hamb urger and pizza consumption both revealed a general trend of increase, fish and chips showed a tren d of fluctuation. 首先,高收入阶层和中等收入阶层每周在汉堡上的平均消费分别是每人42便士和33便士,比低收入阶层的14便士搞出了很多。在鱼煎薯条方面,高收入阶层的支出略低,是17便士,但中等及低收入阶层的支出都分别达到了25便士和18便士,相对于在皮萨方面支出
2017雅思写作范文
为方便大家的雅思备考,北外网课第一时间准备了2017年2月25日雅思写作真题范文,由雅思教师撰写:探索太空OR关注地球,帮助雅思备考者分析写作思路,掌握写作技能。跟随北外网课长期学习能够有效提高写作水平,更多雅思备考信息和学习资料,外语在线学习平台北外网课实时为大家更新。欢迎关注。
Some people think the government should spend money to look for life on other planets, others think it is a waste of public money when the earth has so many unsolved problems. Discuss these both sides and give your own opinion 探索太空属于科技类话题,同学们写作的难点主要在于相关词汇可能积累较少,北外网课给出了一些关键词,一起看一下。 KEY WORD look for life on other planets : look for aliens search for extraterrestrial intelligence exploring outer space / space exploration invest in space agencies and programs prioritize spending on the exploration of space Intro. P.(导入) Space exploration is costly, and many people argue that it should be halted since the gains from searching for extraterrestrial intelligence has few immediate benefits, and we should care for our own planet more. However, others support the outer space programmes for the sake of future tremendous gains and human nature.
雅思写作九分作文欣赏
雅思写作九分作文范文欣赏:There is no doubt that helping students find a job is one of the primary functions of university education, but universities do exist for other purposes such as improving students’ analytical skills and raising students’moral standards. A university education can be seen as a process of improving students’analytical thinking. The variety of courses offered at university inspires students in various ways, therefore improving their analytical ability. For example, science courses such as math and biology help students develop a rational way of thinking whereas arts courses such as literature 123ve to let students ponder over issues from a logical, multi- dimensional perspective; and courses in social sciences force students to recognize the ideas that have been traditionally assumed to be acceptable and unproblematic. With the development of these types of analytical thinking,graduates can face future challenges with more confidence and enthusiasm. Also, university education is expected to improve students’ moral standards. This is rooted in universities’ belief that students’ awar123ss of responsibility towards their community and their country is of high importance. In this ever-deg123rating society and civilization, students are encouraged actively participate in improving the local community. A university that provides care and facilities for physically disadvantaged students may inspire the graduates to better handle situations in the future where they may have to interact with the disabled community. A successful university education is supposed to produce morally sound graduates, therefore increasing their employability. In conclusion, university education not only helps students locate a decent job but will also develop other qualities such as enhancing their analytical skills and cultivating their hunger and spirit for life. Some people warn that the era of the silver screen is coming to an end and that people will eventually lose interest in going to the cinema. Do you agree or disagree with this view (250 words)
雅思写作Task1曲线图考官范文(1)
雅思写作Task1曲线图考官范文(1) 这是一篇雅思写作Task1曲线图考官范文。认真研读一定的雅思范文及作文模板可以帮助我们检验自己的写作水平,并能很好地吸收和应用优秀范文里的优秀内容。 The graphs below show the numbers of male and female workers in 1975 and 1995 in several employment sectors of the republic of Freedonia. Write a report for a university teacher describing the information shown.
Sample Answer: The provided line graphs compare the employment history of men and women in 1975 and 1995 dividing in six major sectors namely: manufacturing, communications, finance/ banking, wholesale & retail trade, non-defence public sectors and defence public sectors. As is observed from the given illustration, significant changes have been made in women's employment and women appear to have made remarkable improvements in almost the entire job sectors in Freedonia and in some sectors women went well ahead of men. Initially in 1975, men were notably ahead of women in every sector of employment. For example, in communication sector about 260 men worked against 220 women in every thousand employees. Twenty years later, though the number of men remained unchanged, the number of women rose to over 550 in one thousand. A similar trend can be seen in the wholesale and retail trade sector, where the number of women rose from about 550 to almost 800 in every 1000 employees of this sector two decades later. The number of men in this sector remained stable over the period, at around 700 / thousand.