手机SAR相关内容
手机天线研发流程及SAR测试介绍

手机天线研发流程及SAR测试介绍手机天线研发流程及SAR测试介绍手机天线是手机中的一个重要组成部分,它负责接收和发送无线信号。
手机天线的设计对于手机性能的稳定性和信号质量有着重要影响。
本文将介绍手机天线的研发流程以及SAR测试,帮助读者了解手机天线的研究与开发过程。
手机天线的研发流程通常包括以下几个关键步骤:1. 需求分析和规划:在研发手机天线之前,首先需要进行需求分析和规划。
研发团队需要确定手机天线的技术要求和性能指标,例如频段范围、天线增益等。
2. 天线设计:天线设计是手机天线研发的核心步骤。
根据需求分析结果,设计团队会采用不同的设计方法和技术来设计手机天线。
例如,常见的手机天线设计包括片上天线、贴片天线和埋入式天线等。
3. 原型制作和测试:在完成天线设计后,研发团队会制作原型并进行测试。
通过天线参数测试仪器,如网络分析仪和天线测试舱等,对手机天线进行性能测试,如驻波比、辐射效率和频率响应等。
4. 优化和迭代:根据原型测试结果,研发团队会对手机天线进行优化和迭代。
通过调整天线结构、材料和放置位置等参数,以提高天线性能和适配不同的手机尺寸和外观要求。
5. SAR测试:完成手机天线设计后,需要进行SAR(Specific Absorption Rate)测试。
SAR是一种用来衡量人体对无线电频率电磁场的吸收能力的指标,常用于评估手机对人体的辐射影响。
在SAR测试中,使用模型人体来模拟真实使用情况下人体对手机辐射的吸收程度。
SAR测试是手机天线研发的最后一步,其目的是确保手机天线在正常使用时对人体的辐射量在安全范围内。
在SAR测试中,测试人员会按照标准流程将手机放置于模型人体头部位置,并通过测量无线电频率电磁场的吸收量来计算SAR值。
根据SAR测试结果,如果SAR值高于安全标准,需要对手机天线进行再次优化或调整。
这个过程需要多次迭代,直到SAR值符合相关法规和标准。
综上所述,手机天线的研发流程涵盖了需求分析和规划、天线设计、原型制作和测试、优化和迭代以及SAR测试等多个步骤。
手机sar辐射值2018

1.SAR值是什么呢 ?SAR值(电磁波能量比吸收率, Specific Absorption Rate),是国际手机电磁波辐射量,代表生物体(包括人体)每单位公斤在单位时间内所吸收的功率,以W/kg为单位。
SAR值越低,辐射被吸收的量越少。
台湾NCC规范的手机SAR标准值系采中华民国国家标准(CNS 14959)于时变电场、磁场及电磁场曝露之限制值(即300GHz以下),SAR值最大不得超过2.0 W/kg与欧洲标准一样,美国的SAR标准则以1.6W/kg为标准,德国则将SAR值小于0.6 W/Kg则可以张贴「蓝天使标章」。
2.台湾市售的手机谁的SAR值最高? 谁的较低呢?台湾市售的手机都是通过NCC的检测,SAR值全部小于2.0 W/kg,安全无虞。
不过,因各品牌手机主力市场不同加上设计不同,电磁波辐射值大小差距颇大。
经抽查台湾八月份最热销的20款手机及30款热门新机,其中有34款低于0.6 W/Kg,属于电磁波辐射较小的「蓝天使标章」。
A.SAR值最低TOP 20:抽查的手机中,SAR值最低的手机前三名由HTC U Ultra (0.07 W/kg)、HTC U Play(0.12 W/kg)及Asus Zenfone 3(0.127 W/kg)。
SAR值较低的品牌大都集中在国产双雄(HTC/Asus) 、韩系(Samsung / LG)。
2. SAR值最高TOP 20:抽查的手机中,SAR值最高的手机前五名由OPPO占了四个,亚军则有小A1夺下。
整体而言,OPPO 与Apple iPhone的SAR都偏高,但仍安全无虞,不必杞人忧天。
但若对于电磁波较为敏感的人除了少外,建议可以多利用携带式免持听筒或蓝牙耳机,减少通话时电磁波对脑部的影响。
以下是50款挑选手机的SAR值清单:3.SAR值高收讯会比较好吗? 对人体影响比较大吗?SAR值高低通常与手机的天线设计有关,手机发射功能通常与SAR值成正比,当手机的发射功率每降低1dB,SAR 数值大约会降低0.3W/Kg。
SAR测试方法介绍
SAR测试方法介绍SAR (Specific Absorption Rate) 是用来评估无线通信设备辐射对人体的潜在影响的一种测量方法。
它表示人体吸收无线电频率电磁场能量的速率。
SAR测试方法旨在确保无线设备在正常操作的情况下,对人体产生的电磁辐射水平在国际安全限值内。
1.选择合适的人体模型:选择与真实人体相似度高的人体模型是非常重要的。
目前,通常使用的人体模型可以根据不同的使用环境进行分类,例如头部、身体等。
2.测量设备设置:将要被测试的无线设备按照特定的要求设置在人体模型附近。
测试中需要确保设备正常工作,并且模拟真实使用环境。
3.辐射测量:使用合适的测量系统来测量人体模型吸收的电磁辐射水平。
通常使用具有高灵敏度的电磁传感器和仪器来获取准确的测量结果。
4.计算和分析:通过测量数据计算出SAR值。
SAR值可以通过计算在特定体积单位内吸收的电磁能量量化为特定的数值。
然后,将这些测量结果与国际安全限值进行比较,以确定设备是否符合要求。
1.安全性保障:通过SAR测试,可以确保无线设备的电磁辐射水平在国际安全限值内,从而保障用户的健康安全。
2.可靠性和准确性:SAR测试方法使用科学严谨的测量和计算方法,能够提供准确可靠的结果。
3.标准一致性:SAR测试方法已成为国际标准的一部分,得到了业界的广泛认可,并得到了各国监管机构的支持。
值得注意的是,SAR测试方法目前主要应用于无线通信设备的评估,如手机、无线路由器等。
但它并不适用于其他设备,如微波炉、雷达等,因为这些设备的辐射特性和人体暴露方式不同,需要使用其他测量方法来评估其安全性。
总结起来,SAR测试方法是评估无线设备辐射对人体的一种重要方法。
它通过使用人体模型来测量无线设备产生的电磁辐射对人体组织的能量吸收情况,并计算出SAR值。
这种方法可靠准确,能够确保无线设备在国际安全限值内,从而保障用户的健康安全。
SAR手机辐射_图文.
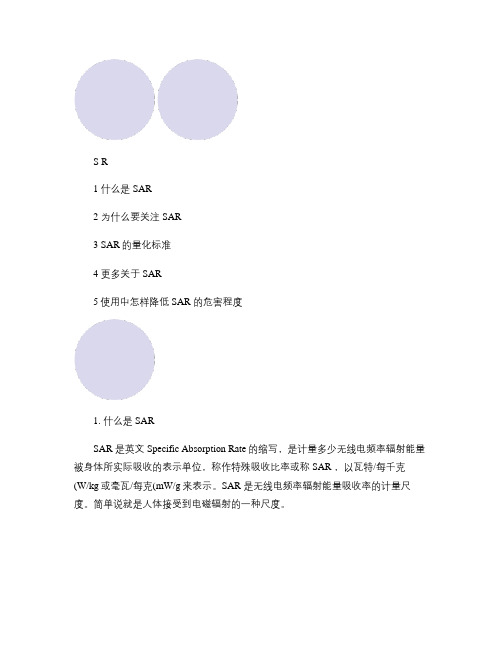
S R1 什么是SAR2 为什么要关注SAR3 SAR的量化标准4 更多关于SAR5使用中怎样降低SAR 的危害程度1. 什么是SARSAR 是英文Specific Absorption Rate的缩写,是计量多少无线电频率辐射能量被身体所实际吸收的表示单位,称作特殊吸收比率或称SAR ,以瓦特/每千克(W/kg或毫瓦/每克(mW/g来表示。
SAR 是无线电频率辐射能量吸收率的计量尺度。
简单说就是人体接受到电磁辐射的一种尺度。
在外电磁场的作用下,人体内将产生感应电磁场。
由于人体各种器官均为有耗介质,因此体内电磁场将会产生电流,导致吸收和耗散电磁能量。
生物剂量学中常用SAR 来表征这一物理过程。
SAR 的意义为单位质量的人体组织所吸收或消耗的电磁功率,单位为W/kg。
SAR 的物理公式给定物质密度(ρ)下的一体积单元(dV )中单位物质(dm )吸收(耗损)的单位电磁能量(dW )相对于时间的导数。
其中:E 为细胞组织中的电场强度有效值,以V/m表示;σ为人体组织的电导率,以S/m表示;ρ为人体组织密度,以kg/m3表示;2. 为什么要关注SAR当人们使用手机时,手机会向发射基站传送无线电波,而任何一种无线电波或多或少地会被人体吸收,从而改变人体组织,有可能对人体的健康带来影响, 这些电波就被称为手机辐射。
显然,SAR 会对我们的健康构成威胁。
虽然目前手机对人体健康到底有什么危害,目前全球科技界对此尚无定论,任何一家跟踪研究手机辐射问题的机构(包括世界卫生组织),也还都没有证据能够证明手机和移动基站会对健康造成威胁。
那是因为手机世界范围类普及也不过十五年。
而很多可以肯定的结论是SAR 对人体的危害是长期而潜在的。
在地球上各式各样的电磁波充满人类生活空间,无线电广播、电视、移动通讯、无线电遥控、导航、高压送配电线等均向空中和地面辐射强大的电磁波能量。
电子产品或设备在空间形成的许多电磁波不仅相互干扰,使它们的功能异常,而且当达到一定强度时,在无形中对人产生伤害。
SAR基本知识简1

SAR基本知识简介1.什么是SARSAR是英文Specific Absorption Rate的缩写,是计量多少无线电频率辐射能量被身体所实际吸收的表示单位,称作特殊吸收比率或称SAR,以瓦特/每千克(W/kg)或毫瓦/每克(mW/g)来表示。
SAR是无线电频率辐射能量吸收率的计量尺度。
SAR的准确定义是:给定物质密度(ρ)下的一体积单元(dV)中单位物质(dm)吸收(耗损)的单位电磁能量(dW)相对于时间的导数,以下式表示:SAR=d/dt(dw/dm)=d/dt(dw/ρdv)其中:Ei为细胞组织中的电场强度有效值,以V/m表示;σ为人体组织的电导率,以S/m表示;ρ为人体组织密度,以kg/m3表示;Ci为人体组织的热容量,以J/kg表示,为组织细胞的起始温度时间导数,以K /s表示2.SAR是如何产生的?当前国际上所谈到的SAR,都是针对蜂窝式移动电话(俗称手机)所产生的辐射。
因为携带方便,手机发展的相当快和相当普及。
手机是双向无线电设备。
当你使用手机通话时,它便拾取你的语音并转化为无线电频率或无线电波。
无线电波通过空中传递到附近的某个基站的接收器上。
然后,基站再通过电话网络将你的电话呼叫发送至你要呼叫的人。
通信的方式如下图:手机通话时是依靠发射一定功率的无线电波(RF),它不同于伽马射线、X射线和光谱等类型的电磁能量,是以电磁辐射形式组成的电磁能量,由空间中的电与磁的能量相互运动共同组成,在该范围的波称其为电磁场。
无线电辐射(RF)能量的用途广泛,电信、无线电收音机、电视广播、无线电话、寻呼机、非接触卡电话、警察和消防部门的无线电工具)、点对点联络和卫星通讯均依赖于无线电频率辐射(RF)能量。
另外的用途还包括微波炉、雷达、工业加热器、熨斗、医疗设施等。
微波频率段的无线电(RF)能量能够热水,能够快速烹调含水量大的食品;雷达依赖于无线电(RF)跟踪汽车和飞机,并用于军事用途;工业炉和熨斗使用无线电(RF)能量加工成形可塑材料、胶木制品、密封皮革如鞋和皮夹、加工食品;无线电(RF)能量的医疗用途包括起搏器的监控和操作。
SAR

SAR
S A R即英语“S p e c i f i c A b s o r p t i o n R a t e”的缩写,意为电磁波吸收比值或比吸收率。
是手机或无线产品之电磁波能量吸收比值,其定义为:在外电磁场的作用下,人体内将产生感应电磁场。
由于人体各种器官均为有耗介质,因此体内电磁场将会产生电流,导致吸收和耗散电磁能量。
生物剂量学中常用S A R 来表征这一物理过程。
S A R的意义为单位质量的人体组织所吸收或消耗的电磁功率,单位为W/k g。
S A R值一般指手机产品中电磁波所产生的热能,它是对人体产生影响的衡量数据,单位是W/K g(瓦/公斤)。
目前
美国联邦传播委员会(F C C)所公布行动电话的安全标准值为1.6,因此只要行动电话的S A R值在 1.6以下,都是在安全标准内的产品。
S A R值表示行动电话的热能会对人体会造成多少影响,数值越大,表示对人体的影响越大;反之则影响较小。
关于手机对人体的辐射S A R(S p e c i f i c A b s o r p t i o n R a t e,电磁波能量吸收比),美国和欧洲已经有了规定,美国标准为 1.6 W/k g(1克),欧洲标准为 2.0W/k g(10克)
国际科学界用“S A R”值来对手机辐射进行量化和测量。
对于测量手机产品的“S A R”,通俗地讲,就是测量手机辐射对人体的影响是否符合标准。
目前国际通用的标准为:以6
分钟计时,每公斤脑组织吸收的电磁辐射能量不得超过2瓦。
这一标准作为国际业界的通用标准。
SAR数据介绍范文

SAR数据介绍范文SAR数据(合成孔径雷达数据)是一种通过合成孔径雷达(Synthetic Aperture Radar,SAR)技术获取的雷达数据。
SAR是一种主动遥感技术,与被动遥感技术相比具有独特的优势。
由于它不受天气、云层和光照条件的限制,SAR数据可以在任何天气条件下进行观测和收集。
SAR数据是通过在雷达系统上安装一个发射器和一个接收器来获得的。
发射器向地面发送雷达波束,然后接收器接收回波,并将其转换为数字信号。
SAR系统通过计算回波信号的相位差来确定目标地面的位置。
然后,计算机将这些数据处理成图像。
这个过程是通过接收器的移动和时间集成来实现的。
由于接收器的移动,可以模拟一个巨大的接收器,从而获得高分辨率的图像。
SAR数据具有很多独特的特点,使其在地球观测和远程传感器应用中非常有用。
首先,SAR数据具有很高的分辨率,能够捕捉地表上的细微细节。
其次,SAR数据具有观察面的宽度,可以在一次观测中覆盖大面积的地区。
这对于大规模的环境监测和灾害评估非常有用。
此外,SAR数据有能力穿透云层和观测地下目标,这使其在环境和地质应用中具有重要的意义。
SAR数据对于各种应用非常有用。
在环境监测方面,SAR数据可以用来监测土地覆盖和使用变化、土地沉降、水体变化等。
此外,SAR数据还被广泛应用于冰川动态监测、森林和湿地生态系统监测等方面。
在城市规划和土地管理方面,SAR数据可以提供高分辨率的地表信息,用于土地利用规划、建筑物高程测量等。
在灾害管理和响应方面,SAR数据可以用来监测地震、洪水、台风等自然灾害,并提供快速和准确的灾害评估。
随着技术的不断发展,SAR数据的使用越来越广泛。
目前,SAR数据已经应用于许多领域,如军事侦察、海洋监测、农业监测等。
此外,SAR 数据还与其他遥感数据(如光学影像)相结合,以提供更全面和准确的地球观测数据。
虽然SAR数据具有许多优点,但也存在一些挑战和限制。
首先,SAR 数据的获取和处理需要复杂的雷达系统和专业的处理软件。
sar的介绍和测

SAR原理
SAR是通过测量人体组织在电磁场中的功率吸收 01 而得出的。
电磁场中的电场和磁场分量都会在人体中产生电 02 流,从而引起能量吸收。
SAR的计算需要考虑电磁波的频率、电场强度、 03 磁场强度、人体组织的电导率和介电常数等因素。
SAR的单位
平板电脑SAR测量实例
01
测量目的
评估平板电脑电磁辐射对人体健 康的影响,确保平板电脑在安全 范围内使用。
测量方法
02
03
测量结果
使用SAR测试设备对平板电脑进 行测量,获取SAR值。
根据测量结果,判断平板电脑是 否符合安全标准,并给出使用建 议。
THANKS
感谢观看
手机SAR测量软件
随着智能手机的普及,一些手机应用程序也应运而生,可以用来测量SAR值。这 些手机应用程序通常基于智能手机内置的传感器和功能,通过算法和计算模型来 估算SAR值。
手机SAR测量软件具有方便、快捷、易于使用的特点,但需要注意的是,由于受 到手机硬件和算法等因素的影响,测量结果的准确性和可靠性可能不如专用设备 。
04
SAR安全标准与法规
国际SAR安全标准
01 国际电信联盟(ITU)
ITU制定了关于SAR值的国际标准,要求SAR值不 超过2.0 W/kg(10g平均质量)。
02 美国联邦通信委员会(FCC)
FCC规定所有在美国销售的手机必须符合SAR限 制,要求最大SAR值为1.6 W/kg(1g平均质量)。
SAR的介绍和测量
目录
• SAR定义与原理 • SAR测量方法 • SAR测量设备 • SAR安全标准与法规 • SAR测量实例
- 1、下载文档前请自行甄别文档内容的完整性,平台不提供额外的编辑、内容补充、找答案等附加服务。
- 2、"仅部分预览"的文档,不可在线预览部分如存在完整性等问题,可反馈申请退款(可完整预览的文档不适用该条件!)。
- 3、如文档侵犯您的权益,请联系客服反馈,我们会尽快为您处理(人工客服工作时间:9:00-18:30)。
SAR Calculation of a dual band helical antenna mounted in a mobile handsetusing a SAM homogeneous phantomIntroductionThe objective of this application note is to show how Microstripes Version 6.0 is used to evaluate the performance of a generic dual band helix antenna designed to operate in the GSM band when mounted inside a typical handset enclosure. The key parameters of interest are1.Influence of the handset enclosure on the antenna performance2.Influence of the presence of the head phantom on the antennaradiation pattern performance3.Evaluation of the 1g and 10 g SAR performance of the handset whenoperating in the GSM band. (Upcoming functionality Part of Microstripes 6.1 Release)The SAR modelling is performed in such a way as to recreate the measurements used during SAR qualifications of mobile handsets.The standard procedures are as described in CENELEC EN50360, IEC 62 209 and IEEE SCC34,SC2 WG1, document Std P1528-200 X " Recommended practice for determining the spatial-peak specific absorption rate (SAR) in the human body due to wireless communications devices: Experimental techniques".PART 1. Evaluation of the antenna performance when mounted inside a handset enclosureIt is often the case these days that a complete solid model of a piece of hardware exists within the manufacturer's organisation owing to the ubiquitous use of CAD tools. The different departments will use these models as digital prototypes to perform simulations in order to check and confirm the performance of the finished product against the design specification.In our example, the different constituent parts of a typical mobile handset such as the phone enclosure, the PCB and the antenna were available and were easily imported into the geometry modeller BUILD software tool as 3 D solid models. The BUILD module supports the import and export of the following native CAD file formats SAT, IGES, STEP, STL and DXF. Figure 1, shows a typical solid model of a handset enclosure imported into BUILD from several IGES files representing each component part.Figure 1: A typical handset model as imported into Build(Note that this is not the handset antenna being analyzed in thisdocument)Since these models have a multi-purpose use and are primarily a true representation of the final product. It is often judicious to exploit the features of each analysis tool and construct a model that will give you a faithful engineering answer in the shortest amount of time.In this study we are concerned with a handset equipped with a dual band helical antenna and the following model simplification are used to fully exploit some of the most powerful features of Micro-Stripes.e of the wire compact model to represent the helical antenna2.Representation of the enclosure by a "sheeted " box combined withthe use the thin film compact modelThe antenna itself was constructed using the "Laws" function in BUILD which allows an analytic formula to represent the helical geometry of the antenna; Two pitches are used to represent the dual band nature of the antenna which is designed to operate in the 900 and 1800 MHZ frequency band.Figure 2: Mounting configuration of the dual band helical antennaon the phone PCB.Inset a zoomed view of the antenna and its representation as acompact wire.From Figure 1, it is obvious that to recreate a detailed discretized model of the enclosure a fine mesh will be necessary to give a faithful spatial representation. The enclosure is simplified and represented by a box, which has been operated upon with the "Sheet" tool. The "Sheet" operation preserves the sides of the box and allocates to them a value of zero thickness. During the material assignment process, the enclosure is given the properties of a "thin film", whose dielectric permittivity corresponds to ABS plastic (DK=3.0) in this case and a physical thickness of 2 mm. This simplified model of the enclosure is sufficient to preserve the influence of the enclosure on the antenna and still yield an efficient EM model capable of delivering very good EM results.Figure 3: Simplified enclosure model for the handsetThe influence of the enclosure on the antenna return loss performance is shown in Figure 4.Figure 4: Return loss performance of the dual band helicalantenna(Black: Free Space), (Red : Embedded within the handset enclosure)The presence of the enclosure has shifted the frequency down for both the low and high band. The antenna used in this example was tuned to give its optimum performance when mounted within the enclosure.It is also worth noting that the presence of the head and the hand will also have an influence on the return loss performance of the antenna and will cause the resonant frequency to shift.PART 2. Influence of the presence of the head phantom on the antenna radiation pattern performanceTo evaluate the influence of the presence of a human head on the antenna performance, the antenna model enclosed in the handset was brought close to a Specific Anthropomorphic homogeneous phantom (SAM) at location (x=0,y=0 and z=0). This reference point is chosen to indicate the location of the user's ear; the head was also tilted backwards by 300 to ensure that the line joining the ear to the mouth is coincident with the X-axis.Figure 5: Handset positioned in its operational attitude withrespect to the head phantomIn this analysis, the head was assigned the dielectric properties of the "Brain (White Matter)" extracted from the "tissues.sat" database, which is delivered as part of the software. The file "tissues.sat" contains a 4 poles Debye representation of most human tissues which describes the variation of the dielectric properties of tissue material with frequency. Figure 6 shows the standard 4 pole Debye representation for Brain (White matter)Figure 6: 4 Pole Debye representation of the "Brain (WhiteMatter)"Tissue as extracted from "Tissues.SAT" database fileTo check the permittivity values used in the model are as expected, it is advisable to plot the ".prop" file, which is generated by the solver at run time and holds the variation of the electrical properties of the dielectric materials used in the model with frequency. Figure 7, shows the variation of permittivity with frequency for Brain tissue.Figure 7: Permittivity versus frequency plot for Brain tissue asextracted from .prop fileFrom the plot, a value for the relative permittivity of 44 can be read for a frequency of 1.8 GHz as expected and corresponds to the value of permittivity that a liquid simulant used during SAR measurements would have.Figure 8Figure 8, Shows the influence of the presence of the head on the radiation pattern performance of the antenna at 900 MHz (Cut at 00 from theE-plane). (Red: No head present, Black: With head)1g and 10 g SAR evaluation (Microstripes V6.1 Beta)The head phantom was finely meshed to give Voxels of 8 mm3, corresponding to a sampling mesh of 2mm along each Cartesian axis. The quantitative SAR output can be accessed through a drop down menu form within "Field plotter". The point SAR, 1 g and 10g values can be chosen and by setting the scale to linear scale the peak value can be read off directly from this dialogue in the data range boxes. This value is also displayed on the color bar at the bottom of the SAR intensity plot.Figure 9, shows a sample dialogue window and where the Peak SAR value is displayed.Figure 9: SAR dialogue selection menu within Field plotter Figure 10: shows the 10 g SAR distribution at 1.8 GHz for the dual band antenna.Figure 10: 10 g SAR distribution, a spatial peak value of 0.0031W/Kgis read from the color scale.Figure 11: 2 dimensional 1g SAR distribution selected in Fieldplotter,The peak value of 0.0049 W/Kg can be read off the colour scalebarIt is important to note that in order to calibrate the SAR values, the delivered power to the antenna should be known and quantified. This is the value of power delivered at the output of the antenna and includes for the reflected power due to the antenna mismatch. The delivered power into the system is accessed through the (.io) file and is tagged as "Power IN". A plot of this quantity is shown in Figure 12, the values of power IN at 900 and 1800 MHz can easily be read off this graph.Figure 12: A plot of power in versus frequencyTable 1: Summarizes the SAR performance of this antenna handset combination at 900 MHz and 1800 MHz as follows.It is now important to calibrate these values of SAR to those that would be measured during tests. A typical handset would have a delivered power of 23 dBm at 900 MHz and 21 dBm at 1800 MHz to meet its operational link budget. Assuming these values for delivered power Table 1, can bere-written to correspond to the values that would be measured during SAR compliance tests and is shown belowWe can see that the simulations show that this phone will be compliant to the SAR specification limits. However the simulated values for SAR are too close to the limits and a better margin would be preferable to ensure compliance during tests.。