Inhomogeneous deformation and residual stress in
多尺度铝合金微观组织演变模型研究进展
多尺度铝合金变形组织演变建模研究进展1王冠1,2,卞东伟1,寇琳媛1,易杰2,刘志文2,李落星2(1.宁夏大学机械工程学院,银川750021;2.湖南大学,汽车车身先进设计制造国家重点实验室,长沙410082;)摘要:铝合金在热成型过程中,微观组织会发生晶粒长大、晶粒不均匀变形、动态再结晶等一系列复杂的演化,而这些材料内部微观结构的改变,会直接影响到铝合金的综合性能。
通过掌握变形过程中微观组织演变的物理本质,来达到控制微观组织及产品性能的目的,已经越来越受到材料研究者的重视。
本文综述了铝合金变形组织演变建模的研究现状,重点介绍了多尺度模拟方法,同时指出了研究中存在的问题,展望了铝合金变形组织演变建模的发展趋势。
关键词:铝合金;微观组织演变;多尺度建模;热压缩变形;Research Progress in Multi-scale modelling of microstructure evolution during hot deformation ofaluminum alloyWANG Guan1,2, BIAN Dong-wei1, KOU Lin-yuan1, YI Jie2, LIU Zhi-wen2, LI Luo-xing2(1.College of Mechanical Engineering, Ningxia University, Yinchuan 750021, China;2.State Key Laboratory of Advanced Design and Manufacture for Vehicle body, Hunan University,Changsha 410082;)Abstract:During the hot forming process of aluminum alloy, microstructure will occur in a series of complex evolution such as grain growth, inhomogeneous deformation, dynamic recrystallization and which will directly affect the comprehensive properties of aluminum alloy. By mastering the physical essence of the microstructure evolution during heat deformation, to achieve the purpose of controlling the microstructure and the properties of the products has been paid more and more attention by the researchers of materials. This paper summarizes the research status quo of modelling of microstructure evolution during hot deformation of aluminum alloy, especially for the multi-scale simulation method, and points out the problems existing in current research and forecast the development trend of modelling of microstructure evolution during hot deformation of aluminum alloy.Key words: Aluminum alloy; Microstructure evolution; Multi-scale modelling; Hot compression deformation;铝合金具有密度低、比强度高、耐腐蚀性好、可循环利用等优点,被公认为汽车轻量化的理想材料。
材料成型及控制工程专业英语

材料成型及控制工程专业英语Mechanical property机械性能austenitic奥氏体的martensite 马氏体Plastic deformation塑性变形stress concentrator应力集中点bar棒材beam线材sheet板材ductile可延展的stress relief应力松弛austenitie奥氏体 martensite马氏体normalize正火temper回火anneal正火harden淬火close-die forging模锻deformation rate变形速度diffusion扩散overheat过热Work hardening加工硬化dislocation density位错密度die模具residual strain残留应变as-forged锻造的injection mold注射模molding shop成型车间clamping force合模力grind磨削drop stamping锤上模锻nickel-base superalloy镍基合金insulation 隔热burr毛刺injection capacity注射容量deterioration变化、退化discrete不连续的abrasive磨损welding焊接metallurgical 冶金的Formation of austenite奥氏体转变The transformation of pearlite(珠光体)into austenite can only take place at the equilibrium critical point(临界温度)a very slow heating as follows from the Fe-C constitutional diagram(状态图). under common conditions, the transformation is retarded and results in overheating,i.e.occurs at temperatures slightly higher than those indicated in the Fe-C diagram.The end of the transformation iS characterized by the formation of austenite and the dis—appearance of pearlite(ferrite+cementite).This austenite is however inhomogeneous even in the volume of a single grain.In places earlier occupied by lamellae(层片)(or grains)of a pearlitic cementite,the content of carbon is greater than in places of ferritic lamellae.This is why the austenite just formed is inhomogeneous.In order to obtain homogeneous (均匀的)austenite,it is essential on heating not only to pass through the point of the end of pearlite to austenite transformation,but also to overheat the steel above that point and to allow a holding time to complete the diffusion(扩散) processes in aus-tenitie grains.为了获得均匀的奥氏体,在加热过程中通过珠光体的结束点向奥氏体转变是必要的,而且对过热刚以上的点,允许持续一定时间来完成奥氏体晶粒的扩撒过程。
形变热处理对低碳微合金钢焊接接头组织与性能的影响
热处理前
300
250
200
热处理后
150
焊缝中心位置
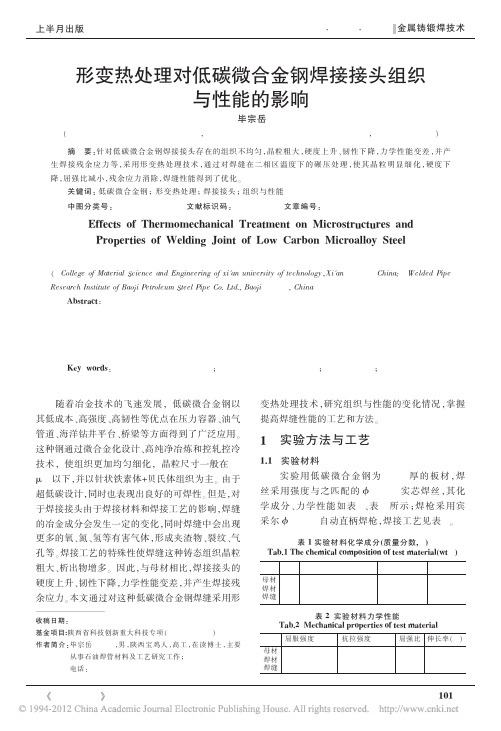
100 1 2 3 4 5 6 7 8 9 10 测试点 图 3 热处理前后焊缝硬度变化情况 Fig.3 Hardness change before and after thermomechanical treatment
硬度 (HV10)
屈强比
0.84 0.92
/
伸 长 率 (%)
26 32 /
《热加工工艺》 2008 年第 37 卷第 19 期
101
金属铸锻焊技术 Casting8 年 10 月
表 3 焊接工艺 Tab.3 Welding process
焊接方法 焊接电流 焊接电压 焊接速度 坡口形式 O2 添加量
不大,约为 10~20 MPa。 在所试验的 700~950 ℃
温度范围内温度变化时,抗拉强度基本保持不变,
但是屈服强度随着形变热处理温度的提高呈减小
趋势,如图 5 所示,减小约 90 MPa。
720
热处理前
710
700
σb/ MPa
690
680
670
660
热处理后
650 1 2 3 45 6 7 8
变热处理技术,研究组织与性能的变化情况,掌握 提高焊缝性能的工艺和方法。
1 实验方法与工艺
1.1 实验材料 实 验 用 低 碳 微 合 金 钢 为 4 mm 厚 的 板 材 ,焊
丝采用强度与之匹配的 准1.2 mm 实芯焊丝,其化 学成分、力学性能如表 1、表 2 所示;焊枪采用宾 采尔 准1.2 mm 自动直柄焊枪,焊接工艺见表 3。
Key words: lowcarbon microalloy steel; thermomechanical treatment; welding joint; microstructures and properties
Wire drawing大中拉培训教材精品资料

the length increases the diameter is reduced
L0
L1
d0
V0
d1
V1 V0 = V1
Wire drawing basics page2/29
CONFIDENTIAL
Vermeulen Dirk 01/05
Wire drawing basics page18/29
CONFIDENTIAL
Vermeulen Dirk 01/05
19 Example
Capstan 620mm, waterflow 1.1l/sec water temperature in 25.4°C – temp out 29.3°
Power to cooling water :
formula : waterflow l/sec × delta T x specific heat water 1.1×(29.3-25.4) × 4.19 = 18kW
This is 60 to 70% of the power that can be used on this capstan : 18/60%(70%) x 100% = 25.7 - 30 kW max
T²emp top : <80°C (176°F)
Temp bottom < 160°C(320°
water flow e.g. Capstan 620mm : min 60l/min
bucket of 10l measure the time till it's full calculate water flow
基于ANSYS WorkBench一字型转轴扭矩分析

·26·设计与研究 Nhomakorabea机械 2018 年第 7 期 第 45 卷
成,该转轴轴套内孔为圆柱面,锥片外表面为 螺母,建立分析模型如图 2 所示,该模型包含
圆柱面、内表面为锥面, 轴芯外表面为锥面, 轴套、锥片(3 个)以及轴芯。轴芯直径 6 mm、
通过锥片内表面和轴芯外表面两个锥面的配合, 锥度 1°,锥片厚度 0.4 mm、与轴套接触宽度 1
设置 4 个求解步,每步 1 s,根据转轴工作
WorkBench 分析锥片外圆与轴套内孔产生的挤 实际情况,设置如图 3 所示的固定面,轴芯左
( Suzhou Institute of Trade & Commerce, Suzhou 215009 , China ) Abstract:Torque analysis of linear type hinge by transient structural in ANSYS WorkBench, in the analysis, the deformation of cone pieces is nonlinear, the friction coefficient of the contact surface is set up according to the actual situation. Analysis results show that cone pieces are elastic deformation, inhomogeneous deformation, friction stress distribution is not uniform, the vast majority of cone pieces and sleeve in sliding state, small part will produce adhesion, little penetration between the contact surfaces, the friction force between the cone pieces and the shaft sleeve increases nonlinearly with the central spindle displacement, the nonlinear curve between the torque of the hinge and the displacement of the spindle is got. Key words:hinge;torque;finite element analysis;friction;ANSYS WorkBench
Wire drawing大中拉培训教材学习资料

Wire drawing basics page10/29
CONFIDENTIAL
Vermeulen Dirk 01/05
2
Vermeulen Dirk 01/05
7 Deformation
Wire drawing basics page7/29
CONFIDENTIAL
Inhomogeneous deformation, shear loss, redundant work
2
Vermeulen Dirk 01/05
8 Drawing force graph
11 power
➢ 9kW ?? =
Wire drawing basics page11/29
CONFIDENTIAL
Vermeulen Dirk 01/05
12 power
➢ 32kW =
Wire drawing basics page12/29
CONFIDENTIAL
Vermeulen Dirk 01/05
3 Flow of the material
Wire drawing basics page3/29
CONFIDENTIAL
Vermeulen Dirk 01/05
4 how
➢ The deformation is done in a die
Force
power
Wire drawing basics page4/29
Force [N]
80
Effect of inhomogeneous deformation on anisotropy of AZ31 magnesium sheet

Effect of inhomogeneous deformation on anisotropy of AZ31magnesium sheetJidong Kang a,n,David S.Wilkinson b,Raja K.Mishra c,Wei Yuan d,Rajiv S.Mishra ea CanmetMATERIALS,183Longwood Road South,Hamilton,Ontario,Canada L8P0A5b Department of Materials Science and Engineering,McMaster University,1280Main Street West,Hamilton,Ontario,Canada L8S4L7c General Motors Research and Development Center,30500Mound Road,Warren,MI48090-9055,USAd Center for Friction Stir Processing,Department of Materials Science and Engineering,Missouri University of Science and Technology,Rolla,MO65409,USAe Center for Friction Stir Processing,Department of Materials Science and Engineering,University of North Texas,Denton,TX76203,USAa r t i c l e i n f oArticle history:Received18July2011Received in revised form24July2012Accepted24August2012Available online5September2012Keywords:Magnesium alloyPlastic deformationr-ValueNeckingFriction stir processinga b s t r a c tInhomogeneous plastic deformation in AZ31magnesium sheet has been studied during uniaxial tensiletesting using digital image correlation and electron backscatter diffraction rge straingradients develop on the sheet surface parallel and perpendicular to the loading direction while verylittle deformation occurs in the thickness direction.This lack of thinning leads to an abrupt fracturefollowing the development of a premature but extensive diffuse neck but without any localized neck.The strain distribution on the sheet surface evolves nonlinearly with strain,impacting the measuredplastic strain ratio,r-value.The results show that r-value should be measured at‘‘points’’rather thanover the‘‘gage length’’in Mg alloys.Friction stir processing modifies the basal texture and thussignificantly improves the forming limit for in-plane plane strain path.&2012Crown Copyright and Elsevier B.V.All rights reserved.1.IntroductionThere is increasing interest in utilization of magnesium alloysin automotive applications due to their low density,superiorspecific tensile strength and rigidity compared to steel andaluminum alloys[1–2].However,it is well recognized that theformability of wrought magnesium alloys at room temperature isinferior to these competitors.The poor formability of magnesiumalloys is due to their hexagonal close packed crystal structure andthe consequent lack of sufficient active slip systems at roomtemperature[1–2],requiring that twinning be used to enablegeneral shape change in a polycrystal.Because twin activation isstress-state dependent,Mg alloys also exhibit significant plasticanisotropy resulting in asymmetry between tension and compres-sion in terms of yield stress,and plastic strain ratio(r-value,i.e.width to thickness strain ratio)for example[3–8].Most publishedstudies on the relationship between the mechanical propertiesand deformation mechanisms have relied on macroscopic stress–strain measurements and assume uniform strain over the tensilegage length(common in studies of cubic metals such as steel andaluminum)to interpret microstructural observations.In thispaper we question the validity of this assumption when appliedto Mg alloys.The influence of the inhomogeneous deformation on mechan-ical properties is revealed from a measurement of the plasticstrain ratio,the so-called r-value,which is commonly defined as[9–10]r¼e we t¼Àe we l e wð1Þwhere e l,e w,and e t are longitudinal,width,and thickness strains,respectively.Thickness strain is difficult to measure using an extensometerduring standard tensile testing.Two extensometers are usuallyused over a certain gage length in the longitudinal and widthdirections and the incompressibility criterion along with theassumption of uniform strain distribution over the gage lengthis used to determine the r-value[10].In practice,when twoextensometers are not available,high elongation strain gages areused instead[11]or one simply measures the specimen width at agiven axial strain[12].Usually r-values are constant once the strain is at relativelylarge, e.g.at strain of10–15%and beyond(depending on thematerials)[9–10].However,it has been reported that for AZ31magnesium sheets,r-values increase with increasing global strain[11–12].This has posed a challenge to numerical modeling andContents lists available at SciVerse ScienceDirectjournal homepage:/locate/mseaMaterials Science&Engineering A0921-5093/$-see front matter&2012Crown Copyright and Elsevier B.V.All rights reserved./10.1016/j.msea.2012.08.117n Corresponding author.Tel.:þ19056450820;fax:þ19056450831.E-mail address:jkang@nrcan.gc.ca(J.Kang).Materials Science&Engineering A567(2013)101–109raised questions of the validity of the r-value in magnesium alloys.This study addresses these issues.We present experimental data from simultaneous measurement of local strain and its evolution on the flat surface and the through thickness plane of the tensile sample using the digital image correlation (DIC)technique.Electron backscattered diffraction (EBSD)of the same surfaces is used to determine the nature of twinning accompany-ing the deformation.The dependence of the inhomogeneity of deformation on the deformation mechanism as well as the influence it has on the measurement of macroscopic r-values will also be discussed.Friction stir processing (FSP)has been used to process magne-sium alloys in order to refine the microstructure and enhance strength [13–16].It has been shown that there is significant modification of the basal texture during FSP [16–18].In this contribution,we focus our effort on the impact of the texture modification by FSP on r-values and include the FSP AZ31data along with that for rolled AZ31data to confirm our interpretation.2.Experimental proceduresA 2mm thick AZ31sheet material with a nominal composition of 3wt%Aluminum and 1wt%Zinc was used in the present study.The sheets were annealed at 4501C for 30min in a vacuum furnace and cooled to obtain a recrystallized starting microstruc-ture.The resulting grain structure has an average grain size of 16m m.Uniaxial tensile samples were machined according to ASTM standard B557-10[19]with a gage length of 20mm and larger transition radius ensuring fracture within the gage length (Fig.1(a)).The tensile tests were conducted at room temperature at a nominal strain rate of 6Â10À4/s.A commercially available optical strain measurement system based on DIC,Aramis TD [20],was used to measure the surface strain during uniaxial tensile tests on both the sample surface and through thickness plane simultaneously.A random ink pattern was applied to the sample surface within the gage length using airbrush prior totensileFig.2.Engineering stress–engineering strain curve of an AZ31sheetmaterial.Fig.1.Tensile samples:(a)uniaxial tensile sample for as received AZ31materials,(b)tapered tensile sample,and (c)uniaxial tensile sample for friction stir processed materials.J.Kang et al./Materials Science &Engineering A 567(2013)101–109102tests.The images were taken at a rate of 1image per second.A facet size of 15pixels and step size of 13pixels were used for the strain calculation.This was calibrated to be equivalent to a gage length of 300m m.A tapered sample (Fig.1(b))was designed to investigate twinning during the tensile deformation.The strain distribution over the entire sample was followed by DIC.The test was stopped when the maximum stress was reached in the tapered cross section.The sample was then cut into two halves at the center —the left part was mounted on the surface plane while the right part was mounted on the through thickness plane.The mounted samples were mechanically polished with 0.05m m colloidal silica.The polished samples were first used for electron backscatter diffraction (EBSD)to determine the types of twins developed during the tensile tests and then etched using picric acid solution for optical microscopy to reveal twins in different regions.The EBSD measurements were conducted on a Zeiss N-Vision field emission SEM at a step size of 0.1m m whiletheFig.3.DIC maps showing the evolution of:(a)longitudinal strain,(b)width strain,and (c)thickness strain in a uniaxial tension sample of AZ31.e g represents global strain over a gage length of 25mm.J.Kang et al./Materials Science &Engineering A 567(2013)101–109103optical micrographs were obtained using a Zeiss microscope equipped with a Nikon digital camera.Prior to EBSD scans,secondary SEM images were observed and compared with optical images to ensure sufficient twins be observed within the field of view.FSP was used to modify the texture and microstructure of the rolled AZ31sheet [18].A tool with a 12mm diameter concave shoulder and a 1.5mm conical pin was employed.FSP was carried out at a tool rotation rate of 700revolutions per minute (rpm)and a tool traverse speed of 1.7mm/s with 2.51tool tilt.A 2mm commercial grade AZ31magnesium sheet was placed beneath the AZ31sheet to accommodate the limited tool penetration.DuetoFig.4.Line scan of longitudinal strain and width strain at the center of the sample surface during:(a)early deformation and (b)post diffuse necking deformation inAZ31.Fig.5.Line scan of longitudinal strain during deformation in the ‘‘post diffuse neck’’stage in AA5754aluminum sheet.The strain gets localized when the shear bandforms.Fig.6.Twinning development in a tapered AZ31tensile sample.J.Kang et al./Materials Science &Engineering A 567(2013)101–109104the size limit,tensile samples with6mm width along the processing direction were machined from the FSPed region only, according to ASTM Standard E2448-08[21](Fig.1(c)).The top surface was milled slightly to remove FSP marks while the samples were machined from the bottom surface to afinal thickness of1mm to ensure uniform texture and microstructure distribution[18].For comparison,the surface strains on theflat face and the thickness surface were measured in a strip cast AA5754alumi-num alloy sheet,which had been rolled to2mm thickness and annealed.The chemical composition and mechanical properties of the AA5754material can be found elsewhere[22].3.Results and discussionThe engineering stress–engineering strain curve for the annealed AZ31sheet pulled along the rolling direction(RD)is shown in Fig.2.The strain hardening index(n)is0.22based on a power lawfitting of the true stress–true strain curves whilethe Fig.7.EBSD data showing extension twins,contraction and double twins at:(a)5%global strain and(b)10%globalstrain.Fig.8.Evolution of r-value with global strains in AZ31based on different algorithms described in the text.J.Kang et al./Materials Science&Engineering A567(2013)101–109105strain to maximum load is0.12.An early onset of diffuse necking can be noted in this material according to the Considere condition followed by prolonged post necking deformation.An examination of the DIC strain patterns on the surface in the diffuse necking stage of the deformation(Fig.3(a)(iv)–(vi)) shows that shear bands do not develop across the width of the sample.Fracture occurs after the premature but profound phase of diffuse necking without the development of localized necking.Fig.3shows that both the longitudinal and width strains are non-uniformly distributed within the gage length.The nonuni-form and nonlinear distribution and evolution of strain are more evident in the line scan of longitudinal and width strains shown in Fig.4.The line scans were in the center of the sample within the gage length along the tensile direction.Both longitudinal and width strain at a given cross section keep evolving with global strain.The magnitude of the local width strain is nearly compar-able with that of the longitudinal strain while the corresponding strain value in the thickness direction is very small.In other words,the necking process occurs in plane strain involving a narrowing process accompanied by minimal thinning.These data are compared with the evolution of local strain during uniaxial tensile testing of an AA5754aluminum alloy sheet sample shown in Fig.5.Beyond the diffuse necking stage, strain within a narrow region increases with increasing global strain while strain outside this narrow region remains unchanged. The narrow region corresponds to the experimentally observed localized necking.Fig.6shows optical micrographs taken from the surface of a tapered sample deformed up to the necking strain in the tapered region.Images corresponding to regions with strains of0.05,0.10, 0.15,and0.19as measured by DIC show that even the region corresponding to a low strain value of0.05contains twins. The density of twins increases with increasing strain.Fig.6shows that twins tend to cluster by an auto catalytic process to form shear bands above a strain of0.10.The shear bands get denser with increasing strain.EBSD data from these locations(Fig.7)reveal that the location corresponding to the strain of0.05contains a number of grains deformed by extension twinning.Contraction twins are observed in areas corresponding to a strain of0.10or higher.The latter coincides with the onset of diffuse necking in the material. Contraction twins presumably form to accommodate the defor-mation in the thickness direction(which is along the c-axis).The low thickness strain measured by DIC is consistent with the observation of contraction twins which are difficult to formdueFig.9.Polefigure of:(a)as received and(b)friction stir processed AZ31material.Fig.10.Engineering stress–engineering strain curve of a friction stir processed AZ31sheet material.J.Kang et al./Materials Science&Engineering A567(2013)101–109106to the high critical stress values needed for their formation,their low volume fraction and their clustering in closely spaced shear bands in the diffuse neck[23].The current experimental method enables the independent measurement of all three strain components—the longitudinal, width,and thickness strains at each point from whichlocal Fig.11.DIC maps showing the evolution of:(a)longitudinal strain and(b)width strain in a uniaixal tension of a friction stir processed AZ31sample.e g represents global strain over a gage length of15mm.Fig.12.Evolution of r-value with global strains in a friction stir processed AZ31sample.J.Kang et al./Materials Science&Engineering A567(2013)101–109107r-value can be determined.Plots of the r-value evolution with global strain based on strain measurements using(i)longitudinal and width strains(commonly used),(ii)width and thickness strains at different locations,and(iii)longitudinal and width strains measured at a given point are shown in Fig.8.‘‘gage length,Y,X’’in Fig.8represents r-values calculated using strain measurements on the sample surface within the gage length in loading(Y)and width directions(X),hereafter referred to as Case1;‘‘gage length,X,t(center)’’and‘‘gage length,X,t(quarter)’’represent r-values calculated using measured width strain and thickness strain in the center or quarter length in the sample,respectively, hereafter referred to as Case2;‘‘point on surface,center,Y,X’’and ‘‘point on surface,quarter,Y,X’’represent r-values calculated using strain measurements at selected points on the sample surface in the center(within the necked area)or quarter length,respectively, hereafter referred to as Case3.The r-values for Cases1–3are quite different.In Case1,r-value increases with increasing global strain,similar to what has been reported in the literature[7].For Case2,since thickness strain is not uniformly distributed along the length direction of the sample, r-value varies with the location of the thickness strain.The r-value measured using strain values measured at‘‘points’’(Case3)shows that r-value does not evolve above a strain of0.10regardless of the locations of the selected points,i.e.within or outside the necked area.As shown in Fig.3,the assumption of uniform strain in the gage section is not accurate,especially above10%globalstrain.Fig.13.Evolution of r-value with global strain in an AA5754sheetmaterial.Fig.14.Thickness strain evolution in AZ31and AA5754alloys.J.Kang et al./Materials Science&Engineering A567(2013)101–109108Since strain at a given point is calculated based on facet size in DIC measurements,i.e.an actual spacing of0.3mm in the present case, strain over this spacing can be regarded as macroscopically uni-form.Therefore,r-value measurements based on a‘‘point’’in Case 3are consistent with the common definition of r-value.On the other hand,r-value data taken from the full gauge length(Case1) should be treated with caution in view of the nonlinearity of strain distribution within the gage length in the longitudinal and width directions shown in Figs.3and4.In the friction stir processed material,the intensity of the basal poles is enhanced from a value of15to59units.More importantly, the basal poles are tilted461compared to the as received material (Fig.9).Tensile tests data show that the yield strength decreases from 157MPa to72MPa and a linear work hardening behavior(Fig.10)is observed in the FSP material.The strain distribution is very uniform along the gage length and there is very little shrinkage in the width direction during the deformation(Fig.11).From Fig.11,we conclude that the material is indeed in an in-plane plane strain state.This is evident when plotting r-value evolution with strain(Fig.12),where it is clear that the r-values in the friction stir processed materials are close to0.1regardless of global strain value.The measured r-values using Case1and Case3criteria in AA5754sheet material(Fig.13)show no difference.Even with the existence of moving Portevin-Le Chatelier(PLC)bands in the Al–Mg alloy(AA5754has3wt%Mg),the r-values based on strain measurements over the gage length tend to be constant beyond 10%strain,similar to the data in the literature[24–25].Fig.14shows the evolution of thickness strain,estimated using tensile strain and width strain based on the constant volume assumption.Here,‘‘average’’denotes thickness strain estimated from both tensile strain and width strain from given gage lengths while ‘‘point’’denotes thickness strain at a point within necked area.The figure shows that in AZ31sheet,average thickness strain is about À2%for global strain values between5%and10%and then it increases to a positive value until the material fractures.This is consistent with the surface strain observation indicating that width strain is comparable to tensile strain until diffuse necking takes place. After diffuse necking,narrowing of the width dominates the defor-mation process.This results in the apparent artifact shown in Fig.14 whereby the value of average thickness strain increases with increas-ing global strain since the width strain is measured within the necked area while tensile strain is measured globally.In contrast,in AA5754 aluminum alloy,the average thickness strain keep decreasing with global strain until a global strain of0.19which corresponds to maximum load,i.e.the onset of diffuse necking.Then the average thickness strain continues to increase until a global strain of0.23 which corresponds to the occurrence of localized necking.After localized necking commences,thinning in the thickness direction dominates the deformation process.In fact,the value of the local thickness strain keeps increasing with increasing global strain.Details of the deformation process in AA5754can be found elsewhere[25].In friction stir processed AZ31,there is very little difference between the average and point thickness strain indicating width strain is rather small during the deformation process.4.SummaryInhomogeneous plastic deformation during uniaxial tensile deformation of AZ31magnesium sheets has been investigated using digital image correlation and electron backscattered diffraction.The results are compared with those from friction stir processed AZ31and AA5754aluminum alloy sheets.From the results presented we are able to conclude the following:(1)AZ31exhibits little deformation in the thickness direction.Instead large strain gradients exist in the sheet parallel and perpendicular to the loading direction during tensile deformation.(2)The lack of thinning leads to premature but extensive diffusenecking followed by an abrupt fracture,without transitioning to localized necking.(3)The observed inhomogeneous deformation arises from thestrong basal texture and the necessity for the formation of contraction and double twins.(4)r-value measurement in Mg alloys is shown to be sensitive tothe method of measurement of the width and thickness strain.In view of the nonlinear evolution of strain distribution on the sheet surface,strains should be measured at‘‘points’’rather than over the‘‘gage length’’to report r-values in Mg alloys.(5)Friction stir processing modifies the basal texture,thus sig-nificantly improves the forming limit for the in-plane plane strain path.AcknowledgmentsThe authors would like to acknowledge the support of the Resource for the Innovation of Engineering Materials Program at the CanmetMATERIALS of Natural Resources Canada and of Dr.Elhachmi Essadiqi in particular.Robert Kubic Jr.of GM R&D Center helped with EBSD measurements.References[1]R.E.Reed-Hill,W.D.Robertson,Acta Metall.5(1957)728.[2]P.G.Partridge,Metall.Rev.12(1967)169.[3]B.C.Wonsiewicz,W.A.Backofen,Trans.Metall.Soc.AIME239(1967)1422.[4]E.W.Kelly,W.F.Hosford,Trans.Metall.Soc.AIME242(1968)5.[5]M.R.Barnett,Z.Keshavarz,A.G.Beer,D.Atwell,Acta Mater.52(2004)5093.[6]J.Koike,Metall.Mat.Trans.A36A(2005)1689.[7]J.Bohlen,M.R.Nurnberg,J.W.Senn,D.Letzig,S.R.Agnew,Acta Mater.55(2007)2101.[8]J.Levesque,K.Inal,K.W.Neale,R.K.Mishra,Int.J.Plast.6(2010)65.[9]W.F.Hosford,R.M.Caddell,Metal Froming—Mechanics and Metallurgy,3rded.,Cambridge University Press,2007,p.207.[10]ASTM Standard E517-00,West Conshohocken,PA,USA,2010.[11]A.Khan,A.Pandey,T.Gnaupel-Herold,R.K.Mishra,Int.J.Plast.27(2011)688.[12]X.Y.Lou,M.Li,R.K.Boger,S.R.Agnew,R.H.Wagoner,Int.J.Plast.23(2007)44.[13]K.Nakata,S.Inoki,Y.Nagano,T.Hashimoto,S.Johgan,hio,Jpn.Ins.Light Metals.51(2001)528.[14]A.H.Feng,Z.Y.Ma,Scri.Mater.56(2007)397.[15]Y.N.Wang,C.I.Chang,C.J.Lee,H.K.Lin,J.C.Huang,Scri.Mater.55(2006)637.[16]W.Woo,H.Choo,D.W.Brown,P.K.Liaw,Z.Feng,Scri.Mater.54(2006)1859.[17]S.H.C.Park,Y.S.Sato,H.Kokawa,Metall.Mater.Trans.A34A(2003)987.[18]W.Yuan,R.S.Mishra,B.Carlson,R.K.Mishra,R.Verma,R.Kubic,Scri.Mater64(2011)580–583.[19]ASTM Standard B557-10,West Conshohocken,PA,USA,2010.[20]Aramis user manual,v.6,GOM mbH,Braunschweig,Germany,2007.[21]ASTM Standard E2448-08,West Conshohocken,PA,USA,2008.[22]J.Kang,D.S.Wilkinson,M.Jain,J.D.Embury,A.J.Beaudoin,S.Kim,R.Mishra,A.K.Sachdev,Acta Mater.54(2006)181.[23]L.Jiang,J.J.Jonas,A.A.Luo,A.K.Sachdev,S.Godet,Scri.Mater.54(2006)771.[24]W.J.Tong,Mech.Phys.Solids46(1998)2087.[25]J.Kang,D.S.Wilkinson,J.D.Embury,M.Jain,SAE Trans.J.Mater.Manuf.114(2005)156.J.Kang et al./Materials Science&Engineering A567(2013)101–109109。
基于GPS和强震资料反演汶川8.0级地震的同震滑动模型
第1期(总第178期)2021年3月四川地震 EARTHQUAKERESEARCHINSICHUANNo.1Mar.2021收稿日期:2020-11-30;修回日期:2020-12-09基金项目:四川省地震局科技专项(LY1908)和“川滇区域GNSS大地构造物理及壳幔动力研究”科技创新团队(201803)资助.作者简介:陈聪(1983-),女,四川威远人,高级工程师,主要从事GNSS数据分析工作.E-mail:24947542@qq.com.基于GPS和强震资料反演汶川8.0级地震的同震滑动模型陈 聪,何福秀,张 澜(四川省地震局,四川成都 610041)摘 要:通过震中附近GPS同震位移资料,采用SDM反演法,应用均匀介质模型和分层地壳结构模型分别反演汶川8.0级地震的同震滑动,并加入强震资料进行反演对比分析,结果表明:两种模型反演的同震滑动分布与发震断层的科考结果吻合,分层地壳结构模型的反演结果整体上要优于均匀地壳结构模型的反演结果;GPS与强震数据分别反演得到的同震位移方向、幅度和断层错动方式基本一致,GPS、强震单一数据反演和联合反演结果得到的矩震级、平均滑动量具有很好的一致性。
总体而言,强震模型的最大滑动量和最大应力降较GPS模型的结果更为显著,可能与强震数据中出现较大水平位移的站点与断层更为接近有关。
关键词:汶川地震;同震位移;GPS;强震;同震滑动模型中图分类号:P315.7 文献标识码:B 文章编号:1001-8115(2021)01-0001-05DOI:10.13716/j.cnki.1001-8115.2021.01.0012008年5月12日,青藏高原东缘龙门山断裂带发生MS8 0强烈地震并引发了巨大的地质灾害。
地质考察结果表明,本次地震造成的最大垂直破裂错距和右旋水平错距分别达6 2m和4 9m(徐锡伟等,2008)。
地震波反演结果表明,本次地震引起的断层面上的最大位错7~12m(王卫民等,2008)。
- 1、下载文档前请自行甄别文档内容的完整性,平台不提供额外的编辑、内容补充、找答案等附加服务。
- 2、"仅部分预览"的文档,不可在线预览部分如存在完整性等问题,可反馈申请退款(可完整预览的文档不适用该条件!)。
- 3、如文档侵犯您的权益,请联系客服反馈,我们会尽快为您处理(人工客服工作时间:9:00-18:30)。
j o u r n a l o f m a t e r i a l s p r o c e s s i n g t e c h n o l o g y201(2008)128–132j o u r n a l h o m e p a g e:w w w.e l s e v i e r.c o m/l o c a t e/j m a t p r o t ecInhomogeneous deformation and residual stress in skin-pass axisymmetric drawingHeng-Sheng Lin∗,Yuan-Chuan Hsu,Chia-Chow KehDepartment of Mechanical and Computer-Aided Engineering,National Formosa University,Hu-Wei,Yunlin632,Taiwana r t i c l e i n f oKeywords:Skin-passAxisymmetric drawing Inhomogeneous deformation Residual stress a b s t r a c tSkin-pass drawing is usually conducted in thefinal stage of wire,rod or shaped-section drawing or shape rolling.It helps improve shape accuracy and reduce residual stress of the drawn or rolled workpieces.However,its characteristic low reduction induces large -parameter,and causes significant inhomogeneous deformation in the workpiece.In this work,finite-element software DEFORM2D was utilized to investigate the effect of -parameter on inhomogeneous deformation and residual stress of mid-carbon steel through various combinations of area reduction and die semi-angle.The effect of the friction was also investigated.The results showed that the inhomogeneity factor of effective strain decreased with area reduction and increased with die semi-angle and friction.The level of inhomogeneous deformation could be reduced by drawing with small die semi-angle, and the influence of the friction was only substantial near the surface of the drawn work-piece.The axial and circumferential residual stresses would approach to compressive on the drawn surface in extreme light reductions.©2007Elsevier B.V.All rights reserved.1.IntroductionSkin-pass drawing is usually conducted in thefinal stage of wire,rod or shaped-section drawing or shape rolling.It helps improve shape accuracy and reduce residual stress of drawn or rolled workpieces.However,its characteristic low reduction induces large -parameter,and causes significant inhomo-geneous deformation in the workpiece.The -parameter is defined as=h(1)where h is the mean diameter of the workpiece and L is the contact length between the deforming workpiece and the die. The -parameter,though not perfectly,is a measure of the influence of the deformation geometry upon the drawn work-piece(Hosford and Caddell,1983).For axisymmetric drawing,∗Corresponding author.Tel.:+88656315311;fax:+88656315310.E-mail address:hslin@.tw(H.-S.Lin). can be expressed as=sin˛r(1+√1−r)2(2)where is the die semi-angle,r is the reduction of the cross-sectional area.Eq.(2)indicates that increases when ˛increases or r decreases.However,the small reduction used in skin-pass drawing intuitively bears a relatively large value and impairs its goal of improving shape accuracy.Backofen(1972)defines a hardness inhomogeneity factor to evaluate the level of inhomogeneous deformation asIF=H s−H cH c(3) where H s and H c are the Vickers hardness at the surface and center,respectively.This definition is suitable for experimen-tal approach,whereas in the FE simulation the distribution0924-0136/$–see front matter©2007Elsevier B.V.All rights reserved. doi:10.1016/j.jmatprotec.2007.11.126j o u r n a l o f m a t e r i a l s p r o c e s s i n g t e c h n o l o g y201(2008)128–132129of hardness is not available.Since hardness is caused by thestraining of the material,and in order to facilitate the analysisof the data obtained from FE simulation,Backofen’s definitionof inhomogeneity factor is further modified asIFε=εs−εcεs(4)whereεs andεc are the effective strain at the surface and cen-ter,respectively.The denominator is replaced by the effective strain at the surface because the magnitude of the effective strain might approach to very small value for skin-pass draw-ing and cause the inhomogeneity factor of strain to approach to a quite large value.A larger IFεrepresents a larger discrep-ancy between the effective strain of the surface and center,i.e., a drawing condition with more inhomogeneous deformation. Through the definition of Eq.(4),the level of inhomogeneous deformation incurred by the process parameters can be read-ily analyzed by extracting the effective strain of the surface and center out of the FE simulation,without consorting to the experimental measurement of hardness.The definition of the inhomogeneity factor of hardness, Eq.(3),only takes into account the discrepancy of hardness between the surface and center of the drawn workpiece.It also assumes that the maximum hardness occurs on the surface and the minimum hardness occurs at the center.However, from the FE simulation of this work,it was observed that the effective strain does not necessarily increase monotonically from the center to the surface.The maximum effective strain might occur somewhere near the surface.Therefore a more objective definition,the mean variation of effective strain,was also applied to assess the level of inhomogeneous deformation which is defined as¯ε= ni=1|εi−¯ε|r2i−r2i−1r2f(5)where r i is the radius of the i th point,and i=0corresponds to the center and i=n corresponds to the surface;r f is the radius of the drawn workpiece.εi is the effective strain at point i, and¯εis the mean effective strain of the cross-section which is defined as¯ε= ni=1εi(r2i−r2i−1)r2f(6)Up to now,there has been abundant work reported for rod or wire drawing of medium reductions.However limited number of work was devoted to the drawing process of light reductions.This work focuses on investigating the relation-ship of the inhomogeneous deformation of effective strain as well as residual stress with the area reduction of the work-piece,the die semi-angle and workpiece/die friction condition byfinite-element simulation.2.Finite-element simulationFinite-element software DEFORM was used in simulating the skin-pass drawing process.Since the process is axisymmetric in nature,the2D Version8.0axisymmetric module was cho-sen.Mid-carbon steel AISI-1045was used as the workpiece material,and the built-in stress–strain relationship of elasto-plasticity at20◦C with yield strength640MPa was selected. Heat transfer effect was not considered.There were5000ele-ments used in meshing the workpiece,andfiner meshes were constructed close to the surface in order to better scope the “skin-pass”process.Billet length was20mm and the outlet diameter of the drawing die was10mm.Reduction of cross-section selected was from2to10%.Converging die was used and assumed to be rigid.Values of the die semi-angle are from 2to20◦.Die bearing length was4mm and the radius of thefil-let joining the bearing and the converging zone was0.2mm. The drawing speed wasfixed at67mm/s.The frictional law of constant shear strength was used and friction factors0.1,0.3 and0.5were ually drawing with a small friction factor corresponds to a forming condition of better lubrica-tion at the workpiece/die interface and vice versa.Drawing with the billet is unsteady at the beginning and near the end of the process.Steady values appear at the middle of the billet and satisfactory data acquisition of the drawing load,cross-sectional distributions of the effective strain and the residual stress can be obtained.3.Results and discussion3.1.Optimum die semi-angleThough minimizing drawing stress is not the primary consid-eration of skin-pass drawing,the evaluation of the optimum die semi-angle is still essential in understanding the char-acteristics of the process.Fig.1shows the variation of the normalized drawing stress with die semi-angle with area reductions ranging from2to10%.The normalized drawing stress was obtained by dividing the drawing load with the outlet area of the drawn workpiece and normalized with the yield strength of workpiece.The friction factor was0.1.For a selected reduction,the drawing stressfirst decreases and then increases with die semi-angle,as a consequence that the frictional work decreases and the redundant work increases with die semi-angle(Hosford and Caddell,1983).The angle which yields the minimum drawing stress is the optimum die semi-angle of the respective reduction.The optimum angle gradually increases from4to6◦as the reduction increases from2to10%.Same trends had been reported by Avitzur(1990)Fig.1–Variation of drawing stress with die semi-angle for various reductions.130j o u r n a l o f m a t e r i a l s p r o c e s s i n g t e c h n o l o g y 201(2008)128–132Fig.2–The influence of friction factor on the optimum angle.with larger reductions and incurring with larger optimum die semi-angles.The influence of friction on the optimum angle is shown in Fig.2with friction factors of 0.1,0.3and 0.5and for area reduc-tions of 2and 10%,respectively.A significant increase of the optimum angle from 6to 8and 10◦is observed in drawing with the higher reduction of 10%,whereas no significant increase of optimum angles is observed for the smaller reduction of 2%.In drawing with relatively low reduction,the decrease of the frictional work with die semi-angle becomes less sig-nificant because the contact length between the deforming workpiece and the die becomes relatively small.Therefore,the result suggests,on the basis of minimizing drawing stress,using a larger die semi-angle when the lubrication condition is poor,especially in drawing with larger reductions.However,the optimum angle remains unchanged with the lubrication condition in skin-pass drawing.3.2.Inhomogeneous deformation 3.2.1.Distribution of effective strainFig.3illustrates the distribution of effective strain for 2%reduction.Friction factor was fixed at 0.1.The distribution shows that the minimum effective strain occurs at the cen-ter and its value is close to its nominal cross-sectional area reduction.The maximum effective strain occurs near the sur-face of the drawn workpiece for the selected die semi-angle.The larger the maximum effective strain,the higher level of inhomogeneous deformation is produced by the drawing pro-cess.The difference in effective strain among therespectiveFig.3–Distribution of effective strain for 2%reduction.Fig.4–Distributions of effective strain for various reductions and frictionfactors.Fig.5–Variation of inhomogeneity factor with -parameter for various die semi-angles.die semi-angles is not significant near the center whereas near the surface the effective strain increases dramatically with larger die semi-angles.Such trend becomes less substantial when drawing with larger reductions.However,in drawing with smaller die semi-angles,e.g.2or 4◦,the increase in effec-tive strain is insignificant and the strain distribution becomes more uniform.The level of inhomogeneous deformation is hence reduced.The influence of friction on inhomogeneous deformation is illustrated in Fig.4.It shows the distributions of effec-tive strain in drawing with 6and 2%reductions,respectively and 8◦die semi-angle with various friction factors.The dis-tributions indicate that the effective strain at the center is not affected by the chosen friction factor,i.e.,the lubrication condition between the workpiece and the die.The influence becomes significant near the surface and the effective strain is the greatest with friction factor of 0.5,followed by that of 0.3and 0.1.The slight drop in the effective strain on the surface can reduce the discrepancy of the effective strain between the surface and center,and hence reduce the inhomogeneity of deformation.3.2.2.Correlating inhomogeneity factor with -parameterFig.5shows the inhomogeneity factor of effective strain plot-ted against -parameter for various die semi-angles.The definitions of the IF εand are given by Eqs.(4)and (2),respectively.The plot shows a monotonic increase of the inho-mogeneity factor of effective strain with -parameter for each die semi-angle selected.At large values of -parameter,all thej o u r n a l o f m a t e r i a l s p r o c e s s i n g t e c h n o l o g y 201(2008)128–132131Fig.6–Variation of mean variation of effective strain with -parameter for various reductions.curves converge,indicating the level of inhomogeneous defor-mation is determined solely by the -parameter.However,at small values of -parameter,the curves diverge and the devi-ation becomes more obvious especially for drawing with 2◦die semi-angle.This indicates an identical -parameter would bear different levels of inhomogeneous deformation at small .Moreover,from the observation of the strain distribution of Fig.3,using the discrepancy of effective strain between the surface and the center was not an objective way in determin-ing the inhomogeneous deformation because the maximum effective strain might occur somewhere near the surface instead of at the surface.Therefore a statistical definition,the mean variation of effective strain,Eq.(5),is applied to assess the level of inhomogeneous deformation.Fig.6shows the mean variation of effective strain plotted against -parameter for various reductions.The plot shows that the statistical def-inition on the contrary leads to an even obvious deviation of inhomogeneity among each reduction selected,indicating the necessity of modifying the -parameter in correlating defor-mation inhomogeneity with the process parameters such as area reductions,die semi-angles and friction factor altogether.3.3.Residual stressResidual stress affects the geometrical precision of the drawn ually a residual compressive stress is desirable on the surface because it helps increase workpiece’s ability in resisting crack propagation and consequently increase work-piece’s service life.The distribution of residual stress is also affected by the selection of the process parameters like reduc-tion and die semi-angle and friction as well.Fig.7shows the distributions of axial residual stress of various die semi-angles at 6%reduction.The residual stress is normalized with yield strength,and the simulation also showed axial stress was more dominant than the circumferential stress.The axial residual stress exceeds its yield strength near the center and the surface of the drawn workpiece because of the work hard-ening effect.Residual stress becomes compressive near the center and tensile near the surface,and the level of resid-ual stress on the surface is minimum in drawing with 2◦diesemi-angle.Fig.7–Distribution of axial residual stress of various diesemi-angles.Fig.8–Residual stress becomes compressive on the surface at light reductions.Kuntani and Asakawa (2000)reported that axial residual stress was maximum in drawing with medium die semi-angle or medium reduction,which are the ordinary operation con-ditions in drawing.The axial residual stress would become compressive when the reduction is small.Fig.8shows the axial residual stress on the surface plotted against the -parameter of various friction factors in drawing with die semi-angle 8◦.The figure shows that the axial residual stress becomes compressive at reduction less than 0.4%,and the simulation also showed that the circumferential stress became compressive at reduction less than 0.3%.However,the relation between residual stress and friction factor was hardly to observe.The conditions of drawing with large die semi-angles were not simulated because of little relevancy in skin-pass drawing.4.ConclusionSeveral points can be drawn from the results of the simulation with DEFORM 2D as follows:(1)The evaluation of the optimum die semi-angle suggestedusing a large die semi-angle at high reductions and using a smaller angle at low reductions.When the lubrication condition was poor,the optimum die semi-angle would increase especially in drawing with larger reductions.132j o u r n a l o f m a t e r i a l s p r o c e s s i n g t e c h n o l o g y201(2008)128–132However,the optimum angle remained unchanged with the lubrication condition in skin-pass drawing.(2)The minimum effective strain occurred at the center andwas close to its nominal cross-sectional area reduction of the drawn workpiece.The maximum effective strain occurred near the surface.The differences in effective strain in drawing with various die semi-angles were not substantial near the center whereas near the surface the effective strain increased dramatically in drawing with larger die semi-angles.In drawing with very small die semi-angles,the increase in effective strain was insignifi-cant and the strain distribution became more uniform.The level of inhomogeneous deformation was hence reduced.The effective strain at the center was not affected by the friction but increased significantly with the friction near the surface.The larger the friction,the more inhomoge-neous deformation was incurred on the drawn workpiece.(3)The plot of inhomogeneity factor of effective strainagainst -parameter showed all the curves converged at large values of -parameter,indicating the level of inho-mogeneous deformation was determined solely by the -parameter.However,the curves diverged at small val-ues of -parameter,indicating an identical -parameter would bear different levels of inhomogeneous deforma-tion at small .The deviation became more obvious when the mean variation of effective strain was plotted against -parameter,indicating the necessity of modifying the -parameters in correlating deformation inhomogeneity with the process parameters.(4)Residual stress was compressive near the center andbecame tensile near the surface of the drawn workpiece, and the level of residual stress on the surface was min-imum in drawing with2◦die semi-angle.The residual axial stress was more dominant than the circumferential stress.The axial residual stress became compressive on the drawn surface at reduction less than0.4%,and the circumferential stress became compressive at reduction less than0.3%.The relation between residual stress and friction factor was hardly to observe.AcknowledgementThe authors would like to thank thefinancial support of the National Science Council of the R.O.C.under the grant of NSC 93-2212-E-218-006.r e f e r e n c e sAvitzur,B.,1990.The use of the personal computer for simulation of the process of wire drawing and extrusion in an interactive, user-friendly mode.Wire J.Int.23,48–60.Backofen,W.A.,1972.Deformation Processing.Addison-Wesley, Reading,Mass,p.140.Hosford,W.F.,Caddell,R.M.,1983.Metal Forming:Mechanics and Metallurgy.Prentice-Hall.Kuntani,N.,Asakawa,M.,2000.Analysis of the residual stress induced by bar and wire drawing.SEAISI Q.(July),35–41.。