学术会议海报模板
合集下载
国际会议海报Poster模板
75nm
A
Incident las0 5 0 -5 0
B
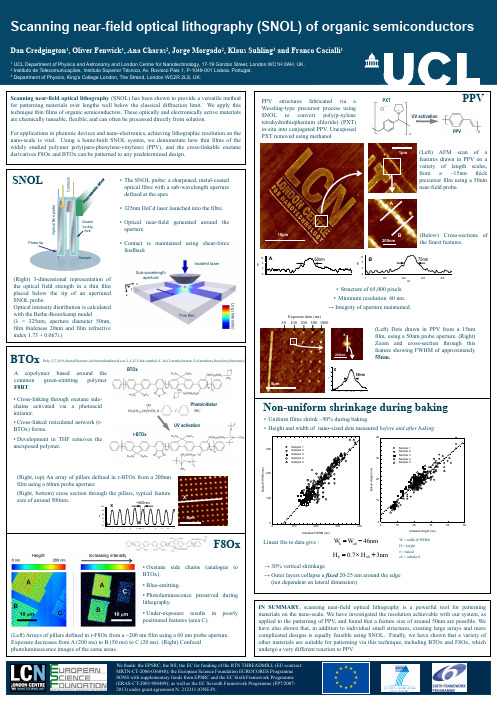
(Right) 3-dimensional representation of the optical field strength in a thin film placed below the tip of an apertured SNOL probe. Optical intensity distribution is calculated with the Bethe-Bouwkamp model (λ = 325nm, aperture diameter 50nm, film thickness 20nm and film refractive index 1.73 + 0.067i.)
Scanning near-field optical lithography (SNOL) of organic semiconductors
Dan Credgington1, Oliver Fenwick1, Ana Charas2, Jorge Morgado2, Klaus Suhling3 and Franco Cacialli1
BTOx
5µm
1 0
8
X
6
nm
4 2 0 0 50 1 00
nm 150
200
Photoinitiator
Non-uniform shrinkage during baking
• Uniform films shrink ~50% during baking. • Height and width of nano-sized dots measured before and after baking
A
Incident las0 5 0 -5 0
B
(Right) 3-dimensional representation of the optical field strength in a thin film placed below the tip of an apertured SNOL probe. Optical intensity distribution is calculated with the Bethe-Bouwkamp model (λ = 325nm, aperture diameter 50nm, film thickness 20nm and film refractive index 1.73 + 0.067i.)
Scanning near-field optical lithography (SNOL) of organic semiconductors
Dan Credgington1, Oliver Fenwick1, Ana Charas2, Jorge Morgado2, Klaus Suhling3 and Franco Cacialli1
BTOx
5µm
1 0
8
X
6
nm
4 2 0 0 50 1 00
nm 150
200
Photoinitiator
Non-uniform shrinkage during baking
• Uniform films shrink ~50% during baking. • Height and width of nano-sized dots measured before and after baking
学术poster海报模板3
Methods
You can use PowerPoint’s SmartArt to create flow charts and other types of diagrams.
1. Insert SmartArt 2. Select a diagram appropriate for your needs 3. Use the “insert text” box to label and add to your
❖Minimize the amount of text (hint: this template probably has too much text for an effective, eyecatching poster)! ❖ Be precise & succinct ❖ Use bullet points ❖ Where possible use diagrams or symbols ❖ ALL text should be large enough to read from several feet away- even figure captions!
Column 2
Figure 2.
Aenean imperdiet. Etiam ultricies nisi vel augue. Curabitur ullamcorper ultricies nisi. Nam eget dui.
To insert an image: 1. Insert Pictures 2. Navigate to the appropriate folder in the
To use this template, remove dummy text and images. Copy and paste your poster text and insert your own charts, graphs, diagrams and pictures. Some helpful hints:
学术会议精美海报模板-100
This is a label for the image. This is a label for the image. This is a label for the image. This is a label for the image. This is a label for the image. This is a label for the image. This is a label for the image. This is a label for the image. This is a label for the image. This is a label for the image.
Concentration of Chemical X for 50% Substance Y Activity Inhibition [IC50]
1.97E-06
0.003
0.0047 0.0021 0.0019
0.256
0.229
5 59
Sub X Sub Y Sub Z 1mer 2mer 3mer 4mer 5mer 6mer Crude extr. 5-enri. extr.
1E-04
1E-02
1E+00
1E+02
1E+04
Molar Component Concentration for 50% Inhibition
Results
These are my results. These are my results. These are my results. These are my results. These are my results. These are my results. These are my results. These are my results. These are my results. These are my results. These are my results. These are my results. These are my results. These are my results. These are my results. These are my results. These are my results. These are my results. These are my results. These are my results. These are my results. These are my results. These are my results. These are my results. These are my results. These are my results. These are my results. These are my results. These are my results. These are my results. These are my results. These are my results. These are my results.
学术会议精美海报模板-78
Figure 2: Your caption to go here
3rd Qtr
4th Qtr
Figure 3: Your caption to go here Quisque viverra lectus ac lectus
References:
Type your references in here: Aliquam nec lacus eget sapien venenatis semper. Donec placerat. Phasellus bibendum semper ligula. Duis vitae massa. Integer suscipit. Donec non elit vel nunc tincidunt iaculis. Nam in urna. Pellentesque eu enim. Nam pellentesque libero nec velit. Aliquam quis sem. Nulla vestibulum vehicula arcu. Vestibulum feugiat eleifend elit. Proin condimentum molestie urna. Etiam ut diam. Quisque viverra lectus ac lectus. Donec ultrices, nisi nec mollis ultricies, quam diam aliquam enim, eu vulputate sem leo non magna. Donec consequat facilisis nulla. Pellentesque eu enim. Nam pellentesque libero nec velit. Aliquam quis sem. Nulla vestibulum vehicula arcu. Vestibulum feugiat eleifend elit. Proin condimentum molestie urna. Etiam ut diam. Quisque viverra lectus ac lectus. Donec ultrices, nisi nec mollis ultricies, quam diam aliquam enim, eu vulputate sem leo non magna. Donec consequat facilisis
国际学术会议海报(poster)模板(英文)10

▪ The infants who more frequent and longer look to mother’s face in the interaction showed high emotional recognition in toddlerhood.
▪Findings from this longitudinal study suggest that infants’ social looking to their mothers during interactions may provide an opportunity to explore and percept others’ emotions.
Through social referencing, infants figure out how to feel and behave with respect to the many new events encountered everyday situations. As a spontaneous action for gathering social information, infants’ attention to others’ faces is expected to play an important role in the development of social cognition.
Method
▪Participants
Fifty-one 12-month-old infants and their mothers participated in a larger 3-year longitudinal study.
▪Procedure & Measures
原创国际学术会议海报(poster)模板(英文)
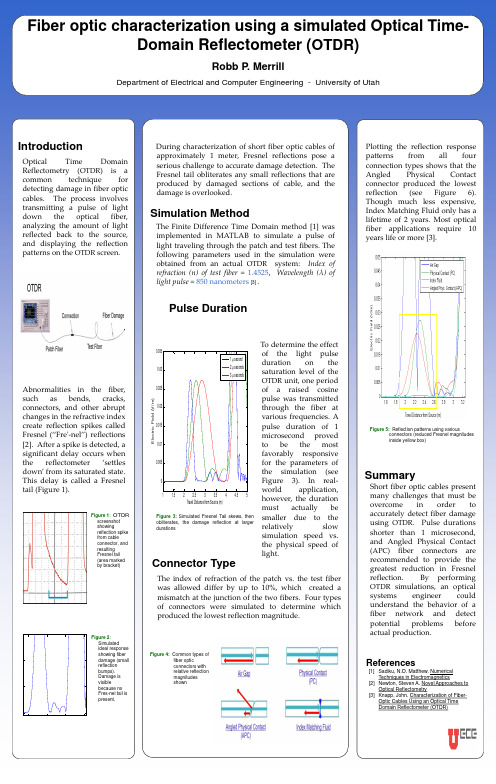
Plotting the reflection response patterns from all four connection types shows that the Angled Physical Contact connector produced the lowest reflection (see Figure 6). Though much less expensive, Index Matching Fluid only has a lifetime of 2 years. Most optical fiber applications require 10 years life or more [3].
Simulation Method
The Finite Difference Time Domain method [1] was implemented in MATLAB to simulate a pulse of light traveling through the patch and test fibers. The following parameters used in the simulation were obtained from an actual OTDR system: Index of refraction (n) of test fiber = 1.4525, Wavelength (λ) of light pulse = 850 nanometers [3] .
15
x 10
-3
Ideal Reflection Characteristics (No OTDR Saturation)
10
5
Figure 2: Simulated ideal response showing fiber damage (small reflection bumps). Damage is visible because no Fres-nel tail is present.
国际学术会议海报(poster)模板(英文)
Optical Time Domain Reflectometer (OTDR)
Pulse Duration
0.035 0.03
OTDR Saturation at Increased Pulse Durations
1 second 2 seconds 3 seconds
0.025
0.02
0.015
1
0.01
0.005
0
1
1.5
2
2.5
3
3.5
4
4.5
5
Travel Distance from Source (m)
Fiber optic characterization using a simulated Optical Time-Domain Reflectometer (OTDR)
Robb P. Merrill
Department of Electrical and Computer Engineering - University of Utah
Figure 5: Reflection patterns using various connectors (reduced Fresnel magnitudes inside yellow box)
Summary
Short fiber optic cables present many challenges that must be overcome in order to accurately detect fiber damage using OTDR. Pulse durations shorter than 1 microsecond, and Angled Physical Contact (APC) fiber connectors are recommended to provide the greatest reduction in Fresnel reflection. By performing OTDR simulations, an optical systems engineer could understand the behavior of a fiber network and detect potential problems before actual production.
国际会议学术交流壁报模板
Try not to make this box any wider than it is. You have room for 3 columns that are 13” wide. You need at least 1” of space between columns (Between this box and the yellow one). You should have at least ½ “ of space between each section within a column (Between this box and the green one.)
That you’ll really be able to see
And read them.
Acknowledgments
acknowledgments go here
Developed with funding from the Howard Hughes Medical Institute
Another figure or Graphic
Another figure or Graphic
Make your graphs big Enough so
That you’ll really be able to see
And read them.
Make your graphs big Enough so
Abstract
This may be the only part of your poster anybody actually reads in detail – so you might want to make the font larger than the other boxes. This is size 36, whereas the other text is
学术会议海报Poster模板1
Yyyyyyyyyyyyyyyyyyyyyyyyyyyyyyyyyyyyyyyyyyyyyyyyyyy yyyyyyyyyyyyyyyyyyyyyyyyyyyyyyyyyyyyyyyyyyyyyyyyyyyy yyyyyyyyyyyyyyyyyyyyyyyyyyyyyyyyyyyyyyyyyyyyyyyyyyyy yyyyYyyyyyyyyyyyyyyyyyyyyyyyyyyyyyyyyyyyyyyyyyyyyyy yyyyyyyyyyyyyyyyxxxxxxxxxxxxxxxxxxxxxxxxxxxxxxxxxxxx xxxxxxxxxxxxxxxxxxxxxxxxxxxxxxxxxxxxxxxxxxxxxxxxxxxx xxxxxxxxxxxxxxxxxxxxxxxxxxxxxxxxxxxxxxxxxxxxxxxxxxxx xxxxxxxxxxxxxxxxxxxxxxxxxxxxxxxxxxxxxxxxxxxxxxxxxxxx xxxxxxxxxxxxxxxxxxxxxxxxxxxxxxxxxxxxxxxxxxxxxxxxxxxx xxxxxxxxxxxxxxxxxxxxxxxxxxxxxxxxxxxxxxxxxxxxxxxxxxxx xxxxxxxxxxxxxxxxxxxxxxxxxx.
3. Xxxxxxxxxxxxxxxxxxxxxxxxxxxxxxxxxxxxxxxxxxxxxxxx xxxxxxxxxxxxxxxxxxxxxxxxxxxxxxxxxxxxxxxxxxxxxxxxx xxxxxxxxxxxxxxxxxxxxxx
4. Xxxxxxxxxxxxxxxxxxxxxxxxxxxxxxxxxxxxxxxxxxxxxxxx xxxxxxxxxxxxxxxxxxxxxxxxxxxxxxxxxxx
Figure #1
3. Xxxxxxxxxxxxxxxxxxxxxxxxxxxxxxxxxxxxxxxxxxxxxxxx xxxxxxxxxxxxxxxxxxxxxxxxxxxxxxxxxxxxxxxxxxxxxxxxx xxxxxxxxxxxxxxxxxxxxxx
4. Xxxxxxxxxxxxxxxxxxxxxxxxxxxxxxxxxxxxxxxxxxxxxxxx xxxxxxxxxxxxxxxxxxxxxxxxxxxxxxxxxxx
Figure #1
国际学术会议海报张贴模板 48x72 Horizontal
Results
Xxxxxxxxxxxxxxxxxxxxxxxxxxxxxxxxxxxxxxxxxxxxxxxxxxxxxxxx xxxxxxxxxxxxxxxxxxxxxxxxxxxxxxxxxxxxxxxxxxxxxxxxxxxxxxxx xxxxxxxxxxxxxxxxxxxxxxxxxxxxxxxxxxxxxxxxxxxxxxxxxxxxxxxx xxxxxxxxxxxxxxxxxxxxxxxxxxxxxxxxxxxxxxxxxxxxxxxxxxxxxxxx xxxxxxxxxxxxxxxxxxxxxxxxxxxxxxxxxxxxxxxxxxxxxxxxxxxxxxxx xxxxxxxxxxxxxxxxxxxxxxxxxxxxxxxxxxxxxxxxxxxxxxxxxxxxxxxx xxxxxxxxxxxxxxxxxxxxxxxxxxxxxxxxxxxxxxxxxxxxxxxxxxxxxxxx xxxxxxxxxxxxxxxxxxxxxxxxxxxxxxxxxxxxxxxxxxxxxxxxxxxxxxxx xxxxxxxxxxxxxxxxxxxxxxxxxxxxxxxxxxxxxxxxxxxxxxxxxxxxxxxx xxxxxxxxxxxxxxxxxxxxxxxxxxxx xxxxxxxxxxxxxxxxxxxxxxxxxxxxxxxxxxxxxxxxxxxxxxxxxxxxxxxx xxxxxxxxxxxxxxxxxxxxxxxxxxxxxxxxxxxxxxxxxxxxxxxxxxxxxxxx xxxxxxxxxxxxxxxxxxxxxxxxxxxxxxxxxxxxxxxxxxxxxxxxxxxxxxxx xxxxxxxxxxxxxxxxxxxxxxxxxxxxxxxxxxxxxxxxxxxxxxxxxxxxxxxx xxxxxxxxxxxxxxxxxxxxxxxxxxxxxxxxxxxxxxxxxxxxxxxxxxxxxxxx xxxxxxxxxxxxxxxxxxxxxxxxxxxxxxxxxxxxxxxxxxxxxxxxxxxxxxxx xxxxxxxxxxxxxxxxxxxxxxxxxxxxxxxxxxxxxxxxxxxxxxxxxxxxxxxx xxxxxxxxxxxxxxxxxxxxxxxxxxxxxxxxxxxxxxxxxxxxxxxxxxxxxxxx xxxxxxxxxxxxxxxxxxxxxxxxxxxxxxxxxxxxxxxxxxxxxxxxxxxxxxxx xxxxxxxxxxxxxxxxxxxxxxxxxx
- 1、下载文档前请自行甄别文档内容的完整性,平台不提供额外的编辑、内容补充、找答案等附加服务。
- 2、"仅部分预览"的文档,不可在线预览部分如存在完整性等问题,可反馈申请退款(可完整预览的文档不适用该条件!)。
- 3、如文档侵犯您的权益,请联系客服反馈,我们会尽快为您处理(人工客服工作时间:9:00-18:30)。
Conclusions
Xxxxxxxxxxxxxxxxxxxxxxxxxxxxxxxxxxxxxxxxxxxxxxxxxxxxxx xxxxxxxxxxxxxxxxxxxxxxxxxxxxxxxxxxxxxxxxxxxxxxxxxxxxxx xxxxxxxxxxxxxxxxxxxxxxxxxxxxxxxxxxxxxxxxxxxxxxxxxxxxxx xxxxxxxxxxxxxxxxxxxxxxxxxxxxxxxxxxxxxxxxxxxxxxxxxxxxxx xxxxxxxxxxxxxxxxxxxxxxxxxxxxxxxxxxxxxxxxxxxxxxxxxxxxxx xxxxxxxxxxxxxxxxxxxxxxxxxxxxxxxxxxxxxxxxxxxxxxxxxxxxxx xxxxxxxxxxxxxxxxxxxxxxxxxxxxxxxxxxxxxxxxxxxxxxxxxxxxxx xxxxxxxxxxxxxxxxxxxxxxxxxxxxxxxxxxxxxxxxxxxxxxxxxxxxxx xxxxxxxxxxxxxxxxxxxxxxxxxxxxxxxxxxxxxxxxxxxxxxxxxxxxxx xxxxxxxxxxxxxxxxxxxxxxxxxxxxxxxxxxxxxxxxxxxxxxx xxxxxxxxxxxxxxxxxxxxxxxxxxxxxxxxxxxxxxxxxxxxxxxxxxxxxx xxxxxxxxxxxxxxxxxxxxxxxxxxxxxxxxxxxxxxxxxxxxxxxxxxxxxx xxxxxxxxxxxxxxxxxxxxxxxxxxxxxxxxxxxxxxxxxxxxxxxxxxxxxx xxxxxxxxxxxxxxxxxxxxxxxxxxxxxxxxxxxxxxxxxxxxxxxxxxxxxx xxxxxxxxxxxxxxxxxxxxxxxxxxxxxxxxxxxxxxxxxxxxxxxxxxxxxx xxxxxxxxxxxxxxxxxxxxxxxxxxxxxxxxxxxxxxxxxxxxxxxxxxxxxx xxxxxxxxxxxxxxxxxxxxxxxxxxxxxxxxxxxxxxxxxxxxxxxxxxxxxx xxxxxxxxxxxxxxxxxxxxxxxxxxxxxxxxxxxxxxxxxxxxxxxxxxxxxx xxxxxxxxxxxxxxxxxxxxxxxxxxxxxxxxxxxxxxxxxxxxxxxxxxxxxx xxxxxxxxxxxxxxxxxxxxxxxxxxxxxxx
Methods
Xxxxxxxxxxxxxxxxxxxxxxxxxxxxxxxxxxxxxxxxxxxxxxxxxxxx xxxxxxxxxxxxxxxxxxxxxxxxxxxxxxxxxxxxxxxxxxxxxxxxxxxxx xxxxxxxxxxxxxxxxxxxxxxxxxxxxxxxxxxxxxxxxxxxxxxxxxxxxx xxxxxxxxxxxxxxxxxxxxxxxxxxxxxxxxxxxxxxxxxxxxxxxxxxxxx xxxxxxxxxxxxxxxxxxxxxxxxxxxxxxxxxxxxxxxxxxxxxxxxxxxxx xxxxxxxxxxxxxxxxxxxxxxxxxxxxxxxxxxxxxxxxxxxxxxxxxxxxx xxxxxxxxxxxxxxxxxxxxxxxxxxxxxxxxxxxxxxxxxxxxxxxxxxxxx xxxxxxxxxxxxxxxxxxxxxxxxxxxxxxxxxxxxxxxxxxxxxxxxxxxxx xxxxxxxxxxxxxxxxxxxxxxxxxxxxxxxxxxxxxxxxxxxxxxxXxxxx xxxxxxxxxxxxxxxxxxxxxxxxxxxxxxxxxxxxxxxxxxxxxxxxxxxxx xxxxx. Yyyyyyyyyyyyyyyyyyyyyyyyyyyyyyyyyyyyyyyyyyyyyyyyyyyy yyyyyyyyyyyyyyyyyyyyyyyyyyyyyyyyyyyyyyyyyyyyyyyyyyyyy yyyyyyyyyyyyyyyyyyyyyyyyyyyyyyyyyyyyyyyyyyyyyyyyyyyyy yYyyyyyyyyyyyyyyyyyyyyyyyyyyyyyyyyyyyyyyyyyyyyyyyyyy yyyyyyyyyyyyxxxxxxxxxxxxxxxxxxxxxxxxxxxxxxxxxxxxxxxxx xxxxxxxxxxxxxxxxxxxxxxxxxxxxxxxxxxxxxxxxxxxxxxxxxxxxx xxxxxxxxxxxxxxxxxxxxxxxxxxxxxxxxxxxxxxxxxxxxxxxxxxxxx xxxxxxxxxxxxxxxxxxxxxxxxxxxxxxxxxxxxxxxxxxxxxxxxxxxxx xxxxxxxxxxxxxxxxxxxxxxxxxxxxxxxxxxxxxxxxxxxxxxxxxxxxx xxxxxxxxxxxxxxxxxxxxxxxxxxxxxxxxxxxxxxxxxxxxxxxxxxxxx xxxResearch Study
PEOPLE WHO DID THE STUDY
UNIVERSITIES AND/OR HOSPITALS THEY ARE AFFILIATED WITH
Logo
Introduction
We hope you find this template useful! This one is set up to yield a 48x36” (4x3’) horizontal poster. We’ve put in the headings we usually see in these posters, you can copy and paste and change to your hearts content! We suggest you use keep black text against a light background so that it is easy to read. Background color can be changed in format-background-drop down menu. The boxes around the text will automatically fit the text you type, and if you click on the text, you can use the little handles that appear to stretch or squeeze the text boxes to whatever size you want. If you need just a little more room for your type, go to format-line spacing and reduce it to 90 or even 85%. The dotted lines through the center of the piece will not print, they are for alignment. You can move them around by clicking and holding them, and a little box will tell you where they are on the page. Use them to get your pictures or text boxes aligned together. How to bring things in from Excel® and Word® Excel- select the chart, hit edit-copy, and then edit-paste into PowerPoint®. The chart can then be stretched to fit as required. If you need to edit parts of the chart, it can be ungrouped. Watch out for scientific symbols used in imported charts, which PowerPoint will not recognize as a used font and may print improperly if we don’t have the font installed on our system. It is best to use the Symbol font for scientific characters. Word- select the text to be brought into PowerPoint, hit edit-copy, then edit-paste the text into a new or existing text block. This text is editable. You can change the size, color, etc. in format-text. We suggest you not put shadows on smaller text. Stick with Arial and Times New Roman fonts so your collaborators will have them. Scans We need images to be 72 to 100 dpi in their final size, or use a rule of thumb of 2 to 4 megabytes of uncompressed .tif file per square foot of image. For instance, a 3x5 photo that will be 6x10 in size on the final poster should be scanned at 200 dpi. We prefer that you import tif or jpg images into PowerPoint. Generally, if you double click on an image to open it in Microsoft Photo Editor, and it tells you the image is too large, then it is too large for PowerPoint to handle too. We find that images 1200x1600 pixels or smaller work very well. Very large images may show on your screen but PowerPoint cannot print them. Preview: To see your in poster in actual size, go to view-zoom100%. Posters to be printed at 200% need to be viewed at 200%.