原创国际学术会议海报(poster)模板(英文)
国际学术会议海报(poster)模板(英文)9
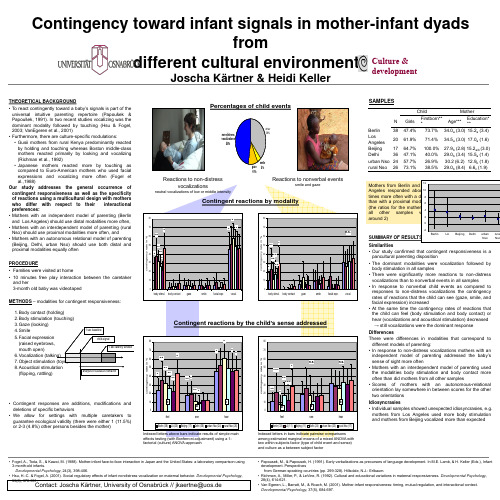
non-distress vocalizations 48%
other 38%
Berlin Los Angeles Beijing
38 20 17 36
gaze 10%
smile 4%
Delhi
Reactions to non-distress vocalizations
neutral vocalizations of low or middle intensity
Contingency toward infant signals in mother-infant dyads from Culture & different cultural environments development
Joscha Kärtner & Heidi Keller
Percentages of child events
SAMPLES
Child N Girls 47.4% 61.9% 64.7% 47.1% 57.7% Firstborn** * 73.7% 71.4% 100.0% 40.0% 26.9%
12
Mother Age*** 34.0a (3.0) 34.5a (3.0) 27.9b (2.8) 29.0b (3.4) 30.2 (6.2) 29.0b (8.4) Education* ** 15.2a (3.4) 17.0a (1.6) 15.2a/b (3.0) 15.5a (1.4) 12.9b (1.8) 6.6c (1.9)
THEORETICAL BACKGROUND • To react contingently toward a baby’s signals is part of the universal intuitive parenting repertoire (Papoušek & Papoušek, 1991). In two recent studies vocalizing was the dominant modality followed by touching (Hsu & Fogel, 2003; VanEgeren et al., 2001) • Furthermore, there are culture-specific modulations: • Gusii mothers from rural Kenya predominantly reacted by holding and touching whereas Boston middle-class mothers reacted primarily by looking and vocalizing (Richman et al., 1992) • Japanese mothers reacted more by touching as compared to Euro-American mothers who used facial expressions and vocalizing more often (Fogel et al.,1988) Our study addresses the general occurrence of contingent responsiveness as well as the specificity of reactions using a multicultural design with mothers who differ with respect to their interactional preferences: • Mothers with an independent model of parenting (Berlin and Los Angeles) should use distal modalities more often, • Mothers with an interdependent model of parenting (rural Nso) should use proximal modalities more often, and • Mothers with an autonomous relational model of parenting (Beijing, Delhi, urban Nso) should use both distal and proximal modalities equally often PROCEDURE • Families were visited at home • 10 minutes free play interaction between the caretaker and her 3-month old baby was videotaped METHODS – modalities for contingent responsiveness: 1.Body contact (holding) 2.Body stimulation (touching) 3.Gaze (looking) 4.Smile 5.Facial expression (raised eyebrows, mouth open) 6.Vocalization (talking) 7.Object stimulation (toys) 8.Acoustical stimulation (flipping, rattling)
优秀的学术会议海报模板

Caption for this graphic goes here.
2 Methods
Insert your text here. Change the font size to fit your text in the space.
Remember, you can adjust the font size to fit your text. Insert your text here. Remember, you can adjust the font size to fit your text.
7.Insert your text here. Change the font size to fit your text in the space.
8.Insert your text here. Change the font size to fit your text in the space. 9.Insert your text here. Change the font size to fit your text in the space. 10.Insert your text here. Change the font size to fit your text in the space.
1 Background
Insert your text here. Remember, you can adjust the font size to fit your text. Insert your text here. Move the text and graphics boxes to fit your individual needs. Insert your text here. Remember, you can adjust the font size to fit your text. Insert your text here. Remember, you can adjust the font size to fit your text. Insert your text here. Remember, you can adjust the font size to fit your text.
国际学术会议海报(poster)模板(英文)10

Method
▪Participants
Fifty-one 12-month-old infants and their mothers participated in a larger 3-year longitudinal study.
▪Procedure & Measures
At 12 months
Results
The quantity and quality of infants’ looking during interaction
▪ Twelve-month-olds were more likely to look at task objects than at their mother during teaching interactions.
▪ The infants who more frequent and longer look to mother’s face in the interaction showed high emotional recognition in toddlerhood.
▪Findings from this longitudinal study suggest that infants’ social looking to their mothers during interactions may provide an opportunity to explore and percept others’ emotions.
▪ However, longer looks to objects during social-oriented tasks were related to lower scores in recognizing highintensity emotions.
【学术会议poster模板】blueFade_36x48

Additional information here about the authors or the name of the conference
nibh, ultrices facilisis, dignissim at, mollis ut, diam. Nulla et magnis dis parturient
Purpose
Lorem ipsum dolor sit amet, consectetuer adipiscing elit. Nam in diam consectetuer odio blandit elementum.
Parturient disnissim Checklist • Proin spits sceleriae • Morbi setano malack • Magna mollis edu
Independent Study Modules • Partueint curabitur • Quidis porta soopa • Lingula consecutatar
faucibus sit amet, mollis eu, molestie a, erat. Donec magna
nibh, ultrices facilisis, dignissim at, mollis ut, diam. Nulla facilisi. Cum sociis natoque penatibus et magnis dis parturient
2nd Qtr
3rd Qtr
East West North
4th Qtr
Pre-program Medication Errors (Jan-Sep 2006; n=191)
原创国际学术会议海报(poster)模板(英文)

原创国际学术会议海报(poster)模板(英文)原创国际学术会议海报(poster)模板(英文)Fiber optic characterization using a simulated Optical TimeDomain Reflectometer (OTDR)Robb P. MerrillDepartment of Electrical and Computer Engineering - University of Utah IntroductionOptical Time Domain Reflectometry (OTDR) is a common technique for detecting damage in fiber optic cables. The process involves transmitting a pulse of light down the optical fiber, analyzing the amount of light reflected back to the source, and displaying the reflection patterns on the OTDR screen.During characterization of short fiber optic cables of approximately 1 meter, Fresnel reflections pose a serious challenge to accurate damage detection. The Fresnel tail obliterates any small reflections that are produced by damaged sections of cable, and the damage is overlooked.Simulation MethodThe Finite Difference Time Domain method [1] was implemented in MATLAB to simulate a pulse of light traveling through the patch and test fibers. The following parameters used in the simulation were obtained from an actual OTDR system: Index of refraction (n) of test fiber = 1.4525, Wavelength (λ) of light pulse = 850 nanometers [3] .Plotting the reflection response patterns from all four connection types shows that the Angled Physical Contact connector produced the lowest reflection (see Figure 6). Though much less expensive, Index Matching Fluid only has a lifetime of 2 years. Most optical fiber applications require 10 years life or more [3].Pulse DurationT o determine the effect of the light pulse duration on the saturation level of the OTDR unit, one period ofa raised cosine pulse was transmitted through the fiber at various frequencies. A pulse duration of 1 microsecond proved to be the most favorably responsive for the parameters of the simulation (see Figure 3). In realworld application, however, the duration must actually be smaller due to the relatively slow simulation speed vs. the physical speed of light.OTDR Saturation at Increased Pulse Durations 0.035 1 second 0.03 2 seconds 3 secondsAbnormalities in the fiber, such as bends, cracks, connectors, and other abrupt changes in the refractive index create reflection spikes called Fresnel ( Fre'-nel ) reflections [2]. After a spike is detected, a significant delay occurs when the reflectometer ‘settles down’ from its saturated state. This delay is called a Fresnel tail (Figure 1).Figure 1: OTDR screenshot showing reflection spike from cable connector, and resulting Fresnel tail (area marked by bracket)0.025Electric Field (V/m)0.020.01510.01Figure 5: Reflection patterns using various connectors (reduced Fresnel magnitudes inside yellow box)0.0050 1 1.5 2 2.5 3 3.5 4 Travel Distance from Source (m) 4.5 5SummaryShort fiber optic cables present many challenges that must be overcome in order to accurately detect fiber damage using OTDR. Pulse durations shorter than 1 microsecond, and Angled Physical Contact (APC) fiber connectors are recommended to provide the greatestreduction in Fresnel reflection. By performing OTDRsimulations, an optical systems engineer could understand the behavior of a fiber network and detect potential problems before actual production.Figure 3: Simulated Fresnel Tail skews, then obliterates, the damage reflection at larger durationsConnector TypeThe index of refraction of the patch vs. the test fiber was allowed differ by up to 10%, which created a mismatch at the junction of the two fibers. Four types of connectors were simulated to determine which produced the lowest reflection magnitude.15x 10-3Ideal Reflection Characteristics (No OTDR Saturation)105Figure 2: Simulated ideal response showing fiber damage (small reflection bumps). Damage is visible because no Fres-nel tail is present.Electric Field (V/m)Figure 4: Common types of fiber optic connectors with relative reflection magnitudes shownReferences[1] Sadiku, N.O. Matthew. Numerical Techniques in Electromagnetics [2] Newton, Steven A. Novel Approaches to Optical Reflectometry [3] Knapp, John. Characterization of FiberOptic Cables Using an Optical Time Domain Reflectometer (OTDR)0 2 2.5 3 Travel Distance from Source (m) 3.5Fiber optic characterization using a simulated Optical TimeDomain Reflectometer (OTDR)Robb P. MerrillDepartment ofElectrical and Computer Engineering - University of UtahIntroductionOptical Time Domain Reflectometry (OTDR) is a common technique for detecting damage in fiber optic cables. The process involves transmitting a pulse of light down the optical fiber, analyzing the amount of light reflected back to the source, and displaying the reflection patterns on the OTDR screen.During characterization of short fiber optic cables of approximately 1 meter, Fresnel reflections pose a serious challenge to accurate damage detection. The Fresnel tail obliterates any small reflections that are produced by damaged sections of cable, and the damage is overlooked.Simulation MethodThe Finite Difference Time Domain method [1] was implemented in MATLAB to simulate a pulse of light traveling through the patch and test fibers. The following parameters used in the simulation were obtained from an actual OTDR system: Index of refraction (n) of test fiber = 1.4525, Wavelength (λ) of light pulse = 850 nanometers [3] .Plotting the reflection response patterns from all four connection types shows that the Angled Physical Contact connector produced the lowest reflection (see Figure 6). Though much less expensive, Index Matching Fluid only has a lifetime of 2 years. Most optical fiber applications require 10 years life or more [3].Pulse DurationTo determine the effect of the light pulse duration on the saturation level of the OTDR unit, one period of a raised cosine pulse was transmitted through the fiber at various frequencies. A pulse duration of 1 microsecond proved to be the most favorably responsive for the parameters of the simulation (see Figure 3). In realworld application, however, the duration must actually be smaller due to the relatively slow simulation speed vs. the physical speed of light.OTDR Saturation at Increased Pulse Durations 0.035 1 second 0.03 2 seconds 3secondsAbnormalities in the fiber, such as bends, cracks, connectors, and other abrupt changes in the refractive index create reflection spikes called Fresnel ( Fre'-nel ) reflections [2]. After a spike is detected, a significant delay occurs when the reflectometer ‘settles down’ from its saturated state. This delay is called a Fresnel tail (Figure 1).Figure 1: OTDR screenshot showing reflection spike from cable connector, and resulting Fresnel tail (area marked by bracket)0.025Electric Field (V/m)0.020.01510.01Figure 5: Reflection patterns using various connectors (reduced Fresnel magnitudes inside yellow box)0.0050 1 1.5 2 2.5 3 3.5 4 Travel Distance from Source (m) 4.5 5SummaryShort fiber optic cables present many challenges that must be overcome in order to accurately detect fiber damage using OTDR. Pulse durations shorter than 1 microsecond, and Angled Physical Contact (APC) fiber connectors are recommended to provide the greatest。
poster海报模板
Table 1. Heading of the Table left justified. Do not use vertical lines within the table, use horizontal lines only to separate headings from table entries Xxxx Xxxx Xxx Xxxx Xxxxxx _________________________________________________________________ X X XXX XX X XX XXX XX X XX XXX X X XXX XXX XXXX XX X X X X XX XXX XX XXX XXXXX _________________________________________________________________
Paper ID:
Contact email:
(a) P rediction of chaotic time series
1.5 1 0.5 0 100 200 300 400 500 600 700 800 900 1000
Actual output
Model prediction
Fig. X. Title of figure, central justified
Others 2
•请按上述要求填写Poster模板,并转成PDF,提交给会务组。会务组将统一 打印、张贴。 •根据文章结构合理安排Poster内容,力求简练,清楚,最好分条目撰写, 避免大段落文字论述。 •请严格控制Poster版面内容(共一页),不足的地方请留白,切勿将引导文字 留在版面内。 •基金支持和作者信息请置于Poster底部。 •请严格按照上述模版格式排版,poster中所附的图和表的总数限制在5幅以 内。由于文字较多,无法按规定格式完成的,可做适当调整。 •Poster的PDF文档请统一于5.6前发至iswrep2011bqsc@
国际会议poster 模板
Notes about graphs…
For simple graphs use MS Excel, or do the graph directly in PowerPoint.
Graphs done in a scientific graphing programs (eg. Sigma Plot, Prism, SPSS, Statistica) should be saved as JPEG or TIFF if possible. For more information see MIU.
Printing and Laminating… Once you have completed your poster, bring it down to MIU for printing. We will produce a A3 size draft print for you to check and proof read. The final poster will then be printed and laminated. Note: Do not leave your poster until the last minute. Allow at least 5 working days before you need to use it. Simply highlight this text and replace.
The best type of image files to insert are JPEG or TIFF, JPEG is the preferred format.
Be aware of the image size you are importing. The average colour photo (13 x 18cm at 180dpi) would be about 3Mb (1Mb for B/W greyscale). Call MIU if unsure.
国际学术会议海报(poster)模板(英文)
Pulse Duration
0.035 0.03
OTDR Saturation at Increased Pulse Durations
1 second 2 seconds 3 seconds
0.025
0.02
0.015
1
0.01
0.005
0
1
1.5
2
2.5
3
3.5
4
4.5
5
Travel Distance from Source (m)
Fiber optic characterization using a simulated Optical Time-Domain Reflectometer (OTDR)
Robb P. Merrill
Department of Electrical and Computer Engineering - University of Utah
Figure 5: Reflection patterns using various connectors (reduced Fresnel magnitudes inside yellow box)
Summary
Short fiber optic cables present many challenges that must be overcome in order to accurately detect fiber damage using OTDR. Pulse durations shorter than 1 microsecond, and Angled Physical Contact (APC) fiber connectors are recommended to provide the greatest reduction in Fresnel reflection. By performing OTDR simulations, an optical systems engineer could understand the behavior of a fiber network and detect potential problems before actual production.
国际会议poster参考1
Doctors Technician Training Module
Natoque penatibus er Nulla facilisi Checklist ▪ A Morbi id ligula ▪ Magnis ▪ Cam sociia natoque ▪ Penatibus et magnis dis ▪ Montes, nascetur idiots ▪ Curabitur in metyus
faucibus sit amet, mollis eu, molestie a, erat. Donec magna
nibh, ultrices facilisis, dignissim at, mollis ut, diam. Nulla facilisi. Cum sociis natoque penatibus et magnis dis parturient
Insert Your Two Line Poster Title Here
Your Name Goes Here Your Institution Name Can Go Here
Introduction
Lorem ipsum dolor sit amet, consectetuer adipiscing elit. Nam in diam consectetuer odio blandit elementum.
nibh, ultrices facilisis, dignissim at, mollis ut, diam. Nulla facilisi. Cum sociis natoque penatibus et magnis dis parturient
montes, nascetur ridiculus mus. Morbi tristique erat at ligula. Curabitur in metus. Donec consequat. Quisque porta.
国际会议poster模板
Figure 1: Your caption to go here
Figure 2: Your caption to go here
Conclusion
Aliquam nec lacus eget sapien venenatis semper. Donec placerat. Phasellus bibendum semper ligula. Duis vitae massa. Integer suscipit. Donec non elit vel nunc tincidunt iaculis. Nam in urna. Pellentesque eu enim. Nam pellentesque libero nec velit. Aliquam quis sem. Nulla vestibulum vehicula arcu. Vestibulum feugiat eleifend elit. Proin condimentum molestie urna. Etiam ut diam. Quisque viverra lectus ac lectus. Donec ultrices, nisi nec mollis ultricies, quam diam aliquam enim, eu vulputate sem eger pede. Suspendisse lectus. Quisque nibh. Vestibulum ante ipsum primis in faucibus orci luctus et ultrices posuere cubilia Curae; Donec fringilla nunc quis quam. Curabitur quam. Suspendisse vitae libero venenatis mauris blandit volutpat. Class aptent taciti sociosqu ad litora torquent per conubia nostra, per inceptos hymenaeos. Duis consequat. Nunc tempus nonummy nulla. Duis congue scelerisque metus. Morbi vitae metus. Aliquam erat volutpat. Sed mattis odio vitae mi. Integer lectus augue, pretium ac, iaculis et, lacinia vel, orci. Pellentesque tempor tristique velit. Nullam elit ligula, rutrum sodales, ornare ornare, tristique sit amet, purus. Sed rutrum massa sit amet lectus. Pellentesque dapibus sem in ante. Maecenas vitae quam nec leo luctus congue. In at risus ac purus ornare auctor. Fusce vitae neque. Curabitur condimentum nulla. Mauris euismod turpis. Phasellus id risus. Etiam nibh odio, dignissim ut, tincidunt ut, viverra at, nisl. Vestibulum luctus eleifend odio. Duis porta, arcu ac ornare interdum, sapien nibh ultricies dolor, in venenatis justo orci vel est. Vestibulum ante ipsum primis in faucibus orci luctus et ultrices posuere cubilia Curae; Suspendisse sit amet turpis sed est dapibus porta. In augue. Nunc urna ligula, suscipit ac, varius at, rhoncus non, orci. Aenean ultricies, mauris ac rutrum viverra, nulla nisi luctus urna, mattis sagittis pede pede ut massa. Sed sapien dolor, fermentum eget, dignissim pulvinar, euismod eu, massa. Pellentesque luctus. Maecenas auctor tellus et nisl. Nulla sodales.
- 1、下载文档前请自行甄别文档内容的完整性,平台不提供额外的编辑、内容补充、找答案等附加服务。
- 2、"仅部分预览"的文档,不可在线预览部分如存在完整性等问题,可反馈申请退款(可完整预览的文档不适用该条件!)。
- 3、如文档侵犯您的权益,请联系客服反馈,我们会尽快为您处理(人工客服工作时间:9:00-18:30)。
Plotting the reflection response patterns from all four connection types shows that the Angled Physical Contact connector produced the lowest reflection (see Figure 6). Though much less expensive, Index Matching Fluid only has a lifetime of 2 years. Most optical fiber applications require 10 years life or more [3].
Simulation Method
The Finite Difference Time Domain method [1] was implemented in MATLAB to simulate a pulse of light traveling through the patch and test fibers. The following parameters used in the simulation were obtained from an actual OTDR system: Index of refraction (n) of test fiber = 1.4525, Wavelength (λ) of light pulse = 850 nanometers [3] .
15
x 10
-3
Ideal Reflection Characteristics (No OTDR Saturation)
10
5
Figure 2: Simulated ideal response showing fiber damage (small reflection bumps). Damage is visible because no Fres-nel tail is present.
OTDR Saturation at Increased Pulse Durations 0.035 1 second 0.03 2 seconds 3 seconds
Abnormalities in the fiber, such as bends, cracks, connectors, and other abrupt changes in the refractive index create reflection spikes called Fresnel (‚Fre'-nel‛) reflections [2]. After a spike is detected, a significant delay occurs when the reflectometer ‘settles down’ from its saturated state. This delay is called a Fresnel tail (Figure 1).
During characterization of short fiber optic cables of approximately 1 meter, Fresnel reflections pose a serious challenge to accurate damage detection. The Fresnel tail obliterates any small reflections that are produced by damaged sections of cable, and the damage is overlooked.
Introduction
Optical Time Domain Reflectometry (OTDR) is a common technique for detecting damage in fiber optic cables. The process involves transmitting a pulse of light down the optical fiber, analyzing the amount of light reflected back to the source, and displaying the reflection patterns on the OTDR screen.
Electric Field (V/m)
Figure 4: Common types of fiber optic connectors with relative reflection magnitudes shown
References
[1] Sadiku, N.O. Matthew. Numerical Techniques in Electromagnetics [2] Newton, Steven A. Novel Approaches to Optical Reflectometry [3] Knapp, John. Characterization of FiberOptic Cables Using an Optical Time Domain Reflectometer (OTDR)
Summary
Short fiber optic cables present many challenges that must be overcome in order to accurately detect fiber damage using OTDR. Pulse durations shorter than 1 microsecond, and Angled Physical Contact (APC) fiber connectors are recommended to provide the greatest reduction in Fresnel reflection. By performing OTDR simulations, an optical systems engineer could understand the behavior of a fiber network and detect potential problems before actual production.
Figure 1: OTDR screenshot showing reflection spike from cable connector, and resulting Fresnel tail (area marked by bracket)
0.025
Electric Field (V/m)
0.02
0 2 2.5 3 Travel Distance from Source (m) 3.5
Pulse Duration
To determine the effect of the light pulse duration on the saturation level of the OTDR unit, one period of a raised cosine pulse was transmitted through the fiber at various frequencies. A pulse duration of 1 microsecond proved to be the most favorably responsive for the parameters of the simulation (see Figure 3). In realworld application, however, the duration must actually be smaller due to the relatively slow simulation speed vs. the physical speed of light.
0.015
1
0.01
Figure 5: Reflection patterns using various connectors (reduced Fresnel magnitudes inside yellow box)
0.005
0 1 1.5 2 2.5 3 3.5 4 Travel Distance from Source (m) 4.5 5
Figure 3: Simulated Fresnel Tail skews, then obliterates, the damage reflection at larger durations
Connector Type
The index of refraction of the patch vs. the test fiber was allowed differ by up to 10%, which created a mismatch at the junction of the two fibers. Four types of connectors were simulated to determine which produced the lowest reflection magnitude.
Fiber optic characterization using a simulated Optical TimeDomain Reflectometer (OTDR)
Robb P. Merrill
Department of Electrical and Computer Engineering - University of Utah