国际学术会议海报(poster)模板
合集下载
学术poster海报模板3
Methods
You can use PowerPoint’s SmartArt to create flow charts and other types of diagrams.
1. Insert SmartArt 2. Select a diagram appropriate for your needs 3. Use the “insert text” box to label and add to your
❖Minimize the amount of text (hint: this template probably has too much text for an effective, eyecatching poster)! ❖ Be precise & succinct ❖ Use bullet points ❖ Where possible use diagrams or symbols ❖ ALL text should be large enough to read from several feet away- even figure captions!
Column 2
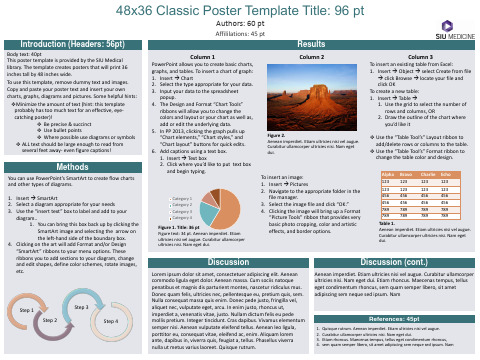
Figure 2.
Aenean imperdiet. Etiam ultricies nisi vel augue. Curabitur ullamcorper ultricies nisi. Nam eget dui.
To insert an image: 1. Insert Pictures 2. Navigate to the appropriate folder in the
To use this template, remove dummy text and images. Copy and paste your poster text and insert your own charts, graphs, diagrams and pictures. Some helpful hints:
You can use PowerPoint’s SmartArt to create flow charts and other types of diagrams.
1. Insert SmartArt 2. Select a diagram appropriate for your needs 3. Use the “insert text” box to label and add to your
❖Minimize the amount of text (hint: this template probably has too much text for an effective, eyecatching poster)! ❖ Be precise & succinct ❖ Use bullet points ❖ Where possible use diagrams or symbols ❖ ALL text should be large enough to read from several feet away- even figure captions!
Column 2
Figure 2.
Aenean imperdiet. Etiam ultricies nisi vel augue. Curabitur ullamcorper ultricies nisi. Nam eget dui.
To insert an image: 1. Insert Pictures 2. Navigate to the appropriate folder in the
To use this template, remove dummy text and images. Copy and paste your poster text and insert your own charts, graphs, diagrams and pictures. Some helpful hints:
国际学术会议海报(poster)模板(英文)9
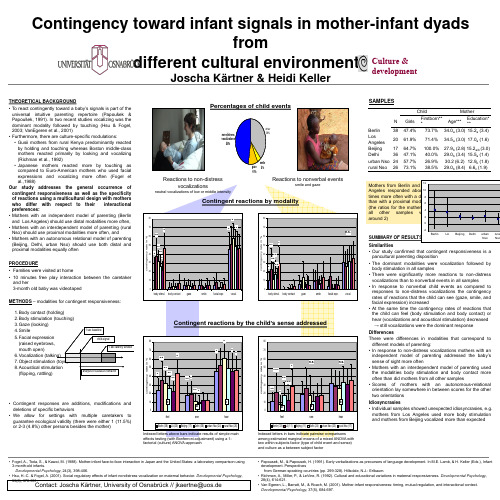
non-distress vocalizations 48%
other 38%
Berlin Los Angeles Beijing
38 20 17 36
gaze 10%
smile 4%
Delhi
Reactions to non-distress vocalizations
neutral vocalizations of low or middle intensity
Contingency toward infant signals in mother-infant dyads from Culture & different cultural environments development
Joscha Kärtner & Heidi Keller
Percentages of child events
SAMPLES
Child N Girls 47.4% 61.9% 64.7% 47.1% 57.7% Firstborn** * 73.7% 71.4% 100.0% 40.0% 26.9%
12
Mother Age*** 34.0a (3.0) 34.5a (3.0) 27.9b (2.8) 29.0b (3.4) 30.2 (6.2) 29.0b (8.4) Education* ** 15.2a (3.4) 17.0a (1.6) 15.2a/b (3.0) 15.5a (1.4) 12.9b (1.8) 6.6c (1.9)
THEORETICAL BACKGROUND • To react contingently toward a baby’s signals is part of the universal intuitive parenting repertoire (Papoušek & Papoušek, 1991). In two recent studies vocalizing was the dominant modality followed by touching (Hsu & Fogel, 2003; VanEgeren et al., 2001) • Furthermore, there are culture-specific modulations: • Gusii mothers from rural Kenya predominantly reacted by holding and touching whereas Boston middle-class mothers reacted primarily by looking and vocalizing (Richman et al., 1992) • Japanese mothers reacted more by touching as compared to Euro-American mothers who used facial expressions and vocalizing more often (Fogel et al.,1988) Our study addresses the general occurrence of contingent responsiveness as well as the specificity of reactions using a multicultural design with mothers who differ with respect to their interactional preferences: • Mothers with an independent model of parenting (Berlin and Los Angeles) should use distal modalities more often, • Mothers with an interdependent model of parenting (rural Nso) should use proximal modalities more often, and • Mothers with an autonomous relational model of parenting (Beijing, Delhi, urban Nso) should use both distal and proximal modalities equally often PROCEDURE • Families were visited at home • 10 minutes free play interaction between the caretaker and her 3-month old baby was videotaped METHODS – modalities for contingent responsiveness: 1.Body contact (holding) 2.Body stimulation (touching) 3.Gaze (looking) 4.Smile 5.Facial expression (raised eyebrows, mouth open) 6.Vocalization (talking) 7.Object stimulation (toys) 8.Acoustical stimulation (flipping, rattling)
国际学术会议海报张贴模板 36x60_ Vertical

Scans
We need images to be 72 to 100 dpi in their final size, or use a rule of thumb of 2 to 4 megabytes of uncompressed .tif file per square foot of image. For instance, a 3x5 photo that will be 6x10 in size on the final poster should be scanned at 200 dpi.
xxxxxxxxxxxxxxxxxxxxxxxxxxxxxxxxxxxxxxxxxxxxxxxxxxxxxxxxxxxxxx xxxxxxxxxxxxxxxxxxxxxxxxxxxxxxxxxxxxxxxxxxxxxxxxxxxxxxxxxxxxxx xxxxxxxxxxxxxxxxxxxxxxxxxxxxxxxxxxxxxxxxxxxxxxxxxxxxxxxxxxxxxx xxxxxxxxxxxxxxxxxxxxxxxxxxxxxxxxxxxxxxxxxxxxxxxxxxxxxxxxxxxxxx xxxxxxxxxxxxxxxxxxxxxxxxxxxxxxxxxxxxxxxxxxxxxxxxxxxxxxxxxxxxxx xxxxxxxxxxxxxxxxxxxxxxxxxxxxxxxxxxxxxxxxxxxxxxxxxxxxxxxxxxxxxx xxxxxxxxxxxxxxxxxxxxxxxxxxxxxxxxxxxxxxxxxxxxxxxxxxxxxxxxxxxxxx xxxxxxxxxxxxxxxxxxxxxxxxxxxxxxxxxxxxxxxxxxxxxxxxxxxxxxxxxxxxxx xxxxxxxxxxxxxxxxxxxxxxxxxxxxxxxxxx
学术海报模版ppt Poster
paper size (46.8” high by 33.1” wide) but prints can
be scaled up or down in size to any dimension with
the same aspect ratio. For example, if you order an
Microsoft® design the software and we created all
of the original color themes, templates, and clip art
galleries. We know how to make your printed
poster look just like it does on screen. Other
and altered s. We know the secrets to avoid
those issues. So choose Genigraphics for the most
accurate reproduction available.
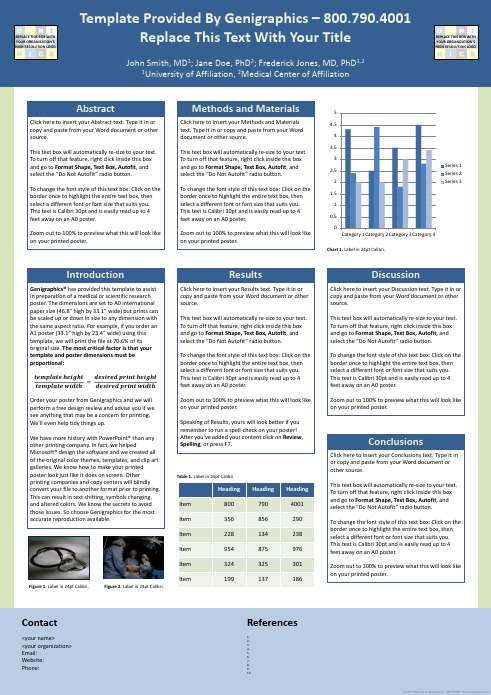
Figure 1. Label in 24pt Calibri.
2.5
Series 2
2
To change the font style of this text box: Click on the
border once to highlight the entire text box, then
select a different font or font size that suits you.
<your organization>
Email:
Website:
be scaled up or down in size to any dimension with
the same aspect ratio. For example, if you order an
Microsoft® design the software and we created all
of the original color themes, templates, and clip art
galleries. We know how to make your printed
poster look just like it does on screen. Other
and altered s. We know the secrets to avoid
those issues. So choose Genigraphics for the most
accurate reproduction available.
Figure 1. Label in 24pt Calibri.
2.5
Series 2
2
To change the font style of this text box: Click on the
border once to highlight the entire text box, then
select a different font or font size that suits you.
<your organization>
Email:
Website:
国际学术会议海报模板24-academic conference poster model
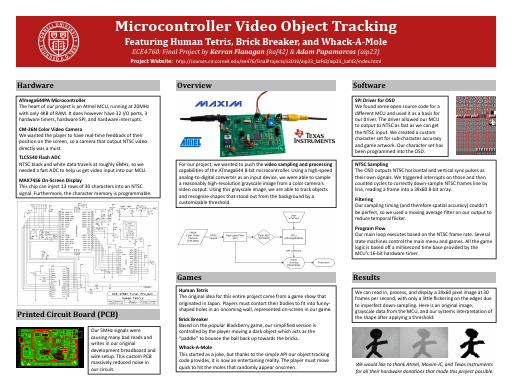
Filtering Our sampling timing (and therefore spatial accuracy) couldn’t be perfect, so we used a moving average filter on our output to reduce temporal flicker.
NTSC Sampling The OSD outputs NTSC horizontal and vertical sync pulses as their own signals. We triggered interrupts on those and then counted cycles to correctly down-sample NTSC frames line by line, reading a frame into a 39x60 8-bit array.
CM-26N Color Video Camera We wanted the player to have real-time feedback of their position on the screen, so a camera that output NTSC video directly was a must.
Program Flow Our main loop executes based on the NTSC frame rate. Several state machines control the main menu and games. All the game logic is based off a millisecond time base provided by the MCU’s 16-bit hardware timer.
国际学术会议海报张贴模板 36x72 Horizontal
Logo
Title of the Research Study
PEOPLE WHO DID THE STUDY
UNIVERSITIES AND/OR HOSPITALS THEY ARE AFFILIATED WITH
Logo
Introduction
We hope you find this template useful! This one is set up to yield a 36x72” (3x6’) horizontal poster when we print it at 200%. We’ve put in the headings we usually see in these posters, you can copy and paste and change to your hearts content! We suggest you use keep black text against a light background so that it is easy to read. Background color can be changed in formatbackground-drop down menu. The boxes around the text will automatically fit the text you type, and if you click on the text, you can use the little handles that appear to stretch or squeeze the text boxes to whatever size you want. If you need just a little more room for your type, go to formatline spacing and reduce it to 90 or even 85%. The dotted lines through the center of the piece will not print, they are for alignment. You can move them around by clicking and holding them, and a little box will tell you where they are on the page. Use them to get your pictures or text boxes aligned together. How to bring things in from Excel® and Word® Excel- select the chart, hit edit-copy, and then edit-paste into PowerPoint®. The chart can then be stretched to fit as required. If you need to edit parts of the chart, it can be ungrouped. Watch out for scientific symbols used in imported charts, which PowerPoint will not recognize as a used font and may print improperly if we don’t have the font installed on our system. It is best to use the Symbol font for scientific characters. Word- select the text to be brought into PowerPoint, hit edit-copy, then edit-paste the text into a new or existing text block. This text is editable. You can change the size, color, etc. in format-text. We suggest you not put shadows on smaller text. Stick with Arial and Times New Roman fonts so your collaborators will have them. Scans We need images to be 72 to 100 dpi in their final size, or use a rule of thumb of 2 to 4 megabytes of uncompressed .tif file per square foot of image. For instance, a 3x5 photo that will be 6x10 in size on the final poster should be scanned at 200 dpi. We prefer that you import tif or jpg images into PowerPoint. Generally, if you double click on an image to open it in Microsoft Photo Editor, and it tells you the image is too large, then it is too large for PowerPoint to handle too. We find that images 1200x1600 pixels or smaller work very well. Very large images may show on your screen but PowerPoint cannot print them. Preview: To see your in poster in actual size, go to view-zoom-100%. Posters to be printed at 200% need to be viewed at 200%. Feedback: If you have comments about how this template worked for you, email to sales@.
国际学术会议海报(poster)模板(英文)10

Method
▪Participants
Fifty-one 12-month-old infants and their mothers participated in a larger 3-year longitudinal study.
▪Procedure & Measures
At 12 months
Results
The quantity and quality of infants’ looking during interaction
▪ Twelve-month-olds were more likely to look at task objects than at their mother during teaching interactions.
▪ The infants who more frequent and longer look to mother’s face in the interaction showed high emotional recognition in toddlerhood.
▪Findings from this longitudinal study suggest that infants’ social looking to their mothers during interactions may provide an opportunity to explore and percept others’ emotions.
▪ However, longer looks to objects during social-oriented tasks were related to lower scores in recognizing highintensity emotions.
国际学术会议海报张贴模板 36x84 Horizontal
The dotted lines through the center of the piece will not print, they are for alignment. You can move them around by clicking and holding them, and a little box will tell you where they are on the page. Use them to get your pictures or text boxes aligned together. How to bring things in from Excel® and Word® Excel- select the chart, hit edit-copy, and then edit-paste into PowerPoint®. The chart can then be stretched to fit as required. If you need to edit parts of the chart, it can be ungrouped. Watch out for scientific symbols used in imported charts, which PowerPoint will not recognize as a used font and may print improperly if we don’t have the font installed on our system. It is best to use the Symbol font for scientific characters. Word- select the text to be brought into PowerPoint, hit edit-copy, then edit-paste the text into a new or existing text block. This text is editable. You can change the size, color, etc. in format-text. We suggest you not put shadows on smaller text. Stick with Arial and Times New Roman fonts so your collaborators will have them. Scans We need images to be 72 to 100 dpi in their final size, or use a rule of thumb of 2 to 4 megabytes of uncompressed .tif file per square foot of image. For instance, a 3x5 photo that will be 6x10 in size on the final poster should be scanned at 200 dpi. We prefer that you import tif or jpg images into PowerPoint. Generally, if you double click on an image to open it in Microsoft Photo Editor, and it tells you the image is too large, then it is too large for PowerPoint to handle too. We find that images 1200x1600 pixels or smaller work very well. Very large images may show on your screen but PowerPoint cannot print them. Preview: To see your in poster in actual size, go to view-zoom-100%. Posters to be printed at 200% need to be viewed at 200%. Feedback: If you have comments about how this template worked for you, email to sales@. We listen! Call us at 800-590-7850 if we can help in any way.