最新雅思图表作文常用词汇
雅思图表描述必备表达

Graph Description 图表描述:表示程度的副词:1. 程度较大:considerably,dramatically,greatly,markedly,obviously,quickly,rapidly,sharply,significantly,suddenly 2. 程度较小:slightly,gradually,slowly,steadily时间的嵌入in,from……to……,between…….and……,during……and……at the start of ……,by the end of ……,at the end of ……throughout ……上升1. 对于上升趋势的描述:可以使用的动词或动词词组:to increase,to go up,to rise,to grow,to shoot,to pick up可以使用的名词:an increase,a growth,a jump,an upward trend2. 对于上升到某个位置的描述:动词+reaching + 具数据。
to peak at +具体数据to climb to + 具体数据3. 对于上升的程度的描述:动词+by +具体数据动词+副词。
下降1. 对于下降趋势的描述:可以使用的动词或动词词组:to fall,to decrease,to go down,to decline,to drop可以使用的名词:a decrease,a fall,a decline,a drop2. 对于下降到某个位置的描述:动词+to+具体数据动词+reaching the bottom of +具体数据动词+reaching + 具体数据。
3. 对于下降程度的描述:动词+by +具体数据用1. a. 中的动词+副词。
对于平稳的趋势的描述:可以使用的动词或动词词组:to hardly change,to keep steady,to level off,to stay the same上升和下降趋势的组合描述(嵌入了时间和程度之后):1. 先上升后下降的句型:...... increased slowly during…… and ……, but fell sharply in …….A steady fall in …… during …… and ……,followed the sharp increase in …….2. 先下降后上升的句型:…… fell before …… began to make a recovery ………… continue the recovery, climbing to ………… dropped during …… but increased again in ………… fell and then pick up during ………… collapsed before rising to ……at the end of ……3. 起伏波动的句型:…… fluctuated sharply all through ……4. 波动不大的句型:…… hardly changed through the period between ……and……对于百分比进行描述所使用的句型:…… accounts for ……% of the total…… takes up ……% in the whole chart趋势的比较1. 表示相似的句型:Both share prices rose sharply in January.Neither company has made a profit yet.Like X, Y fell in June.X rose just as sharply as Y.2. 表示差异的句型:X fell sharply whereas/while Y remained steady.X fell quickly compared to Y.Unlike Y, X rose by 10%.X rose far more dramatically than Y.3. 表示倍数的句型:the …… doubled/tripled in …… compared with those in ……数据的修饰1. 表示不足的词或词组:a lmost,nearly表示超过的词或词组:over,more than3. 表示大约的词:around,approximatelyExamples:Practice 1. The following graph shows the USA and European unemployment rates. Look at the curve for European men and prepare a short description using the approximations listed below: just over, approximately, roughly, well over.Model versionIn 1982, the unemployment rate for men in Europe stood at just over five percent of the Labor Force. By 1991 it was still approximately f ive percent, having been roughly stable throughout the period.Nevertheless, the unemployment rate for. European men can be seen to be well over that recorded for USA men, almost three percent highe r in the period 1988 to 1990.Practice 2 Use the graph below to give a short presentation on European consumer price changes in the five major countries between 1988 and 1991.Model versionThis morning Fm going to talk briefly about consumer price changes in five major countries during the period 1988 to 1991.Let's look at 'the United States figures. As you can see, the annual change in consumer prices rose from around 4% in 1988 to just under 6% in 1990, before falling back to around 3% in 1991.Throughout this period, the United States had the second highest rate of inflation of the five countries considered.Now, turning to France, we can see that consumer prices rose less quickly than those in Britain and the United States throughout this period. Inflation r ose to over 3% i n 1989 and 1990, before falling back to just over 2% in 1991. Indeed by 1991, the inflation rate in France had fallen below that in Germany and was now equal to that in Japan.Practice 3 The graph below shows sales of a child's bicycle called the DBM. Using the information from the graph to write a brief report on the trends of the sales since the launch of the DBM in 1985.Model versionThe DBM bicycle was launched in 1985 and sales rose steadily over the following two year period, reaching a total of 40,000 units in 1987. Over the next 12 months sales fluctuated considerably, reaching a peak of around 50,000 units at the end of 1988. After that,the sales dropped dramatically, falling to just below 20,000 at the end of '89. A further drop was sustained over the following months, but after that the situation picked up and the sales increased quite sharply.Practice 4: Describe the following graph using these words: after that, subsequently, afterwards.Model versionThe 2B3 was launched in 1986, and by 1987 sales had risen to just under 10,000. After that, sales rose quite sharply. At the end of 1987 they peaked momentarily at30,000, before dropping slightly at the beginning of 1988. However, afterwards they picked up again and rose quite spectacularly until leveling out at about 55,000 at the end of 1989.。
雅思小作文饼图常用词汇、万能句型、范文整理
雅思小作文饼图常用词汇、万能句型、范文整理一、饼图常用词汇1.占比词汇-account for:占据-constitute:构成-make up:组成-represent:代表-comprise:包括-occupy:占有-consist of:由……组成2.描述数据词汇-significant:显著的-considerable:相当大的-minor:较小的-negligible:可以忽略的-substantial:大量的-slight:轻微的-moderate:适度的3.比较词汇-similar:相似的-different:不同的-compare with:与……相比1-in contrast to:与……形成对比-while:然而-whereas:然而-on the other hand:另一方面4.其他常用词汇-proportion:比例-segment:部分-percentage:百分比-distribution:分布-category:类别-sector:扇形二、饼图万能句型1.开头句型-The pie chart illustrates the proportion of categories in a specific field.-The pie chart provides information about the distribution of various segments.-The pie chart depicts the percentage of different categories in a given context.2.数据描述句型-Category A accounts for a significant proportion of the total, reaching XX%.-XX%of the total is occupied by CategoryB.emiring it the largest segment.2-Category C constitutes a considerable part, comprising XX%of the pie chart.-The proportion of Category D is relatively minor, only accounting for XX%.3.比较句型-In comparison with Category A, Category B has a higher percentage of XX%.-While Category A occupies XX%,Category B represents a larger proportion of XX%.-The distribution of Category C is similar to that of Category D, both comprising XX%.-In contrast to Category A, the percentage of Category B is significantly lower, at XX%.4.总结句型-Overall, the pie chart reveals a clear distribution of categories in the given field.-In summary, the majority of the pie chart is occupied by Category A, followed by Category B.-It can be concluded that Category C and Category D play minor roles in the overall distribution.三、实战演练题目:The pie chart below shows the main reasons for traffic accidents in a particular area. Summarise the3information by selecting and reporting the main features, and make comparisons where relevant.答案:The pie chart illustrates the main reasons for traffic accidents in a specific area. Upon analysis, several key points can be identified.First and foremost, the largest proportion of traffic accidents is caused by driver error, accounting for 45%of the total. This is followed by poor weather conditions, which constitute 25%of the accidents. Vehicle defects and road conditions each occupy 10%of the pie chart, while the remaining 10%is attributed to other factors.In comparison, driver error is the most significant factor, nearly doubling the percentage of poor weather conditions. Meanwhile, vehicle defects and road conditions share the same proportion, both comprising a minor part of the total.Overall, the pie chart reveals that driver error is the primary cause of traffic accidents in the given area, with poor weather conditions being the second most common factor. Other factors, such as vehicle defects and road conditions, play relatively minor roles in the overall distribution.4。
(完整版)雅思小作文必背词汇
meanwhile
at the same time
minimally
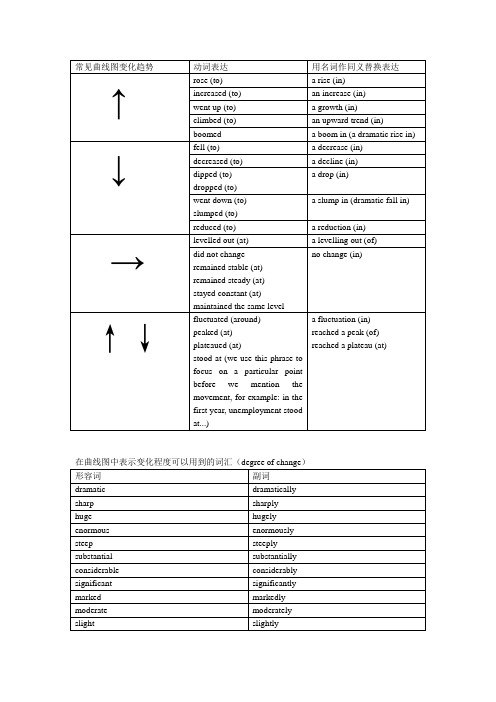
在曲线图中表示变化程度可以用到的词汇(speed of change)
形容词
副词
rapid
rapidly
quick
quickly
swift
swiftly
sudden
suddenly
steady
steadily
gradual
gradually
slow
slowly
描述扇形图常用句
The highest
常见曲线图变化趋势
动词表达
用名词作同义替换表达
↑
rose (to)
a rise (in)
increased (to)
an increase (in)
went up (to)
a growth (in)
climbed (to)
an upward trend (in)
boomed
a boom in (a dramatic rise in)
no change (in)
↑↓
fluctuated (around)
peaked (at)
plateaued (at)
stood at (we use this phrase to focus on a particular point before we mention the movement, for example: in the first year, unemployment stood at...)
a reduction (in)
→
levelled out (at)
雅思写作图表相关词汇整理从此描述图表不再词穷

雅思写作图表相关词汇整理从此描述图表不再词穷图表型的雅思写作其实并不是很难,但是很多考生在描述图标的时候会感到词穷,这是因为考生没有对这一类的词汇做好分类记忆。
下面,小编为大家整理了一些雅思写作图表题相关词汇,让大家在描述图表的时候不再词穷。
数据相关:一般:have 10%;at 10%; over 10%最高点:peaked;reached a peak / high point最低点:bottomedout; reached the bottom图表变化:rapid/rapidly 迅速的,飞快的,险峻的dramatic/dramatically 戏剧性的,生动的significant/significantly 有意义的,重大的,重要的sharp/sharply 锐利的,明显的,急剧的remained steady/stable; stay the same; little/hardly any /no change变化程度:sudden/suddenly 突然的,意外的steep/steeply 急剧升降的steady/steadily 稳固的,坚定不移的gradual/gradually 渐进的,逐渐的slow/slowly 缓慢的,不活跃的slight/slightly轻微的、略微地stable/stably 稳定的recover 略有回升; increase; jump; rise/rose; climbdecrease; fall/fell; drop; decline; reducefluctuate 浮动,摇摆不定范围相关:From… to …;between … and …;for... to …图表内容:figure;statistic;number;percentage;proportion图表类型:graph;column chart;pie graphtable;chart;diagram;图表描述:show;describe;illustrate;can be seen from;clear; apparent;reveal;represent以上就是小编为大家整理的雅思写作图表题相关词汇,希望考生们能对这些词汇活学活用,让自己的雅思写作不再单一乏味。
最新雅思考试图表作文

图表作文模板
• This is a _____chart, which demonstrates the number of_____ from ____ to ____. 如果两个图,则: There are two charts below. The _____ chart describes the number of _____, and the _____ chart illustrates the figure of ____. • 第二句:(所有题目适用),From the chart we can see that the number of ______ varies constantly/ greatly in _____. • Para 2, As we can see from the chart,/or It is clear from the chart that ____. • 如果有两个图:则:the _____ chart shows that ______./or As we can see from the first chart, _______ • Para 3, (如果两个图的话,) It is clear from the second chart that … • Para 4 结尾:From the figures/statistics above, we can see/conclude/draw a conclusion that …
•
11.As is shown in the table...如表格所示...
•
•
12.As can be seen from the diagram, great changes have taken place in... 从图中可以看出,...发生了巨大变化。
雅思图表题必背短语及词汇

图表题必背短语及词汇开头段改写原题,替换1.Show/ compare/ illustrate2.Proportion/ percentage3.Categories/kinds/types4.The UK/Britain/the United Kingdomrmation/data注意data不能加s6.Males/men females/women7.From年代to年代/between年代and年代/over a period of …years8.Subway system/underground railway system/underground train system9.Store/shop10.The number of+可数名词复数形式/the figure for+可数名词复数形式11.The amount of something+不可数名词/ the figure for+不可数名词主体段上升: go up / increase/rise/grow/show an upward trend/show a downward trend下降: decline/fall/drop/decrease/fall back to 回落到……/fell steadily平稳的下降从...上升或者下降...的介词搭配from…to…/by表幅度波动:fluctuate没有被动形式常见搭配:fluctuate between…and…表示稳定某一水平的短语:remain stable at/level off at后面都要跟具体的数字或百分比经历了某种变化的及物动词:see/experience/witness只要图里存在着时间上的跨度就一定能够用的上例如:see an opposite trend呈现出相反的趋势/experience a sharp rise from到达最高点:peak at/reach its peak at介绍趋势时表示达到...或者位于...的动词:reach达到/stand at位于表示占多少份额的动词:account for/make up/represent/constitute表示对将来预测的动词:expect/predict/project这三个词经常以被动形式出现.而且,尽管是描述未来的数字,be动词仍然用一般现在时be expected to表示变成原来数值的两倍或者三倍的词:double/increase twofold/triple三倍全都是及物动词,但要注意的这几个词都是表达同一个事物在不同时间的倍数关系表示是另一个事物的两倍或者三倍的表达:be twice as high/long/fast/popular asBe three times as……as表示始终高于或者始终低于的句型:be consistently higher/lower than表示原有差距变小或者变大的句型:the gapbetween …and…narrowsnarrowed/widenswidened表示原来少于但后来超过的及物动词:exceed后边跟阿拉伯数字或者百分数Overtake 过去式overtook,后面跟比较对象表示急剧的形容词sharply/rapidly/dramatically表示持续的形容词gradually/consistently/steadysteadily表示显着的.大幅度的形容词:significantly/noticeable去e加ly/considerable去e加ly表示很小幅度的词:slightly表示大约的副词或短语:about/around/approximately/just over/under表示分别得副词:respectively各自的,分别得主体段第一句开头由图可见的写法:it’s clear from the table/graph that等We can see from the….It can be seen from ….The table shows that…流程图词汇At the first stage of the process,…/ first, ../first of all /the process begins with the+名词或者名词短语,不能写主卫结构After this/after that/next/at the following stage of the processThenFinally/eventually。
(完整版)雅思小作文常用词汇和套句汇总
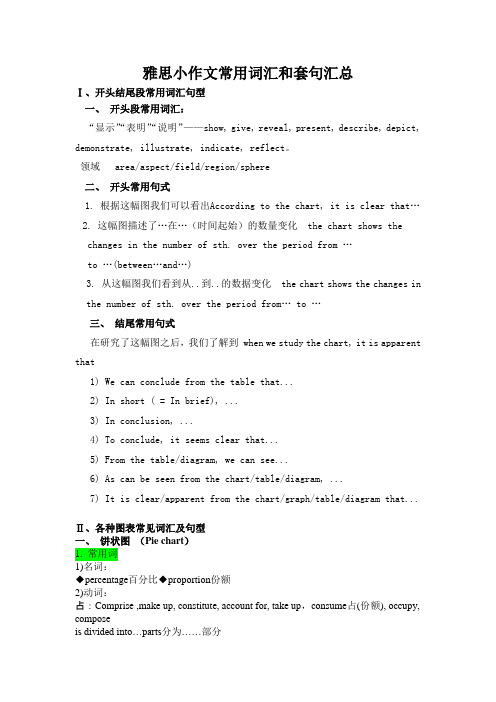
雅思小作文常用词汇和套句汇总Ⅰ、开头结尾段常用词汇句型一、开头段常用词汇:“显示”“表明”“说明”——show, give, reveal, present, describe, depict, demonstrate, illustrate, indicate, reflect。
领域 area/aspect/field/region/sphere二、开头常用句式1. 根据这幅图我们可以看出According to the chart, it is clear that…2. 这幅图描述了…在…(时间起始)的数量变化 the chart shows thechanges in the number of sth. over the period from …to …(between…and…)3. 从这幅图我们看到从..到..的数据变化 the chart shows the changes inthe number of sth. over the period from… to …三、结尾常用句式在研究了这幅图之后,我们了解到 when we study the chart, it is apparent that1) We can conclude from the table that...2) In short ( = In brief), ...3) In conclusion, ...4) To conclude, it seems clear that...5) From the table/diagram, we can see...6) As can be seen from the chart/table/diagram, ...7) It is clear/apparent from the chart/graph/table/diagram that...Ⅱ、各种图表常见词汇及句型一、饼状图(Pie chart)1. 常用词1)名词:◆percentage百分比◆proportion份额2)动词:占:Comprise ,make up, constitute, account for, take up,consume占(份额), occupy, composeis divided into…parts分为……部分consist of/ be comprised of 由…构成consume the larges/smallest portion占最大/小的份额与…相比较compare/comparison/by contrast/ in sharp contrast to比…多outnumber/exceed3)短语及副词与…相反on the contrary几分之几one half/ one third/ one fifth/ two thirds/ two fifths大约、大概about/around/almost/nearly/roughly/approximately分别/各自respectively与…相比:Compared with,compared to,in comparison with,in comparison to,by comparison with,by comparison to2. 常用套句1)The graph, presented in a pie chart, shows the general trend in…该图以饼图形式描述了……总的趋势。
雅思写作之小作文常用描述图表词汇__
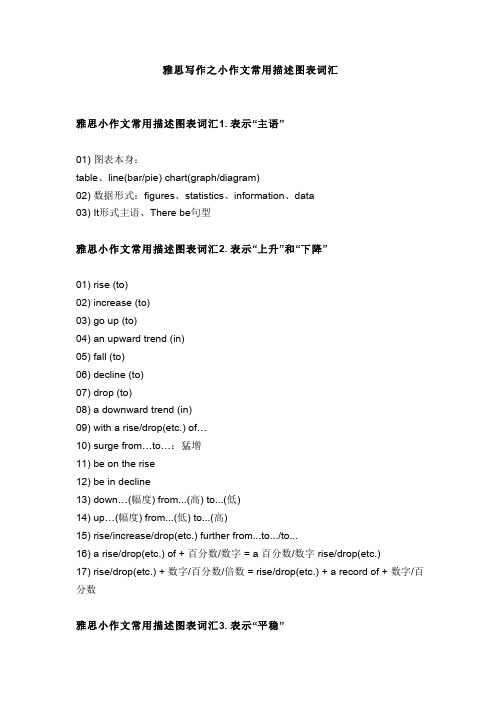
雅思写作之小作文常用描述图表词汇雅思小作文常用描述图表词汇1. 表示“主语”01) 图表本身:table、line(bar/pie) chart(graph/diagram)02) 数据形式:figures、statistics、information、data03) It形式主语、There be句型雅思小作文常用描述图表词汇2. 表示“上升”和“下降”01) rise (to)02) increase (to)03) go up (to)04) an upward trend (in)05) fall (to)06) decline (to)07) drop (to)08) a downward trend (in)09) with a rise/drop(etc.) of…10) surge from…to…:猛增11) be on the rise12) be in decline13) down…(幅度) from...(高) to...(低)14) up…(幅度) from...(低) to...(高)15) rise/increase/drop(etc.) further from...to.../to...16) a rise/drop(etc.) of + 百分数/数字 = a 百分数/数字 rise/drop(etc.)17) rise/drop(etc.) + 数字/百分数/倍数 = rise/drop(etc.) + a record of + 数字/百分数雅思小作文常用描述图表词汇3. 表示“平稳”01) remain stable (at)02) stay constant (at)03) maintain the same level (at)04) remain around that figure05) reach a plateau:到达(上升后的)平稳期 06) no change (in) 07) be flat at:平稳在… 08) level out at:平稳在…雅思小作文常用描述图表词汇4. 表示“波动”、“最高值”和“最低值”01) hover around:在…徘徊02) fluctuate around/at:在…波动(点)03) fluctuate between...and...:在…波动(范围)04) rise and drop (between…and…):起伏(在…之间)05) peak at:在…达到最大值06) hit a peak(of…)07) reach the highest point at:在…达到最大值08) reach a bottom at:在…达到最低值09) reach the lowest point at:在…达到最低值雅思小作文常用描述图表词汇5. 表示“变化程度”01) dramatic → dramatically:巨大02) significant → significantly:巨大03) moderate → moderately:适度04) slight → slightly:微小05) minimal → minimally:极其微小雅思小作文常用描述图表词汇6. 表示“变化速度”01) sudden → suddenly:忽然02) rapid → rapidly:快速03) steady → steadily:平稳04) gradual → gradually:逐渐雅思小作文常用描述图表词汇7. 表示“说明”01) show02) illustrate03) describe04) unfold05) reveal雅思小作文常用描述图表词汇8. 表示“大约”01) about02) nearly03) around04) approximately雅思小作文常用描述图表词汇9. 表示“占据”01) make up02) take up03) account for04) be composed of05) constitute06) comprise07) have/be/reach/hit雅思小作文常用描述图表词汇10. 表示“关于”01) about02) regarding03) concerning04) related to05) with regard to = as to:关于,就…而论(做状语)。
- 1、下载文档前请自行甄别文档内容的完整性,平台不提供额外的编辑、内容补充、找答案等附加服务。
- 2、"仅部分预览"的文档,不可在线预览部分如存在完整性等问题,可反馈申请退款(可完整预览的文档不适用该条件!)。
- 3、如文档侵犯您的权益,请联系客服反馈,我们会尽快为您处理(人工客服工作时间:9:00-18:30)。
最牛英语口语培训模式:躺在家里练口语,全程外教一对一,三个月畅谈无阻!
洛基英语,免费体验全部在线一对一课程:/ielts/xd.html(报名网址)
上升:increase, rise ,ascend ,core, surge,go up, climb ,mount ,level up 下降: decrease, fall, drop ,descend ,decline ,reduce ,lessen ,level down
平稳:stable ,steady ,remain/maintain/keep/be the same as/similar to
波动:fluctuate ,fluctuation ,rise and falls ,up and down
占:occupy ,take up ,account for, gain
而:while ,however ,whereas ,on the other hand ,actually/in fact
相比:by contract ,on the contrary, likewise, compared with
最高点:the highest, the top ,the summit ,the peak ,the most
最低点:bottom ,less ,least ,rock bottom ,
平均:mean ,average
趋势:tendancy ,trend ,inclination
预见:prediction
达到顶峰: mount to
在中占gain the percentage of
有一个稳定的过程:a stable period can be seen
2.分项目的总结
在做这个之前,把“模板”说一下(主要针对菜鸟,应付考试时找不到东西说)
第一段:The(某种图,比如bar chart ,pie chart或是curve graph)show(简单写写情况,比如“妇女受教育程度”,“美国能源利用”,这些一般可以在图下面的说明文字中找到),From the (某种土)we can have a understanding of又是什么情况)
注:第二句话是废话,是为了凑字数,字数够了的时候就可以不用了,当然写的时候注意表达方式的一些小改动
第二段:说明段,From the illustrate+一些内容,主要写以下几个方面:极点(极大,极小),趋势,特别点(交点,转折点,相同点和一些在特定图上有意义的点)
第三段:From the chart,we may have a basic understanding of the situation of——凑字数用的!!
一些表达:
A.柱形图
increase rise go up / drop decrease decline
B.饼图
is dividedsintos parts consume the largest prtion accounting for
(百分比)of is play a very important role in
C.线形图
From this point Drop/increase dramaticly a modest /rapid increase
1.以时间为比较基础的应抓住“变化”:上升,下降,或是波动,题中对两个或两个以上的变量进行描述时应在此基础上进行比较,如变量多于两个应进行分类或有侧重的比较,
2.不以时间为比较基础的应注意对极点的描述。
“成千上万人疯狂下载。
更多价值连城的绝密英语学习资料,
洛基内部秘密英语,技巧,策略
请在网上申请报名”。