Frequency Scaling of Microwave Conductivity in the Integer Quantum Hall Effect Minima
219332006_超宽带太赫兹调频连续波成像技术
第 21 卷 第 4 期2023 年 4 月Vol.21,No.4Apr.,2023太赫兹科学与电子信息学报Journal of Terahertz Science and Electronic Information Technology超宽带太赫兹调频连续波成像技术胡伟东,许志浩*,蒋环宇,刘庆国,檀桢(北京理工大学毫米波与太赫兹技术北京市重点实验室,北京100081)摘要:太赫兹调频连续波成像技术具有高功率、小型化、低成本、三维成像等特点,在太赫兹无损检测领域受到了广泛关注。
然而由于微波及太赫兹器件限制,太赫兹信号带宽难以做大,从而制约了成像的距离向分辨力。
虽然高载频可实现较大宽带,但伴随的低穿透性和低功率会限制太赫兹调频连续波成像系统的应用场景。
因此,聚焦于太赫兹波无损检测领域,提出一种时分频分复用的114~500 GHz超宽带太赫兹信号的产生方式,基于多频段共孔径准光设计,实现超带宽信号的共孔径,频率可扩展至1.1 THz。
提出一种频段融合算法,实现了超宽带信号的有效融合,距离分辨力提升至460 μm,通过人工设计的多层复合材料验证了系统及算法的有效性,并得到封装集成电路(IC)芯片的高分辨三维成像结果。
关键词:太赫兹调频连续波;非线性度校准;多频段融合;准光设计;无损检测中图分类号:TN914.42文献标志码:A doi:10.11805/TKYDA2022225Ultra-wideband terahertz FMCW imaging technologyHU Weidong,XU Zhihao*,JIANG Huanyu,LIU Qingguo,TAN Zhen (Beijing Key Laboratory of Millimeter Wave and Terahertz Technology,Beijing Institute of Technology,Beijing 100081,China)AbstractAbstract::Terahertz Frequency Modulated Continuous Wave(THz FMCW) imaging technology has attracted extensive attention in the field of THz Nondestructive Testing(NDT) because of its high power,miniaturization, low cost, three-dimensional imaging and other characteristics. However, due to thelimitation of microwave and terahertz devices, the terahertz signal bandwidth is difficult to expand, whichrestricts the range resolution of imaging. Although high carrier frequency can achieve large broadband,the accompanying low penetrability and low power will limit the application scenario of THz FMCWimaging system. Therefore, focusing on the field of terahertz wave nondestructive testing, this paperproposes a time-division frequency-division multiplexing 114~500 GHz ultra-wideband terahertz signalgeneration method, which is based on the quasi-optical design of multiband common aperture to achievethe common aperture of ultra-wideband signals. In addition, a multiband fusion algorithm is proposed toachieve effective fusion of ultra-wideband signals, and the range resolution is improved to 460 μm. Theeffectiveness of the system and algorithm is verified by artificially designed multilayer compositematerials, and the high-resolution 3D imaging results of Integrated Circuit(IC) chips are obtained.KeywordsKeywords::Terahertz Frequency Modulated Continuous Wave;non-linearity calibration;multiband fusion;quasi-optical design;Nondestructive Testing太赫兹波(0.03 mm~3 mm)在电磁波谱中位于微波与红外之间,由于其独特的穿透性与非电离性等特性,太赫兹技术已成功用于艺术品保护、工业产品质量控制、封装集成电路(IC)无损检测等领域[1-3]。
薄膜介电常数测试方法

with Ј close to 102. The results provide another piece of evidence for an extrinsic, Maxwell-Wagner type,
microwave
1、introductionMicrowave is a kind of electromanetic wave with penetration characteristics which frequency ranged from 300M~300KMHz. the principle of microwave heating is dielectric loss. the water molecules of the materias are polar molecules, the polarity orientation of which changes with the electronic magnetic field. Compared with the s low process of heat conduction of the conventional drying,t he energy transfer and the rise of the materials’ temperature of which is a fast process. In a very short period of time,Materials have a fast drying rate as a result of the temperature in the material cells rised rapidly,with the Rapid evaporation of water. Foreign microwave drying technology has been applied in light industry, food industry, chemicalindustry, agriculture and agricultural products processing areas;Microwave drying technology in China started in the 1970 s,at present,There are a lot of agricultural products are applied microwave drying successfully.However,the technology of the temperature measurement and control still wasn't mature enough When it works. Ordinary microwave drying equipment can't make sure of the drying temperature of the crops Keep stable in a certain range,not only the temperature of the materials rised fast,but also the crops quality fluctuated strongly after dried,And sometimes even material can produce internal paste phenomenon,Therefore ,it can not be widely promoted. In order to control temperature of the drying room automatically,and Improve the rate and quality of drying,we designed a technology that can control the temperature of the drying room,and improve the rate and quality of drying in the process of the microwave drying,which ensured the quality of the material drying because the controlled drying temperature changes at a stable range.2、System designBased on the characteristics of the material,the microwave drying controlled by the real-time temperature of the inner of microwave oven which works at the right set temperature range ,the power supply of the microwave oven will be cut to reduce the material‘s temperature when the temperature reaches to the upper limit,on the contrary ,the power supply of themicrowave oven will be switched when the temperature reaches to the lower limit.,and the microwave oven Works. The dry gap works and the drying quality is ensured through the microwave oven works and stop .the flowchart of the programming is shown in figure 1.3、the design of the temperature control systemThe microwave temperature system are designed to temperature measure and control system according to Testing requirements,its’ hardware composed by AT89S52microcontroller、ADC0804 A/D Conversion Chip、74HC573N latch、relay and digital display pieces,and the most importantly system part is its’ temperature measurement system.Temperature measuring system is shown in figure 2.Digital temperature sensor can perceive and detecte the temperature of the drying material,and turn the temperature signa into 9 digits digital signal that will be sent to AT89S52microcontroller,after the microcontroller dealed with the emperature sensor signal with the work of the External latches and the Digital tube the real-time temperature will be displaied . At the same time,according to control programs the microcontroller ensured the accuratetemperature signal through the Wired interface conveyed real-time work instructions to DS18b20 Digital temperature sensor.The current temperature sensors have thermocouple temperature sensor, infrared temperature Temperature environment sensors, optical fiber temperature sensors, etc,but all of those have different problems.For example,electric dipole sensors in the microwave environment can be influenced seriously by microwave ,which lead to the temperature measurement is not accurate;Infrared sensors can only measure the surface temperature of the sample rather than the inner temperature of the sample;Optical fiber temperature sensors costs too much. So this system choosed the digital temperature sensor DS18b20. But the environment of the microwave field is very bad,we made aspecial treatment to the digital temperature sensor DS18b20 to avoid being damaged.In order to make the metal temperature sensor works with great sensitivity and accuracy instead of working with eddy-current effects and skin effects,the system used the 0.5 thick high-melting alloy tube as the Packaging materials,which put the digital temperature sensor DS18b20 and it’s wires into the alloy tube ,the wires of the the digital temperature sensor can reach directly to the control circuit of the outsid of the microwa field,so it avoid the microwave field influencing the digital temperature sensor,just as shown in the figure 3 .When the DS18b20 digital temperature sensor is packaged, as the package and brass is separated by the measured object and the sensor itself get a mild fever because of eddy current effect and skin effect ,so the sensor has a slight lag and volatility for the inside drying materials .To such cases,the author simulated the environment of the microwave heating under normal conditions, compared the packaging of microwave sensors in a simulated environment,and used "Matlab" to de-noising ,De-correlation and fit operations to get the fitting function [8] of the sensor package. Write this Fitting function into microcontroller, and the digital temperature sensor data was processed by the microcontroller DS18b20, then get temperature of the dry matter accuratly and real-time.Least squares fit of data results from the experimental data shows, Figure "polyfit" and Figure "polyinterp" represent the Second and fifth respectively on behalf of the data fitting results.the Five times fitting results are more accurate .Finally, by nonlinear least squares fitting to get The final fitting function:fun(c,x) = c(1)*exp(c(2)*x)c = 11.2662 0.03174 Test and ResultsExperiment was based with fresh shelling peanuts for raw materials. taking100g as units of measurement,dividing into several copies randomly and drying test was under Different conditions ,and using the 1.2W / g, 2.36W / g, 3.52W / g three power factor to test.4.1 Test without the constant temperature control systemAfter 3 different power factors of continuous drying ,power factor the higher peanut dehydration rate faster, up to 3.2g / min, the maximum temperature up to 100°. In 1.2W / g power factor, an hour lost 31.4g, part of peanut is burnt and overflow a small amount of peanut oil, so the drying quality is poor. In the 3.52W / g power factor, peanuts produced unempyreumatic phenomena, the overflow much peanut oil after, so the drying quality is very poor.4.2 Test under thermostatic control systemuse of the same batches of peanut as the test material, and the temperature interval is set to 35 ~ 40 degrees Celsius.constant temperature test is in the same condition of three power factors, it was found in 3.52W / g power factors, when Drying to fifth minutes the data indicated that the water loss rate up to 1.0g / min,and the other two power factor maximum rate of water loss is in 0.8g / min,When entering the constant-speed drying time ( fifteenth minutes ) peanut dehydration rate is in 0.5g / min. The test material in 3.52W / g power factors have the greatest loss of water quality, achieve 23.2g. After the drying , peanut cotyledon have normal appearance, no peanut oil spills, and have no basical difference with peanuts drying under the natural condition . so,it has a good drying quality.5 The endThe microwave temperature control system can monitor the inner microwave drying crops' temperature and quality real-time, And by controlling the microwave power to open and close to make the implementation of intermittent microwave drying, and let the drying crops' temperature in set range stability to Ensure the crops' drying quality.The experiment results show that the system can achieve the intended effect better ,realize the microwave drying temperature control.。
Microwave Breakdown in Resonators and Filters
Microwave Breakdown in Resonators and FiltersD.Anderson,U.Jordan,M.Lisak,T.Olsson,Associate Member,IEEE,and M.˚AhlanderAbstract—Several aspects of microwave breakdown in res-onators are discussed in this paper.Approximate analytical criteria are formulated for the critical microwave breakdownfield in some illustrative model geometries,which clearly brings out the main physical properties of microwave-induced breakdown in the presence of inhomogeneous electricfields.The analytical results are verified by comparisons with numerical calculations.A full numerical solution procedure for determining the microwave breakdownfield in commercially available resonator designs is also presented.The numerical predictions are compared with experimental results,demonstrating very good agreement in the pressure range available for the experiments.The success of the predictions of the breakdown threshold suggests methods complementary to high-power pulse testing of radio-frequency filters.Index Terms—Microwave breakdown,microwavefilters,mi-crowave resonators.I.I NTRODUCTIONM ICROWA VE breakdown in gases under various phys-ical and technical conditions is a well-known and much-studied problem.A classical summary of relevant results is given in[1].However,the technical development of mi-crowave generators as well as of microwave devices continue to give rise to new situations and parameter regimes where microwave breakdown plays an important role and where previous results on breakdown are not directly applicable. One example of this is the recent development of microwave pulse generators,which are now capable of delivering very short and very intensive pulses for which classical breakdown theory has to be properly generalized[2].Another example is provided by the trend to design microwave devices as small and compact(and low cost)as possible.This development leads to concern about the concomitant breakdown strength of the construction,in particular,in situations involving more complicated geometries,such as in microwave resonators and filters.In many microwave devices,the geometrical configuration gives rise to local strongly enhanced microwavefields.Such regions are potentially dangerous from the point-of-view of breakdown since thefield here may be much stronger than the globally predicted breakdownfield.On the other hand, a locally overcriticalfield does not necessarily imply global breakdown.Several model examples of this situation are considered and the influence of localfield enhancement onManuscript received March26,1999;revised July16,1999.D.Anderson,U.Jordan,and M.Lisak are with the Department of Electromagnetics,Chalmers University of Technology,S41296G¨o teborg, Sweden.T.Olsson and M.˚Ahlander are with the Allgon System AB,18325T¨a by, Stockholm,Sweden.Publisher Item Identifier S0018-9480(99)08454-9.the global breakdown condition is investigated.In this paper, we will discuss several aspects of microwave breakdown with emphasis on the problem of breakdown in the inhomogeneous microwavefields determined by a resonator orfilter geometry. First,we will consider microwave breakdown in a cylin-drical resonator where the inhomogeneous electricfield gives rise to a strongly inhomogeneous ionization.We analyze this problem using an approximate analytical variational approach, which has the advantage of giving very simple and explicit expressions for the predicted breakdown electricfields and also gives a clear picture of the physics involved in the breakdown process.For more complicated geometries,the usefulness of analytical approximations become limited and resort must be taken to numerical means.We illustrate this by a direct numerical determination of the breakdownfield in a realistic microwave resonator.The numerical predictions are related to the analytical understanding obtained and are also compared with experimental results.Very good agreement between theory and experiments is demonstrated.Finally,we use the obtained results to suggest a procedure for predicting and testing microwave breakdown in resonators used, e.g.,in antenna feed systems for mobile telephone communication.These resonators conventionally operate at or near atmospheric pressures and a realistic test of their critical breakdown strength is sometimes expensive and cumbersome to perform due to the high powers needed.On the other hand, the breakdown threshold decreases with decreasing pressure, thus making it easier to perform a breakdown test at lower pressures.We have shown that by performing breakdown measurements at low powers,a reliable extrapolation of these results to atmospheric pressures can be made based on the numerically obtained curve for the breakdown strength as a function of gas pressure.The analytical considerations show that breakdown due to diffusion at lower pressures can be characterized by an effective diffusion length,which,however, depends on the complicated geometry and,in practice,can only be determined numerically.As the pressure is increased, breakdown becomes controlled by a combination of diffusion and attachment losses,the relative ratio between these factors being determined by the numerically obtained result.We hope that this method proves a useful tool for easy tests of the breakdown strength of various gas-filled microwave devices working at atmospheric pressures.II.B ASIC B REAKDOWN P HYSICSGas breakdown in microwave electricfields manifests itself as an avalanche-like increase in time of the free electron density.This increase is caused by collision ionization of the neutral gas molecules by free electrons that are being0018–9480/99$10.00©1999IEEEaccelerated to high energies by the microwave field.The evolution of the free electrondensity(1)whereis the ionization frequency,andis the attachment frequency of the free electrons on neutral molecules.A heuristic way of deriving the breakdown threshold con-dition is to introduce the effective density scalelengthasis an effective diffusion frequency corre-sponding to the density scalelength.From (3),we infer that the electron density will grow exponentiallywhen,which determinesthe density scale length and the concomitant diffusion losses.Qualitatively,weexpectto be determined by the shortest diffusion distance in the system,i.e.,essentially by half the geometrical dimension of the waveguide,resonator,etc.However,such crude estimates are generally not enough inorder todetermineand an accurate determination involves solving the eigenvalue problem obtained from (1)in the limit casewhen(6)wheredenotes the boundary of theregionrigorously from (6)asis determined by the geometry ofthe configuration only.A further complication of the problem of determining accu-rate breakdown thresholds is due to the fact that although the diffusion coefficient and attachment frequency depend rather weakly on the strength of the microwave electricfieldis a normalizing electric fieldanddepends on the gas,but typically forair.Although this generalizationcomplicates the detailed analysis of the breakdown problem,it does not imply a conceptually different situation as compared to the homogeneous case.The full diffusion equation can now bewrittendenotes the maximum of the ionization fre-quency over the volume occupied by the microwave field.The breakdown threshold condition clearlybecomesis now even moredifficult to determine accurately than in the homogeneous case since it depends on the spatial mode structure of the electric field (which is given)in addition to the dependence on the spatial mode structure of the electron density.The rigorous analysis for determining the breakdown threshold involves solving the following new eigenvalueproblem:(12)where.It is obvious from (12)thatthe eigenvalue will now also be affected by the field inhomogeneity through the normalization formfactor and that the density scale length dependsonby solving(12),the breakdown condition (11)can be used a posteriori to infer the proper effective scale length through therelation(13)where,for simplicity,we have assumedthat.ANDERSON et al.:MICROWA VE BREAKDOWN IN RESONATORS AND FILTERS 2549However,the inhomogeneous eigenvalue problem given by (12)is difficult to solve analytically for geometries of practical interest and a resort must then be taken to either approximate analytical techniques or to numerical means.In this study,we will demonstrate both possibilities although,admittedly,in complicated geometries,a numerical approach is the only possible way to determine the breakdown threshold.However,we will also show that the concept of an effective scale length,which determines the diffusion losses,can be used in a semian-alytical way in combination with experiments to make accurate predictions for the breakdown threshold over a large range of pressures.The basic idea here is to determine the characteristiclengthby low-pressure breakdown experiments and then to extrapolate the analytical breakdown expression to higher pressures using the experimentally determined scale length.III.A PPROXIMATE A NALYSIS B ASED ON D IRECTV ARIATIONAL M ETHODSA convenient approach for approximate analysis of the eigenvalue problem (12)is direct variational methods based on trial functions and subsequent Raleigh–Ritz optimization.This approach has been used successfully (both analytically and numerically)in previous studies of breakdown problems.Ep-stein,who applied the approach to several simple cases where alternative exact solutions were available,made one of the first applications to situations involving spatially varying fields [3].Approximate,but explicit analytical solutions were obtained and shown to be in very good agreement with the exact so-lutions.He also demonstrated semianalytical examples where the first step of the analysis could be performed analytically,but where the second optimization step,although conceptually simple,became algebraically tedious and was most conve-niently performed numerically.The approach was later used (and generalized)by Mayhan and Fante,[4],[5]in applications to breakdown in narrow infinite [4]and rectangular [5]slot radiators,also including situations involving microwave pulses where the finite pulse length affects the breakdown condition.An example of a purely numerical analysis based on the variational formulation is given by Maldonado and Ayala [6],who investigated diffusion controlled breakdown of gases in cylindrical microwave cavities excited indifferent modes.The variational analysis is based on the fact that the char-acteristic eigenvalue problem can be reformulated as a varia-tional problem accordingto(14)where theLagrangianis expressed interms of a flexible and physically reasonable trialfunctionwith a prescribed dependenceon.The trial function is inserted into the variational integral,which can then be integratedover(17)which,together with the trivial relation,determine theconstants.The integration and subsequent optimization may,in prin-ciple,be done analytically,semianalytically,or numerically.However,it is obvious that a completely analytical analysis requires a careful choice of trial functions and a not too complicated geometry,whereas a semianalytical or completely numerical analysis makes it possible to investigate more com-plicated problems.In this study,we will give an illustrative demonstration of the usefulness of the variational approach and the implications for determining the effective scale length of the problem.IV.V ARIATIONAL A PPROACH TO B REAKDOWNINC YLINDRICAL W A VEGUIDES AND C A VITIESAs an illustration of the variational approach,we will consider breakdown in a hollow cylindrical waveguide ofradiusmode,where the electric field can be writtenas.The eigenvalue problem for the electrondensityaccordingto .This impliesthat the remaining eigenvalue problem for the radial modedependencebecomes (18)where,for convenience,in this case,we have chosenthenormalization,and2550IEEE TRANSACTIONS ON MICROWA VE THEORY AND TECHNIQUES,VOL.47,NO.12,DECEMBER1999Fig.1.Plots of the analytical breakdown condition given by (21)for some different values of .For easy comparison,the notation of [1]is used and k 2= .Using the fact that a good approximation for the Besselfunction.The reduced Lagrangianbecomes-axisin [1,Fig.6-2]shouldbe(23)In particular,we note thatfor,the eigenvalue equation reduces to a homogeneous equation,which is the same as the one determining the radial mode structure of the microwaveTABLE IC OMPARISON B ETWEEN E IGENV ALUES OF (18)FORD IFFERENT V ALUES OF ANDFOR L =1.A NALYTICAL E IGENV ALUES a AND N UMERICAL O NESnfield.The exact lowest order mode of this equationis,but the approximations for the correspondingeigenvalues still show good agreement,which is typical of the direct variational approach.The approximate breakdown threshold can be writtenas(25)This implies that the effective density scalelengthbecomes(26)As expected,the effective density scale length depends on the geometrical size of the waveguide()and on the degree of nonlinearity in the ionization frequency(ANDERSON et al.:MICROWA VE BREAKDOWN IN RESONATORS AND FILTERS 2551In fact,if it is high enough to make the concomitant plasmafrequency;important effects on the microwave propagation can be expected,even though the microwave field strength is formally below the breakdown threshold.In a resonator or filter,the high field region is usually confined to a small,but very important,region from the point-of-view of device performance.If,in this region,a high electron density is reached,this may be enough to degrade the performance even though the electron density over the main volume of the resonator is (and remains)small.Another dangerous scenario is the one where a locally high field (and concomitant high electron density)gives rise to significant absorption and the formation of “hot spots”where the temperature of the gas is increased.At high gas tempera-tures,the gas becomes even more liable to breakdown and the breakdown strength of the gas decreases,ultimately leading to “global”breakdown.Thus,regions of strong electric-field enhancement tend to give rise to regions of high electron density and are potentially dangerous from the point-of-view of microwave breakdown,and should be avoided in a careful design.In view of the analysis of the preceding sections,it is instructive to discuss the scale length of the density variation in situations with strong local electric-field enhancement.It is physically clear that even if the electrons are created in the high field region,diffusion is liable to spread the electrons out into the low field region where they are absorbed by attachment and/or diffusion to the walls.The corresponding scale length will then depend on the length of the enhanced electric-field region and the diffusion distance to the wall as well as on the relative strength of the diffusion and attachment processes.In fact,it can easily be shown by analyzing some simple model geometries that,in situations where the ionization is restricted to a small region ofextensionaway from theelectron-producing high-field region,the density scale length is simply the geometric mean of the two characteristic distances.This implies the breakdownconditionis the ionization frequency in the high-field region.A similar result,in the quite different situation of breakdown in free space,was obtained in [9].Note again that the char-acteristic scale length is determined by the geometry of the configuration only (cf.the result of the analysis of Section IV).Consider now the situation where losses from the high-field region take place by means of diffusion into a low-field region where attachment is the dominating loss mechanism.We can then show,in a similar way,that the breakdown condition and density scale length are determinedby(29)Finally,we notethat qualitatively determines the ex-tension of a high-density region or hot spot.In the case when the electron losses from the field enhancement region is due to diffusion only,geometric lengths determine the scale length.On the other hand,in the case when the field enhancement region is drained by electrons through diffusion into an at-tachment dominated region,the characteristic extension of the high electron density region is givenbyand dependon the gaspressure.From Maxwell’s equations,one can then derive the following equationforand2552IEEE TRANSACTIONS ON MICROWA VE THEORY AND TECHNIQUES,VOL.47,NO.12,DECEMBER1999 where is the unit vector normal to the surface of theboundary.Havingdeterminedon the metal boundaries of the resonator.The modeling of the physical quantities appearing in(33)is here made more carefully than in the previous analyticaland semianalytical investigations.In particular,the diffusioncoefficient and characteristic frequencies of the problem aretaken as[9]cmsssin torr.The true(rms)electric-fieldstrength is related to the effective electricfield through the pressure dependentrelationdenotes the normalized form function of theelectricfield in the cavity(cf.thefunction in our previousanalysis)and.If wesetusing MATLAB’s PDE Toolbox.Theproblem is tofindthe.Since the formulas for the ionizationand attachment frequencies are only validfortorr)and,we inferthat.This interval is then steppedin equidistant steps tofind.The solution of thesubsequentequation is the desired valueofmm,rodheight mm.Several of the physical features discussed in the previoussections are clearly seen in the numerical results.In particular,we note that,at high pressures,the breakdown process is a verylocal phenomenon,which initiates in the region of highest localfield enhancement at the top edge of the rod.This is typicalfor attachment-dominated breakdown.However,at lower pres-sures,the picture becomes quite different.Here,the diffusionloss becomes important,the resulting effective diffusion lengthbecomes larger than the dimension of the region where theelectricfield is largest,and a large electron cloud spreadsANDERSON et al.:MICROWA VE BREAKDOWN IN RESONATORS AND FILTERS2553(a)(b)Fig.3.Numerically obtained results for the electron density distribution at the breakdown threshold in a resonator with a more complicated geometry.Note the different localization of the two electron density eigenmodes shown in:(a)(mode 1)and (b)(mode 2).out in the gap between the top of the rod and cavity wall.This picture is a direct verification of the physical conclusions about breakdown in diffusion/attachment-dominated situations in strongly inhomogeneous fields discussed in the previous section.This change of localization of the electron density,which may occur in a complicated geometry,is further demonstrated in Fig.3.In this case,a resonator tuning screw in the center,together with the resonator rod,provide a high field region in addition to the one at the edge of the hat,which will cause breakdown to be initiated in different regions at high and low pressure,respectively.In such situations,(36)provides at least two physically feasible solutions as the two modes with the lowest eigenvalues.At low pressure,the mode showing a predominance of electron density at the center have the lowest eigenvalue and,thus,sets the limit,whereas at high pressure,the mode having high electron density at the edge of the hat sets the limit.The crossover region is at approximately 400torr.In Fig.4,a corresponding “mode crossing chart”is shown.A further aspect of the importance of local high electric field regions was also analyzed numerically.It is well known that sharp metal corners give rise to locally very high fields and that a careful design should avoid such features,e.g.,byroundingFig.4.Detailed picture of the crossing of the breakdown curves for the two modes shown in Fig.3.Fig.5.Numerical results for the breakdown threshold power as a function of the curvature radius of the edge of the rod (p =760torr)in the resonator shown in Fig.2.off the corners.The effect on the threshold breakdown power of varying the curvature radius of the rod edge is shown in Fig.5.It is clearly seen how the breakdown power decreases with decreasing curvature radius.In fact,the breakdown power for smoothly rounded corners is a factor of two larger than that for sharp corners.VII.NA NALYTICAL –E XPERIMENTAL A PPROACHFORB REAKDOWN P REDICTIONSWe will conclude the predictive analysis,by presenting a simple complementary approach for extrapolating low-pressure breakdown data for resonators and filters to higher pressures.The method relies on measurements of the actual breakdown threshold at low pressures,where the breakdown power is also low,which makes it possible to accurately extrapolate the breakdown threshold over a wide range of pressures up to atmospheric pressures.There,the2554IEEE TRANSACTIONS ON MICROWA VE THEORY AND TECHNIQUES,VOL.47,NO.12,DECEMBER1999 corresponding breakdown power levels are more than20dBhigher than for the low-pressure bench marking measurements.The physical basis of the approach is the analysis inSections III–V,where the relative importance of diffusion andattachment in determining the electron density scale length arediscussed.The determination of the density scale length canbe done a priori using numerical means,as was demonstratedin Section VI-D,but it may also be determined empirically byexperimentally determining the breakdown threshold at lowpressures.Having determined the diffusionlengthis taken as the diffusion lengththat is unknown,but determined by the geometry of theconfiguration[cf.(27)].Using a simplified[as compared to(34)]approximation for the net ionization frequency of air(e.g.,[10],[11]),wehave(37)whereis given intorr,in centimeters.This implies that the breakdown conditioncan bewritten(38)whereandthe(40)where for the input portandfor the entire resonator.Thus,using the numericallyfound mode structure in the resonator,the strength of theelectricfield in the resonator can be related to the measuredpower level by means of(39)and(40).parison Between Theoretical Predictions andExperimentsIn an experimental study,the breakdown strength of two rodresonators was determined as a function of gas pressure andthe results were compared with the corresponding theoreticalpredictions.The measurements were done byfixing the inputpower level to the resonator to certain levels,and for eachpower level,lower the pressure until breakdown occurred,atwhich point power and pressure were recorded.The procedureANDERSON et al.:MICROWA VE BREAKDOWN IN RESONATORS AND FILTERS 2555was repeated five times for each power level with change of air in the resonator to exhaust breakdown products between successive tests.Breakdown was detected by measuring the sudden decrease in transmitted power,which signals that the global wave propagation properties of the resonator changed.In order to be able to investigate breakdown under well-defined conditions,a single resonator was constructed and tested for breakdown.A 73-mm-long rod made of Cu with diameter 9mm was inserted into an Al cavity of 74-mm height and diameter 30mm.Thus,in this case,the air-gap to the silver-coated lid is only about 1mm.The edge of the rod has a 2.5-mm curvature radius in order to avoid a sharp edge.The resonator had two ports,each with an externalof the resonator was 2050.A second experiment was done on a specific (classified)Allgon product,(no data on the geometries are given,but it is of a similarly simple shape as that of Fig.2),for rathersmall pressures (torr)where the breakdown thresholdeasily could be reached.In this case,there were four resonators arranged into an approximate Chebyshev filter of 15-MHz bandwidth.According to the algebra of an ideal lumped-element network showing this Chebyshev transfer function,the two inner resonators would experience the highest amount of stored energy at matched operating conditions [13].The experimental results obtained for the specially designed single resonator are summarized in Fig.6.The mean break-down pressure was determined experimentally for resonator pressures ranging from 30to 500torr.The agreement with the fully numerical results is shown to be good over the considered pressure range.The numerical results are apparently predicting a somewhat lower value than what is observed from the average breakdown threshold.This difference can partly be explained as due to the fact that theory predicts the breakdown level assuming that there are always free electrons available to initiate the ionization process.Thus,if there are no free electrons,the resonator can withstand higher power.This implies that,in the experiment,where the pressure is decreased in time,the time delay for a first electron to appear tends to spread out the measured breakdown points in the direction of low pressure.In the case of the semianalytical approach,the corre-sponding penalty function was found to have a pronouncedminimum for a diffusion length ofmm,using theexperimental points at low and intermediate pressures.Thecorresponding extrapolation curve is also included in Fig.6.The curve has two free parameters,the geometrical length ofdiffusionmm and an offset of 12556IEEE TRANSACTIONS ON MICROWA VE THEORY AND TECHNIQUES,VOL.47,NO.12,DECEMBER1999demonstrated that,using an approximate approach based on direct variational methods,significant progress can be made in formulating explicit and simple breakdown criteria for physically and technically important situations.In thesefirst studies,comparatively explicit expressions for the microwave electricfield have been assumed.Although this is a legitimate approach in simpler geometrical situations, many technically important situations involve more or less complicated geometries where an analytical determination of the mode structure of the microwavefield as well as of the concomitant characteristic density scale length are impossi-ble.In order to handle such situations,two complementary approaches have been developed.Thefirst approach is a semianalytical one,which relies on the fact that the diffusion losses are determined by a character-istic diffusion length being determined by the geometry of the resonator.Although this scale length can not be determined analytically for a complicated geometry,it can be inferred by numericalfitting procedures from experimental breakdown data in the low-pressure region where breakdown tests are easy to perform.Having determined the characteristic diffusion length,the unknown parameter in the breakdown threshold condition is known and the formula can be extrapolated to medium and high pressures with some confidence.The second approach involvesfirst solving Maxwell’s equa-tions in circular–symmetric geometry in order to determine the associated mode structure of thefield.This result is then inserted into the eigenvalue equation for the electron density, which determines the breakdown condition.Finally,the critical breakdownfield is determined by solving the eigenvalue equation numerically.In order to test the theoretical predictions,a series of breakdown tests were made on two different resonator designs, including a commercially available one.The comparison be-tween theory and experiments shows very good agreement and we think that the obtained results encourage the use of the presented methods for predicting breakdown in resonators as a complement to high-power pulse testing at atmospheric pressure.By lowering the air pressure in the resonator or the cavity,a microwave discharge can be generated even at moderate power.There is an advantage in knowing what the pressure limit for the construction is,i.e.,that a discharge most likely will occur at a certain pulse power and pressure. It is even possible to run continuous wave excitation in single or multicarrier configuration,thereby simulating a realistic transmission format,and nevertheless obtain a discharge at sufficiently low pressure.Some uncertainty,in the case of the method that involves extrapolation to atmospheric pressure, will necessarily follow for designs involving complicated geometries.However,used with some caution,the method should be a simple and useful tool for predicting breakdown in resonators and cavities at medium and high pressures. The more complete and fully numerical test program for breakdown that has also been developed consists of two nu-merical steps—one,which solves the microwave-mode struc-ture in the resonator or cavity and another that determines the breakdown condition once the mode structure is known. The predictions have been tested against experiments at small to moderate pressures,where breakdown tests are easy to perform,and the agreement is found to be very good.Thus,this numerical approach can be used as an efficient and accurate predictive tool for microwave breakdown in the design of resonators andfilters even up to atmospheric pressures.R EFERENCES[1] A.D.MacDonald,Microwave Breakdown in Gases.New York:Wiley,1966.[2] A.V.Gurevich,N.D.Borisov,and ikh,Physics of MicrowaveDischarges.New York:Gordon and Breach,1997.[3]M.Epstein,“High-frequency breakdown of nonuniform gases in spa-tially varyingfields,”Phys.Fluids,vol.11,pp.896–902,1968.[4]J.T.Mayhan and R.L.Fante,“A variational formulation specifyingthe breakdown criteria for plasmas subjected to spatially nonuniform electricfields,”J.Appl.Phys.,vol.40,pp.449–453,1969.[5],“Microwave breakdown over a semi-infinite interval,”J.Appl.Phys.,vol.40,pp.5207–5211,1969.[6] C.D.Maldonado and I.L Ayala,“Diffusion-controlled breakdown incylindrical microwave cavity excited in the TM0n0mode,”J.Appl.Phys.,vol.43,pp.2650-2656,1972.[7]M.A.Herlin and S.C.Brown,“Electrical breakdown of a gas betweencoaxial cylinders at microwave frequencies,”Phys.Rev.,vol.74,pp.910–913,1948.[8]Jahnke,Emde,and L¨o sch,Tables of Higher Functions.Stuttgart,Ger-many:Teubner Verlagsgesellschaft,1966.[9]W.Woo and J.S.De Groot,”Microwave absorption and plasma heatingdue to microwave breakdown in the atmosphere,”Phys.Fluids,vol.27, pp.475–487,1984.[10]W.C.Taylor,W.E.Scharfman,and T.Morita,Advances in MicrowavesVol.7,L.Young,Ed.New York:Academic,1971.[11] D.Anderson,M.Lisak,and T.Lewin,“Generalized criteria for mi-crowave breakdown in air-filled waveguides,”J.Appl.Phys.,1989,vol.65,pp.2935–2945.[12] C.A.Balanis,Advanced Engineering Electromagnetics.New York:Wiley,1989.[13]G.L.Matthaei,L.Young,and E.M.T.Jones,Microwave Filters,Impedance.Matching Networks,and Coupling Structures.McGraw-Hill,1964,ch.15.D.Anderson,photograph and biography not available at the time of publi-cation.U.Jordan,photograph and biography not available at the time of publication. M.Lisak,photograph and biography not available at the time of publication.T.Olsson(A’97),photograph and biography not available at the time of publication.M.˚Ahlander,photograph and biography not available at the time of pub-lication.。
anisotropy
Si · Si+ˆ η,
(1)
We have developed a kinetic energy driven superconducting mechanism based on the charge-spin seperation(CSS)fermion-spin(FS) theory. within CSS-FS theory,we can rewrite the T-J model as H = −t
0 gσ (k, iω ) = Zf 2 2 Uhk Vhk iω + ξ k + Zf = Zf 2 iω − Ehk iω + Ehk (iω )2 − Ehk
(3)
0+
(k, iω ) = Zf
1 1 hz (k ) hz (k ) ( − ) = Zf 2 2Ehk iω − Ehk iω + Ehk (iω )2 − Ehk
α
(13)
Σα (k, iω )˜ τα ,
(14)
whereτα are the pauli matrix the full green function G(k, iω ) = Zf 1 2 2 (iω − Σ0 (iω ))2 − Ek (iω − Σ0 (iω )) + ( (k )
ik·η ˆ η ˆe hz
(4)
hz (k )
where ξk = Zf ξk , ξk = Ztχ1 γk − µ , γk = (1/Z )
1 2 (cos kx a
=
1 2 (cos kx a
电子术语翻译
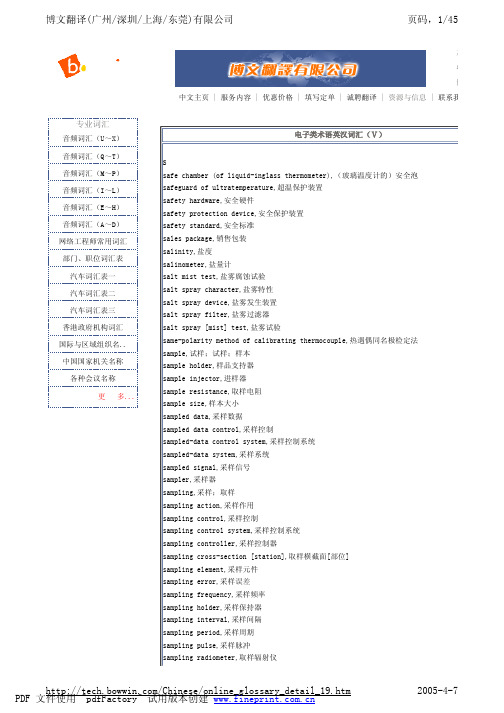
/Chinese/online_glossary_detail_19.htm PDF 文件使用 "pdfFactory" 试用版本创建
2005-4-7
博文翻译(广州/深圳/上海/东莞)有限公司
页码,2/45
sampling rate,采样(速)率 sampling system,采样系统 sampling test,抽样试验 sampling time,采样时间;取样时间 sampling value,采样值 sand dust test chamber,沙尘试验箱 sand pattern method,砂形法 sanitary valve,卫生阀 satellite gravimetry,卫星重力测量 satellite infrared spectroratiometer,星载红外光谱辐射计 satellites,卫星峰 saturated calomel electrode,饱和甘汞电极 saturated standard cell,饱和式标准电池 saturation characteristics,饱和特性 saturation deficit,饱和差 saturation vapour pressure,饱和水汽压 saunders valve,隔膜阀 scale,标度尺;标度板 scale division,标度分格;分格[度] scale interval,分格[度]值 scale length,标度长度;标度尺长度 scale mark,标度标记 scale marking,标度标志 scale numbering,标度数字 scale range,标度范围 scale sensitivity,分格灵敏度 scale spacing,标度分格间距 scaling (for analogue-to-digital converter),(数/模转换的)规范化 scan rate,扫描速率 scanner,扫描器 scanning,扫描;扫查 scanning electron microscope(SEM),扫描电子显微镜 scanning ion microprobe,扫描离子微区探针 scanning microwave multiband radiometr (SMMR),多波段扫描微波辐射仪 scanning radiation thermometer,扫描辐射温度计 scanning transmission electron microscope (STEM),扫描透射电子显微镜 scanning tunnel microscope,扫描隧道显微镜 scattered radiation,散射线 scattering (of radiant energy),(辐射能的)散射 scattering ion energy,散射离子能量 scattering ion energy ratio,散射离子的能量比值 scattering turbidimeter,散射光浊度计 scatterometer,散射计 scintillation detector,闪烁检测器 scintillation emanometer,闪烁室式射气仪 scintillator,闪烁体 screen dump,屏幕转储 screening test,筛选试验
NWT系列扫频仪说明书-中英文版

NWT系列扫频仪说明书-中英⽂版NWT系列数字化扫频仪NWT SERIAL RF DIGITAL ANALYZER使⽤说明书USER MANUAL梧桐电⼦WUTONG ELECTRONIC⽹址:/doc/65ed2123e45c3b3567ec8be9.htmlsite:/doc/65ed2123e45c3b3567ec8be9.html电话:134 **** ****TEL: +86-134 **** ****Q Q: 1630 2767Email: bg7tbl@/doc/65ed2123e45c3b3567ec8be9.html版本:V1.1version: V1.1⽇期:2012-10-30date:2012-10-30翻译结果如有出⼊,以中⽂为准Translation as a result of access, to Chinese prevail第⼀部分总述overview⼀、特性Character★ 2k-3000MHz范围内快速准确测量.2k-3000MHz range of fast and accurate measurement ★动态范围: +10dBm ~ -80dBm Dynamic range: +10dBm ~ -80dBm★软件校准功能减少系统误差Software calibration function to reduce the system error★直接显⽰3dB,6dB,60dB带宽Directly display 3dB, 6dB, 60dB bandwidth★曲线最⼤最⼩值显⽰Curves of maximum minimum value display★ VFO输出VFO output★带功率计功能power meter function★带SWR测量SWR measurement★带阻抗测量impedance measurement★输出带50dB衰减器output with 50dB attenuator★可打印测量曲线和数据print measurement data and the curve⼆、概述overviewNWT系列数字化虚拟扫频仪是⼀台⾼智能化RF幅频特性分析仪。
微波无损检测 外文书籍
微波无损检测外文书籍Microwave Non-Destructive Testing: A ReviewAbstract:Microwave non-destructive testing (MNDT) is a non-invasive technique that uses microwave radiation to evaluate the internal structure and qualityof materials without causing any damage. In this review, we aim to provide a comprehensive overview of the current state of MNDT techniques discussed in existing foreign literature. We will explore the principles, applications, advantages, and challenges associated with microwave non-destructive testing.1. IntroductionMicrowave non-destructive testing (MNDT) has gained significant attention in recent years due to its ability to provide accurate and reliable results in various fields, including aerospace, construction, and medicine. This technique works by emitting microwave radiation towards the material of interest and analyzing the scattered waves to determine its internal properties. Unlike traditional destructive testing methods, MNDT allows for real-time evaluation without causing any harm to the tested material.2. Principles of MNDTMicrowave non-destructive testing relies on the interaction between microwaves and the material being tested. The dielectric properties, such as permittivity and permeability, play a crucial role in determining the behavior of microwaves within the material. By analyzing the reflection, transmission,and absorption of microwaves, MNDT techniques can provide valuable information about the material's structure, composition, and defects.3. MNDT Techniques and InstrumentsThere are various MNDT techniques and instruments available, each with its unique advantages and limitations. Some commonly used techniques include microwave imaging, microwave tomography, and microwave resonance. Microwave imaging allows for the visualization of internal structures, while microwave tomography provides three-dimensional images of the material. Microwave resonance techniques measure the resonant frequencies to detect hidden defects or inconsistencies within the material.4. Applications of MNDTThe versatility of MNDT techniques enables their applications in a wide range of industries. In the aerospace industry, MNDT plays a critical role in inspecting composite materials used in aircraft construction, ensuring structural integrity and safety. In the field of medicine, microwave non-destructive testing is utilized for the detection of tumors and abnormalities in tissues. Additionally, MNDT techniques find applications in evaluating the quality of construction materials, such as concrete and asphalt.5. Advantages and ChallengesOne of the main advantages of microwave non-destructive testing is its ability to provide rapid and non-invasive evaluations. This significantly reduces the time and cost associated with conventional destructive testing methods. Moreover, MNDT can penetrate through several centimeters of material, enabling the detection of defects hidden beneath the surface.However, MNDT also faces challenges such as limited resolution and difficulty in interpreting complex data. Ongoing research aims to overcome these challenges and further enhance the capabilities of microwave non-destructive testing.6. ConclusionMicrowave non-destructive testing has emerged as a valuable technique for evaluating the internal properties and quality of materials. Its non-invasive nature, combined with its applications in various industries, makes MNDT an indispensable tool for quality assurance and defect detection. Although challenges exist, ongoing advancements aim to improve MNDT techniques and instruments, opening doors for even wider applications in the future.References:(References have been omitted as per the given instructions)。
- 1、下载文档前请自行甄别文档内容的完整性,平台不提供额外的编辑、内容补充、找答案等附加服务。
- 2、"仅部分预览"的文档,不可在线预览部分如存在完整性等问题,可反馈申请退款(可完整预览的文档不适用该条件!)。
- 3、如文档侵犯您的权益,请联系客服反馈,我们会尽快为您处理(人工客服工作时间:9:00-18:30)。
The resonator and sample are rigidly mounted in the tailstock of a dilution fridge in a superconducting
.
Both
results require that σxx(ω) ≫ σxDxC , a condition which
is satisfied across much of the IQHE plateaus. Because
of its simplicity, this result implies that measurements of
(February 1, 2008)
We measure the longitudinal conductivity σxx at frequencies 1.246 GHz ≤ f ≤ 10.05 GHz over a range of temperatures 235 mK ≤ T ≤ 4.2 K with particular emphasis on the Quantum Hall plateaus. We find that Re(σxx) scales linearly with frequency for a range of magnetic field around the center of the plateaus, i.e. where σxx(ω) ≫ σxDxC. The width of this scaling region decreases with higher temperature and vanishes by 1.2 K altogether. Comparison between localization length determined from σxx(ω) and DC measurements on the same wafer show good agreement.
perpendicular magnetic field (B). Measurements of the
longitudinal conductivity (σxx) at finite temperature (T )
show that for a narrow range of B corresponding to the
sistent with Equation 2 and are in agreement with DC
measurements of ξ based on Equation 1.
The method we use is as follows. The sample is
mounted at one end of a coaxial resonator and by moni-
transmission line so to first order, the change in width of
the resonant absorption, ∆W , is directly proportional to
the real part of σxx, i.e.
∆W
=
f0 2π
4Re(Gs)Z0 1 + Ct/Cc
be a useful consistency check of current hopping theory.
In this frequency range, we know of only 3 experiments
[12–15] of which, Engel et al. [12] and Balaban et al.
toring the amplitude of the reflected signal as f is swept
through resonance, we extract the the real and imagi-
nary parts of σxx. The resonator has a quality factor of approximately 1600 at helium temperatures and is
arXiv:cond-mat/0012387v1 [cond-mat.mes-hall] 20 Dec 2000
Frequency Scaling of Microwave Conductivity in the Integer Quantum Hall Effect Minima
R. M. Lewis, J. P. Carini Department of Physics, Indiana University, Bloomington, Indiana 47405
the center of the plateaus. Thus, as T −→ 0, conduction
in the plateaus takes the form of hopping and σxx ≪
e2 2h
[5,6].
When Coulomb effects are important,
the
DC
hopping conduction obeys
σxx(T ) =
σ0 T
1
e−(T0/T ) 2
where T0 =
6.2 e2 4πǫ0 ǫkB ξ (ν )
(1)
in a variety of measurements [7,8]. And, because T0 relates inversely to ξ, fitting for T0 is the usual method of
The Integer Quantum Hall Effect (IQHE) [1,2] offers a
system in which the disorder of a 2 dimensional electron
gas (2DEG) can, in effect, be tuned by adjusting the
measuring this quantity in the IQHE.
In the limit where frequency f
≈
kB T h
hopping conduc-
tion should be dominated by the absorption of incident
photons. For temperatures below 1 Kelvin, these pho-
Polyakov and Shklovskii [10] have shown that Equation
2 holds in the IQHE for the limit hf ≪ kBT but that
in the zero tempature limit, hf
≫ kBT , k =
2π 3
[13] use configurations that give insufficient sensitivity
when σxx is small. Very recently, Holhs et al. [15] have addressed the issues in Equation 2, finding Re{σxx(ω)} ∼ ω.
σxx across the plateau can be used to find ξ. However,
if strong Coulomb effects are absent, Mott [11] predicts σ(ω) ∼ ω2 for disordered hopping models independent of
fashioned from a piece of copper coaxial cable with a
silver–plated center conductor. The resonant frequencies
are set by the length of the resonator and correspond
∝
Re(σxx)
(3)
Here f0 is the fundamental frequency and Z0 = 50 Ω, the impedance of the resonator. Our modeling of the
1
impedances at the sample end of the resonator includes the conductance of the 2DEG, Gs, in parallel with the coupling capacitance, Cc, to the resonator, both in series with the capacitance of the GaAS substrate, Ct. The value of ∆W and fres are found at each magnetic field point by using a four parameter least squares fit on the
transition between Hall plateaus the system is weakly
conducting, and the localization length (ξ) is said to have
exceeded
the
dephasing
length
lφ
[3,4]
and
σxx
tons are in the microwave frequency range, f ≤ 20 GHz.