chapter9-EC
财务报表Chapter讲诉

5.
6.
9-7
The Projection Process
Target Corporation Projected Income Statement
1. 2. 3. 4. 5.
Sales: $52,204 = $46,839 x 1.11455 Gross profit: $17,157 = $52,204 x 32.866% Cost of goods sold: $35,047 = $52,204 - $17,157 Selling, general, and administrative: $11,741 = $52,204 x 22.49% Depreciation and amortization: $1,410 = $22,272 (beginning-period PP&E gross) x 6.333% 6. Interest: $493 = $9,538 (beginning-period interest-bearing debt) x 5.173% 7. Income before tax: $3,513 = $17,157 - $11,741 - $1,410 - $493 8. Tax expense: $1,328 = $3,513 x 37.809% 9. Extraordinary and discontinued items: none 10. Net income: $2,185 = $3,513 - $1,328
Financial Statement Analysis
K R Subramanyam John J Wild
McGraw-Hill/Irwin
Copyright © 2009 by The McGraw-Hill Companies, Inc. All rights reserved.
Chapter 9 店头POP布置广告促销

五、實例 (14/43)
五、實例 (15/43)
五、實例 (16/43)
五、實例 (17/43)
五、實例 (18/43)
五、實例 (19/43)
五、實例 (20/43)
五、實例 (21/43)
五、實例 (22/43)
五、實例 (23/43)
五、實例 (24/43)
五、實例 (25/43)
四、執行注意要點 (2/2)
• 4.目前各大品牌的置物專櫃或專區已愈做 愈大,這是大品牌的談判優勢點。 • 5.賣場POP雖然很重要,但應該搭配其他 促銷活動,例如贈品、抽獎、折扣等其 他活動,才會發揮更大的效益。 • 6.對零售流通業者而言,將賣場的布置視 覺感,提高到令消費者彷彿置身在一個 快樂、豐富、便宜、實惠與清潔明亮的 購物環境中,是一個很大的努力目標。
三、效益 (1/1)
• 根據國內外行銷研究的結果顯示,大概 有40%高比例的消費者,是在賣場才決 定他要買哪些品樣的產品。 • 廣告效果並不是全部,而現場(賣場) 的感受、認知、衝動、利益或氣氛等, 也扮演影響購買決策的重要因素。 • 店頭(賣場)POP的效益是存在的,否 則也不會有現在賣場內那麼熱鬧與活潑 的現場感。
Chapter 9 店頭POP佈置廣告促銷
Chapter 9 店頭POP佈置廣告促銷 (1/1)
• • • • • 一、店頭POP的種類呈現 二、店頭POP優點 三、效益 四、執行注意要點 五、實例
一、店頭POP的種類呈現 (1/1)
• 一般來說,店頭(賣場)POP的種類呈 現,大致有以下幾種:
五、實例 (38/43)
五、實例 (39/43)
五、實例 (40/43)
五、實例 (41/43)
Preview Work for Chapter 9

Unit 5 HumanitiesHumanities —the study of human constructs and concerns (such as philosophy, language, and the arts) rather than natural processes or social relations.Chapter 9 The Story of Fairy Tales1. CHAPTER GOALSLearn about the reasons that fairy tales developed and continue to existLearn a Listening Strategy: Recognize lecture language that signals when information is importantLearn a Note-taking Strategy: Highlight key ideas in your notes2. Think about the topicRead this section from a psychology textbook about the themes found in fairy tales.Common Themes in Fairy TalesA child’s world is rich with stories. The tales they see in movies, read in books, or that their parents and grandparents tell them take them on magical journeys. They take them to many different places, where they meet many strange and wonderful people, animals, or creatures. When we take a step back, however, it becomes clear that the stories are not quite as different from each other as they might first appear.Fairy tales —these first magical stories told to children —contain many similar main ideas, or themes. These themes are also similar across cultures. No matter where a child is born, his fairy tales probably have characters like a poor servant girl who marries a prince, starving children who find a new home, or a young peasant boy who discovers that he is actually a lost king. In fact, the most popular theme in fairy tales involves a person rising above his or her low position in life.Another very common theme is caution. The main character, or protagonist, often receives a warning: “Be home before midnight,” says the godmother to Cinderella. Fairy tales teach the young listener the terrible consequences of ignoring warnings. The message is predictable and clear: if you ignore the warning, you will pay the penalty.The plots, or story lines, of fairy tales vary, but they usually follow the same sort of progression:• The protagonist does not obey a warning or is unfairly treated. He is sent away or runs away.•He must complete a difficult or dangerous task, or must suffer in some other way, in order to make everything right again.• He returns home in a better condition than before.At some point in the fairy tale, something magical happens. The protagonist meets mysterious creatures. Perhaps he rubs a lamp and a genie appears to grant his wishes. The creatures sometimes give him helpful magical gifts with special powers, like a cape that makes him invisible.There is danger and drama, but most fairy tales end happily. The protagonist is successful and rewarded with marriage, money, survival, and wisdom. And the audience learns an important lesson about life without ever leaving home.Check your comprehension3. Answer the questions about the reading on page 91. Then discuss your answers with a partner.1. What is the definition of a fairy tale?2. What are two of the most popular themes in fairy tales?3. What is one of the lessons that children learn from fairy tales?Expand your vocabulary4. Match the words from the reading with their definitions. These words will also be in the lecture. Look back at the reading on page 91 to checkyour answers.1. magical a. the people listening to a story2. creature b. one of the players in a story3. theme c. a living thing in a fantasy story that is not a person4. character d. strange and removed from everyday life5. protagonist e. the main subject or idea in a story6. consequence f. the events that form the main action of a story7. plot g. something that happens as result of an action8. audience h. the main player in a story5. Circle the phrase that best completes the meaning of the underlined idiom.We know that fairy tales from different cultures have different characters and settings, but when we take a step back we understand things _________.a. in a new wayb. in a better wayc. in the wrong wayDiscuss the reading6. Discuss these questions in a small group. Share your answers with the class.1. What are some of the lessons that you remember learning from fairy tales?2. What are some of the magical objects and creatures that you remember from fairy tales? As a child, which of these things did you wish could have or meet?7. Study the meaning of these general academic words. Then fill in the blanks below with the correct words in the correct form. These words will be used in the lecture.purpose: the reason for doing or making somethingassume: to think that something is true although there is no proofPeople _________ many things about fairy tales without really thinking about them. Let’s look at the ________ of fairy tales from an educational point of view.8. Read this transcript from a lecture on fairy tales. Take notes and highlight key points and important information.I’d like to focus on one of the common themes that we see in fairy tales, ... one idea that runs throughout every story —we must be cautious… Let me repeat that idea,… we must live cautiously. In these tales, peace and happiness can only exist if warnings are obeyed. This idea is key to fairy tales.Let’s look at a few examples. Cinderella may have a magical dress, but she must be back when the clock strikes twelve. The king may invite fairies to the party for the new princess, but he must invite ALL the fairies or terrible results will follow.This idea that we see in every story is very important,. . . the idea that all happiness depends on one action. All will be lost if one bad thing happens.。
小妇人各章节内容英语概括
小妇人各章节内容英语概括Chapter 1- Amy, the youngest March sister, is preparing for a party while her mother and sisters are out. She is disappointed that her nose is red and begins to worry about her appearance.Chapter 2- The March sisters, Meg, Jo, Beth, and Amy, struggle with poverty while their father is away serving as a chaplain in the Civil War. They receive a surprise visit from their wealthy Aunt March.Chapter 3- Jo, the tomboyish second eldest sister, learns that her short story has been rejected by a publisher. She decides to pursue her passion for writing and declares that she will not conform to society's expectations.Chapter 4- The March sisters befriend their wealthy neighbor, Theodore "Laurie" Laurence, who becomes an honorarymember of their family. Meg attends a party with Laurie and meets John Brooke, Laurie's tutor.Chapter 5- Meg is invited to attend a dance at the Moffats' home, where she meets the charming Mr. Brooke once again. However, she becomes embarrassed by her simple dress and feels out of place among the wealthier guests.Chapter 6- Jo becomes friends with Laurie and listens to his troubles. She offers to take him to a play, despite his protests, and they enjoy a lively evening together.Chapter 7- The March sisters put on a play and invite Laurie to watch. Jo portrays a male character and is praised for her performance. After the play, the girls receive a surprise visit from Marmee, their mother.Chapter 8- Marmee encourages the girls to help those less fortunate by donating their Christmas breakfast to a poor family. The sisters agree to make sacrifices and find joy in giving to others.Chapter 9- Amy becomes envious of her older sisters and seeks to improve her social standing. She attempts to actlike a lady but ends up humiliated at a party when her hand is accidentally burned.Chapter 10- Jo takes a job as a governess to help support her family, but she struggles to fit in with the wealthy family she works for. She maintains her independent spirit but faces challenges in her new role.。
Chapter9

Most ridiculous foreign laws:
6. In Florida, unmarried women who parachute on a Sunday could be jailed (6%) 7. In Vermont, women must obtain written permission from their husbands to wear false teeth (6%) 8. In Milan, it is a legal requirement to smile at all times, except funerals or hospital visits (5%) 9. In Japan, there is no age of consent (5%) 10. In France, it is illegal to name a pig Napoleon (4%)
Most ridiculous British laws: Nhomakorabea
6. In the UK a pregnant woman can legally relieve herself anywhere she wants, including in a policeman's helmet (4%) 7. The head of any dead whale found on the British coast automatically becomes the property of the King, and the tail of the Queen (3.5%) 8. It is illegal not to tell the tax man anything you do not want him to know, but legal not to tell him information you do not mind him knowing (3%) 9. It is illegal to enter the Houses of Parliament in a suit of armour 10. In the city of York it is legal to murder a Scotsman within the ancient city walls, but only if he is carrying a bow and arrow (2%)
chapter-9-Lesson-Planning

案例一
PEP BOOK3 Unit Two ( Pa从rt B教: L师et’的s角tal度k) 出发,“使学生…” “发
展学生的…” “训练学生的…” “培养
Teaching aims: 1. Aims on the knowledge
学生的…”,目标主体均为教师
(1) To enable the children to grasp the usage of the single and plural forms
5) By lesson planning, teachers also become aware of the teaching aids that are needed.
6) Lesson planning is a good practice and a sign of
professionalism. 7) Lesson planning will enable the teacher to improve
The time and date of the lesson;
The time duration of the lesson
第12页,共30页。
5.2 Teaching Aims
1. to learn the use of comparative form of adjectives
Able to use a number of comparative adjectives to compare things or people
Micro planning is planning for a specific unit or a lesson. Teachers may have different ways of writing their own lesson plans.
现代英语语言学理论 CHAPTER 9

Cui Jianbin, Department of Foreign Studies, WTU
Chapter Nine
A Study on Modern English Linguistics: Language and Culture
现代英语语言学理论
Chapter Introduction Language in Poetry Further Reading
Discussion topics(10mins.)
1. What is literature? 2. What are possible literature forms? 3. What is the possible relationship between language
and literature? 4. What is the difference between literature language
and general language?
现代英语语言学理论
CLASS PRESENTATION
我们要美丽的生命不断繁殖, 能这样,美丽的玫瑰才不会消亡……
关关雎鸠,在河之州; 窈窕淑女,君子好逑。
现代英语语言学理论
CLASS PRESENTATION
Stoning
Cui Jianbin
April 10th—May 1st Friday 98
Advanced 50mins X2
现代英语语言学理论
现代英语语言学理论
现代英语语言学理论
Section One: : Features of Literary Language
Outline of Procedures
现代英语语言学理论
曼昆-宏观经济经济学第九版-英文原版答案9
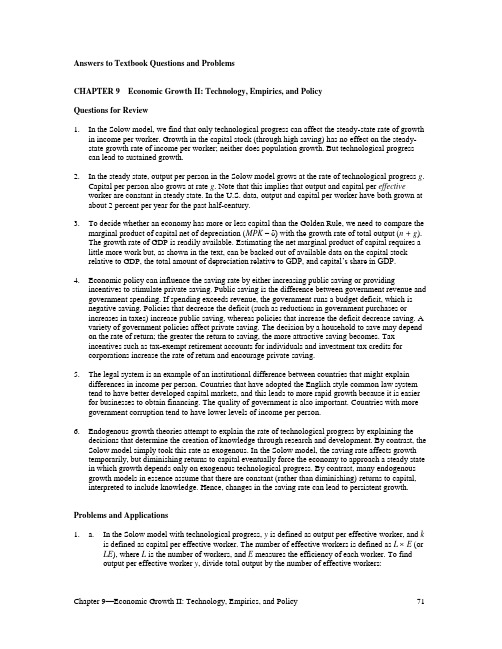
Answers to Textbook Questions and ProblemsCHAPTER 9 Economic Growth II: Technology, Empirics, and PolicyQuestions for Review1. In the Solow model, we find that only technological progress can affect the steady-state rate of growthin income per worker. Growth in the capital stock (through high saving) has no effect on the steady-state growth rate of income per worker; neither does population growth. But technological progress can lead to sustained growth.2. In the steady state, output per person in the Solow model grows at the rate of technological progress g.Capital per person also grows at rate g. Note that this implies that output and capital per effectiveworker are constant in steady state. In the U.S. data, output and capital per worker have both grown at about 2 percent per year for the past half-century.3. To decide whether an economy has more or less capital than the Golden Rule, we need to compare themarginal product of capital net of depreciation (MPK –δ) with the growth rate of total output (n + g).The growth rate of GDP is readily available. Estimating the net marginal product of capital requires a little more work but, as shown in the text, can be backed out of available data on the capital stock relative to GDP, the total amount o f depreciation relative to GDP, and capital’s share in GDP.4. Economic policy can influence the saving rate by either increasing public saving or providingincentives to stimulate private saving. Public saving is the difference between government revenue and government spending. If spending exceeds revenue, the government runs a budget deficit, which is negative saving. Policies that decrease the deficit (such as reductions in government purchases or increases in taxes) increase public saving, whereas policies that increase the deficit decrease saving. A variety of government policies affect private saving. The decision by a household to save may depend on the rate of return; the greater the return to saving, the more attractive saving becomes. Taxincentives such as tax-exempt retirement accounts for individuals and investment tax credits forcorporations increase the rate of return and encourage private saving.5. The legal system is an example of an institutional difference between countries that might explaindifferences in income per person. Countries that have adopted the English style common law system tend to have better developed capital markets, and this leads to more rapid growth because it is easier for businesses to obtain financing. The quality of government is also important. Countries with more government corruption tend to have lower levels of income per person.6. Endogenous growth theories attempt to explain the rate of technological progress by explaining thedecisions that determine the creation of knowledge through research and development. By contrast, the Solow model simply took this rate as exogenous. In the Solow model, the saving rate affects growth temporarily, but diminishing returns to capital eventually force the economy to approach a steady state in which growth depends only on exogenous technological progress. By contrast, many endogenous growth models in essence assume that there are constant (rather than diminishing) returns to capital, interpreted to include knowledge. Hence, changes in the saving rate can lead to persistent growth. Problems and Applications1. a. In the Solow model with technological progress, y is defined as output per effective worker, and kis defined as capital per effective worker. The number of effective workers is defined as L E (or LE), where L is the number of workers, and E measures the efficiency of each worker. To findoutput per effective worker y, divide total output by the number of effective workers:Y LE =K12(LE)12LEY LE =K12L12E12LEY LE =K12 L1E1Y LE =KLE æèççöø÷÷12y=k12b. To solve for the steady-state value of y as a function of s, n, g, and δ, we begin with the equationfor the change in the capital stock in the steady state:Δk = sf(k) –(δ + n + g)k = 0.The production function ycan also be rewritten as y2 = k. Plugging this production functioninto the equation for the change in the capital stock, we find that in the steady state:sy –(δ + n + g)y2 = 0.Solving this, we find the steady-state value of y:y* = s/(δ + n + g).c. The question provides us with the following information about each country:Atlantis: s = 0.28 Xanadu: s = 0.10n = 0.01 n = 0.04g = 0.02 g = 0.02δ = 0.04δ = 0.04Using the equation for y* that we derived in part (a), we can calculate the steady-state values of yfor each country.Developed country: y* = 0.28/(0.04 + 0.01 + 0.02) = 4Less-developed country: y* = 0.10/(0.04 + 0.04 + 0.02) = 12. a. In the steady state, capital per effective worker is constant, and this leads to a constant level ofoutput per effective worker. Given that the growth rate of output per effective worker is zero, this means the growth rate of output is equal to the growth rate of effective workers (LE). We know labor grows at the rate of population growth n and the efficiency of labor (E) grows at rate g. Therefore, output grows at rate n+g. Given output grows at rate n+g and labor grows at rate n, output perworker must grow at rate g. This follows from the rule that the growth rate of Y/L is equal to thegrowth rate of Y minus the growth rate of L.b. First find the output per effective worker production function by dividing both sides of theproduction function by the number of effective workers LE:Y LE =K 13(LE )23LE YLE =K 13L 23E 23LEY LE =K 13L 13E 13Y LE =K LE æèçöø÷13y =k 13To solve for capital per effective worker, we start with the steady state condition:Δk = sf (k ) – (δ + n + g )k = 0.Now substitute in the given parameter values and solve for capital per effective worker (k ):Substitute the value for k back into the per effective worker production function to find output per effective worker is equal to 2. The marginal product of capital is given bySubstitute the value for capital per effective worker to find the marginal product of capital is equal to 1/12.c. According to the Golden Rule, the marginal product of capital is equal to (δ + n + g) or 0.06. In the current steady state, the marginal product of capital is equal to 1/12 or 0.083. Therefore, we have less capital per effective worker in comparison to the Golden Rule. As the level of capital per effective worker rises, the marginal product of capital will fall until it is equal to 0.06. To increase capital per effective worker, there must be an increase in the saving rate.d. During the transition to the Golden Rule steady state, the growth rate of output per worker will increase. In the steady state, output per worker grows at rate g . The increase in the saving rate will increase output per effective worker, and this will increase output per effective worker. In the new steady state, output per effective worker is constant at a new higher level, and output per worker is growing at rate g . During the transition, the growth rate of output per worker jumps up, and then transitions back down to rate g .3. To solve this problem, it is useful to establish what we know about the U.S. economy: • A Cobb –Douglas production function has the form y = k α, where α is capital’s share of income.The question tells us that α = 0.3, so we know that the production function is y = k 0.3.• In the steady state, we know that the growth rate of output equals 3 percent, so we know that (n +g ) = 0.03.• The deprec iation rate δ = 0.04. • The capital –output ratio K/Y = 2.5. Because k/y = [K /(LE )]/[Y /(LE )] = K/Y , we also know that k/y =2.5. (That is, the capital –output ratio is the same in terms of effective workers as it is in levels.)a. Begin with the steady-state condition, sy = (δ + n + g)k. Rewriting this equation leads to a formulafor saving in the steady state:s = (δ + n + g)(k/y).Plugging in the values established above:s = (0.04 + 0.03)(2.5) = 0.175.The initial saving rate is 17.5 percent.b. We know from Chapter 3 that with a Cobb–Douglas production function, capital’s share ofincome α = MPK(K/Y). Rewriting, we haveMPK = α/(K/Y).Plugging in the values established above, we findMPK = 0.3/2.5 = 0.12.c. We know that at the Golden Rule steady state:MPK = (n + g + δ).Plugging in the values established above:MPK = (0.03 + 0.04) = 0.07.At the Golden Rule steady state, the marginal product of capital is 7 percent, whereas it is 12 percent in the initial steady state. Hence, from the initial steady state we need to increase k to achieve the Golden Rule steady state.d. We know from Chapter 3 that for a Cobb–Douglas production function, MPK = α (Y/K). Solvingthis for the capital–output ratio, we findK/Y = α/MPK.We can solve for the Golden Rule capital–output ratio using this equation. If we plug in the value0.07 for the Golden Rule steady-state marginal product of capital, and the value 0.3 for α, we findK/Y = 0.3/0.07 = 4.29.In the Golden Rule steady state, the capital–output ratio equals 4.29, compared to the current capital–output ratio of 2.5.e. We know from part (a) that in the steady states = (δ + n + g)(k/y),where k/y is the steady-state capital–output ratio. In the introduction to this answer, we showed that k/y = K/Y, and in part (d) we found that the Golden Rule K/Y = 4.29. Plugging in this value and those established above:s = (0.04 + 0.03)(4.29) = 0.30.To reach the Golden Rule steady state, the saving rate must rise from 17.5 to 30 percent. Thisresult implies that if we set the saving rate equal to the share going to capital (30 percent), we will achieve the Golden Rule steady state.4. a. In the steady state, we know that sy = (δ + n + g)k. This implies thatk/y = s/(δ + n + g).Since s, δ, n, and g are constant, this means that the ratio k/y is also constant. Since k/y =[K/(LE)]/[Y/(LE)] = K/Y, we can conclude that in the steady state, the capital–output ratio isconstant.b. We know that capital’s share of income = MPK ⨯ (K/Y). In the steady state, we know from part (a)that the capital–output ratio K/Y is constant. We also know from the hint that the MPK is afunction of k, which is constant in the steady state; therefore the MPK itself must be constant.Thus, capital’s share of income is constant. Labor’s share of income is 1 – [C apital’s Share].Hence, if capital’s share is constant, we see that labor’s share of income is also constant.c. We know that in the steady state, total income grows at n + g, defined as the rate of populationgrowth plus the rate of technological change. In part (b) we showed that labor’s and capital’s share of income is constant. If the shares are constant, and total income grows at the rate n + g, thenlabor income and capital income must also grow at the rate n + g.d. Define the real rental price of capital R asR = Total Capital Income/Capital Stock= (MPK ⨯K)/K= MPK.We know that in the steady state, the MPK is constant because capital per effective worker k isconstant. Therefore, we can conclude that the real rental price of capital is constant in the steadystate.To show that the real wage w grows at the rate of technological progress g, defineTLI = Total Labor IncomeL = Labor ForceUsing the hint that the real wage equals total labor income divided by the labor force:w = TLI/L.Equivalently,wL = TLI.In terms of percentage changes, we can write this asΔw/w + ΔL/L = ΔTLI/TLI.This equation says that the growth rate of the real wage plus the growth rate of the labor forceequals the growth rate of total labor income. We know that the labor force grows at rate n, and,from part (c), we know that total labor income grows at rate n + g. We, therefore, conclude that the real wage grows at rate g.5. a. The per worker production function is F (K, L )/L = AK α L 1–α/L = A (K/L )α = Ak α b. In the steady state, Δk = sf (k ) – (δ + n + g )k = 0. Hence, sAk α = (δ + n + g )k , or, after rearranging:k *=sA d +n +g éëêêùûúúa 1-a æèççöø÷÷.Plugging into the per-worker production function from part (a) givesy *=A a 1-a æèççöø÷÷s d +n +g éëêêùûúúa 1-a æèççöø÷÷.Thus, the ratio of steady-state income per worker in Richland to Poorland isy *Richland/y *Poorland ()=s Richland d +n Richland +g /s Poorlandd +n Poorland +g éëêêùûúúa1-a =0.320.05+0.01+0.02/0.100.05+0.03+0.02éëêêùûúúa1-c. If α equals 1/3, then Richland should be 41/2, or two times, richer than Poorland.d. If 4a 1-a æèççöø÷÷= 16, then it must be the case that a 1-a æèççöø÷÷, which in turn requires that α equals 2/3.Hence, if the Cobb –Douglas production function puts 2/3 of the weight on capital and only 1/3 on labor, then we can explain a 16-fold difference in levels of income per worker. One way to justify this might be to think about capital more broadly to include human capital —which must also be accumulated through investment, much in the way one accumulates physical capital.6. How do differences in education across countries affect the Solow model? Education is one factoraffecting the efficiency of labor , which we denoted by E . (Other factors affecting the efficiency of labor include levels of health, skill, and knowledge.) Since country 1 has a more highly educated labor force than country 2, each worker in country 1 is more efficient. That is, E 1 > E 2. We will assume that both countries are in steady state. a. In the Solow growth model, the rate of growth of total income is equal to n + g , which isindependent of the work force’s level of education. The two countries will, thus, have the same rate of growth of total income because they have the same rate of population growth and the same rate of technological progress.b. Because both countries have the same saving rate, the same population growth rate, and the samerate of technological progress, we know that the two countries will converge to the same steady-state level of capital per effective worker k *. This is shown in Figure 9-1.Hence, output per effective worker in the steady state, which is y* = f(k*), is the same in bothcountries. But y* = Y/(L E) or Y/L = y*E. We know that y* will be the same in both countries, but that E1 > E2. Therefore, y*E1 > y*E2. This implies that (Y/L)1 > (Y/L)2. Thus, the level of incomeper worker will be higher in the country with the more educated labor force.c. We know that the real rental price of capital R equals the marginal product of capital (MPK). Butthe MPK depends on the capital stock per efficiency unit of labor. In the steady state, bothcountries have k*1= k*2= k* because both countries have the same saving rate, the same population growth rate, and the same rate of technological progress. Therefore, it must be true that R1 = R2 = MPK. Thus, the real rental price of capital is identical in both countries.d. Output is divided between capital income and labor income. Therefore, the wage per effectiveworker can be expressed asw = f(k) –MPK • k.As discussed in parts (b) and (c), both countries have the same steady-state capital stock k and the same MPK. Therefore, the wage per effective worker in the two countries is equal.Workers, however, care about the wage per unit of labor, not the wage per effective worker.Also, we can observe the wage per unit of labor but not the wage per effective worker. The wageper unit of labor is related to the wage per effective worker by the equationWage per Unit of L = wE.Thus, the wage per unit of labor is higher in the country with the more educated labor force.7. a. In the two-sector endogenous growth model in the text, the production function for manufacturedgoods isY = F [K,(1 –u) EL].We assumed in this model that this function has constant returns to scale. As in Section 3-1,constant returns means that for any positive number z, zY = F(zK, z(1 –u) EL). Setting z = 1/EL,we obtainY EL =FKEL,(1-u)æèççöø÷÷.Using our standard definitions of y as output per effective worker and k as capital per effective worker, we can write this asy = F[k,(1 –u)]b. To begin, note that from the production function in research universities, the growth rate of laborefficiency, ΔE/E, equals g(u). We can now follow the logic of Section 9-1, substituting thefunction g(u) for the constant growth rate g. In order to keep capital per effective worker (K/EL) constant, break-even investment includes three terms: δk is needed to replace depreciating capital, nk is needed to provide capital for new workers, and g(u) is needed to provide capital for thegreater stock of knowledge E created by research universities. That is, break-even investment is [δ + n + g(u)]k.c. Again following the logic of Section 9-1, the growth of capital per effective worker is thedifference between saving per effective worker and break-even investment per effective worker.We now substitute the per-effective-worker production function from part (a) and the function g(u) for the constant growth rate g, to obtainΔk = sF [k,(1 –u)] – [δ + n + g(u)]kIn the steady state, Δk = 0, so we can rewrite the equation above assF [k,(1 –u)] = [δ + n + g(u)]k.As in our analysis of the Solow model, for a given value of u, we can plot the left and right sides of this equationThe steady state is given by the intersection of the two curves.d. The steady state has constant capital per effective worker k as given by Figure 9-2 above. We alsoassume that in the steady state, there is a constant share of time spent in research universities, so u is constant. (After all, if u were not constant, it wouldn’t be a ―steady‖ state!). Hence, output per effective worker y is also constant. Output per worker equals yE, and E grows at rate g(u).Therefore, output per worker grows at rate g(u). The saving rate does not affect this growth rate.However, the amount of time spent in research universities does affect this rate: as more time is spent in research universities, the steady-state growth rate rises.e. An increase in u shifts both lines in our figure. Output per effective worker falls for any givenlevel of capital per effective worker, since less of each worker’s time is spent producingmanufactured goods. This is the immediate effect of the change, since at the time u rises, thecapital stock K and the efficiency of each worker E are constant. Since output per effective worker falls, the curve showing saving per effective worker shifts down.At the same time, the increase in time spent in research universities increases the growth rate of labor efficiency g(u). Hence, break-even investment [which we found above in part (b)] rises at any given level of k, so the line showing breakeven investment also shifts up.Figure 9-3 shows these shifts.In the new steady state, capital per effective worker falls from k1 to k2. Output per effective worker also falls.f. In the short run, the increase in u unambiguously decreases consumption. After all, we argued inpart (e) that the immediate effect is to decrease output, since workers spend less time producingmanufacturing goods and more time in research universities expanding the stock of knowledge.For a given saving rate, the decrease in output implies a decrease in consumption.The long-run steady-state effect is more subtle. We found in part (e) that output per effective worker falls in the steady state. But welfare depends on output (and consumption) per worker, not per effective worker. The increase in time spent in research universities implies that E grows faster.That is, output per worker equals yE. Although steady-state y falls, in the long run the fastergrowth rate of E necessarily dominates. That is, in the long run, consumption unambiguously rises.Nevertheless, because of the initial decline in consumption, the increase in u is not unambiguously a good thing. That is, a policymaker who cares more about current generationsthan about future generations may decide not to pursue a policy of increasing u. (This is analogous to the question considered in Chapter 8 of whether a policymaker should try to reach the GoldenRule level of capital per effective worker if k is currently below the Golden Rule level.)8. On the World Bank Web site (), click on the data tab and then the indicators tab.This brings up a large list of data indicators that allows you to compare the level of growth anddevelopment across countries. To explain differences in income per person across countries, you might look at gross saving as a percentage of GDP, gross capital formation as a percentage of GDP, literacy rate, life expectancy, and population growth rate. From the Solow model, we learned that (all else the same) a higher rate of saving will lead to higher income per person, a lower population growth rate will lead to higher income per person, a higher level of capital per worker will lead to a higher level of income per person, and more efficient or productive labor will lead to higher income per person. The selected data indicators offer explanations as to why one country might have a higher level of income per person. However, although we might speculate about which factor is most responsible for thedifference in income per person across countries, it is not possible to say for certain given the largenumber of other variables that also affect income per person. For example, some countries may have more developed capital markets, less government corruption, and better access to foreign directinvestment. The Solow model allows us to understand some of the reasons why income per person differs across countries, but given it is a simplified model, it cannot explain all of the reasons why income per person may differ.More Problems and Applications to Chapter 91. a. The growth in total output (Y) depends on the growth rates of labor (L), capital (K), and totalfactor productivity (A), as summarized by the equationΔY/Y = αΔK/K + (1 –α)ΔL/L + ΔA/A,where α is capital’s share of output. We can look at the effect on output of a 5-percent increase in labor by setting ΔK/K = ΔA/A = 0. Since α = 2/3, this gives usΔY/Y = (1/3)(5%)= 1.67%.A 5-percent increase in labor input increases output by 1.67 percent.Labor productivity is Y/L. We can write the growth rate in labor productivity asD Y Y =D(Y/L)Y/L-D LL.Substituting for the growth in output and the growth in labor, we findΔ(Y/L)/(Y/L) = 1.67% – 5.0%= –3.34%.Labor productivity falls by 3.34 percent.To find the change in total factor productivity, we use the equationΔA/A = ΔY/Y –αΔK/K – (1 –α)ΔL/L.For this problem, we findΔA/A = 1.67% – 0 – (1/3)(5%)= 0.Total factor productivity is the amount of output growth that remains after we have accounted for the determinants of growth that we can measure. In this case, there is no change in technology, so all of the output growth is attributable to measured input growth. That is, total factorproductivity growth is zero, as expected.b. Between years 1 and 2, the capital stock grows by 1/6, labor input grows by 1/3, and output growsby 1/6. We know that the growth in total factor productivity is given byΔA/A = ΔY/Y –αΔK/K – (1 –α)ΔL/L.Substituting the numbers above, and setting α = 2/3, we findΔA/A = (1/6) – (2/3)(1/6) – (1/3)(1/3)= 3/18 – 2/18 – 2/18= – 1/18= –0.056.Total factor productivity falls by 1/18, or approximately 5.6 percent.2. By definition, output Y equals labor productivity Y/L multiplied by the labor force L:Y = (Y/L)L.Using the mathematical trick in the hint, we can rewrite this asD Y Y =D(Y/L)Y/L+D LL.We can rearrange this asD Y Y =D YY-D LL.Substituting for ΔY/Y from the text, we findD(Y/L) Y/L =D AA+aD KK+(1-a)D LL-D LL =D AA+aD KK-aD LL=D AA+aD KK-D LLéëêêùûúúUsing the same trick we used above, we can express the term in brackets asΔK/K –ΔL/L = Δ(K/L)/(K/L)Making this substitution in the equation for labor productivity growth, we conclude thatD(Y/L) Y/L =D AA+aD(K/L)K/L.3. We know the following:ΔY/Y = n + g = 3.6%ΔK/K = n + g = 3.6%ΔL/L = n = 1.8%Capital’s Share = α = 1/3Labor’s Share = 1 –α = 2/3Using these facts, we can easily find the contributions of each of the factors, and then find the contribution of total factor productivity growth, using the following equations:Output = Capital’s+ Labor’s+ Total FactorGrowth Contribution Contribution ProductivityD Y Y =aD KK+(1-a)D LL+D AA3.6% = (1/3)(3.6%) + (2/3)(1.8%) + ΔA/A.We can easily solve this for ΔA/A, to find that3.6% = 1.2% + 1.2% + 1.2%Chapter 9—Economic Growth II: Technology, Empirics, and Policy 81We conclude that the contribution of capital is 1.2 percent per year, the contribution of labor is 1.2 percent per year, and the contribution of total factor productivity growth is 1.2 percent per year. These numbers match the ones in Table 9-3 in the text for the United States from 1948–2002.Chapter 9—Economic Growth II: Technology, Empirics, and Policy 82。
- 1、下载文档前请自行甄别文档内容的完整性,平台不提供额外的编辑、内容补充、找答案等附加服务。
- 2、"仅部分预览"的文档,不可在线预览部分如存在完整性等问题,可反馈申请退款(可完整预览的文档不适用该条件!)。
- 3、如文档侵犯您的权益,请联系客服反馈,我们会尽快为您处理(人工客服工作时间:9:00-18:30)。
交叉算子
在遗传算法中,交叉算子的作用非常重要。一方面,它使得 在原来的群体中的优良个体的特性能够在一定程度上保持,另一 方面,它使得算法能够探索新的基因空间,从而使得新的群体中 的个体具有多样性。 常用算子: 1) 单点交叉
2) 两点交叉
3) 多点交叉 4)均匀交叉
随机的产生一个与父辈个体基因串具有同样长度的二进制串, 其中0 表不交换,1 表示交换。这个二进制串称为交叉模版; 然后根据该模版对两个父辈基因串进行交叉,得到的两个新 基因即为后代新个体。
由于Gj(x)限制了x的取值范围,所以Gj(x)被称为约束 函数。对于带约束的优化问题,可以使用一些方法转 化为无约束的优化问题。
进化策略
二元进化策略(two-membered ecolution strategy)
多元进化策略 (multi-membered evolution strategy)
由概率论知识知,当z向量的n个分量彼此独立时,协方差矩阵可以写成如 下对角阵
当均值向量为0时,相应的正态分布可以写成
步长选择
设随机向量z的长度 S= zi * zi 为步长。步长的选择方法会影响到算法 的性能。特别是会影响到算法的收敛速度。Rechenberg研究了一些类型的 目标函数,如超球面模型。为了达到最高的收敛速度,步长的改变应遵从 1/5成功率: 在迭代过程中,计算与最大值靠近的次数总的迭代次数这一比值。如果 这一比值大于1/5,则步长增大;否则减小步长。
3) 适应度函数的设计
4) 参数控制设定(如群体大小和使用遗传操作的概率等) 5) 遗传操作设计
遗传算法的动态分析
如果在代的演化过程中,遗传算法保留最好的解,并且以算 法以交叉和变异作为随机化算子,则对于一个全局优化问题,随 着演化代数趋向于无穷,遗传算法将以概率1找到全局最优解。
遗传算法的设计与实现
i 1 n
收敛准则 迭代的结束通常以算法不再能够找到更优秀为准则。而在实现时,需要 在每次迭代循环中指明是否要结束。 由于在迭代过程中,解的变异的步长和该解距极值解的距离越来越小, 因此实际中常常用到的一个结束规则时:如果变异的步长已经非常小或每 次迭代生成的解与原解相比差异很小,这时可以认为算法不再可能得到性 能更优的解,因而令算法结束。但这一准则不能保证我们得到极值点。
二元进化策略(只考虑变异和选择):
(1)初始化 生成由两个个体构成的群体。一个作为父辈个体,一个作为后代个体。 个体不同由个体基因不同所决定,这两个个体称为第1代群体。 (2)变异 第g代中的父辈个体P(g)产生了其新后代个体D(g)。新产生的后代个体在基 因上与父辈个体略有不同。其基因差异具有随机性。 (3)选择 由于第g代中父辈个体与其后代个体的基因不同,因此对环境的适应性 也不同。其中只有具有较强的适应性的个体有资格再次被选择作为第g+1 代的父辈个体P(g+1)。然后,在回到(2)。
进 化 计 算
进化计算: 进化策略、进化规划、遗传算法 三者构成主要框架
进化计算的研究起始于50年代。当时几个计算机领域 的科学家独立的开始研究进化系统。其思想是将自然 界中的进化过程引入工程研究领域以解决工程优化问 题。在用进化思想解优化问题时,使用了进化过程中 的遗传、选择等概念,并且把它们作为算子参与优化。
0, 其他
当目标是求g(x)的最大值时,适应度函数的非负性可用如下变 换得到保证
f(x)=
C min g ( x), C min g ( x) 0 0, 其他
遗传算子
遗传算法中包括以下三个基本遗传算子: 选择、交叉和变异
选择算子:
1)适应度比例方法 2)最佳个体保存方法 3)期望值方法 4)排序选择方法 5)联赛选择方法
动态编码
动态编码是当算法收敛到局部极值时增加搜索的精度。 增加精度的办法时在保持串长不变的情况下减小搜索区域。 实数编码 有序串编码 多参数映射编码
可变长编码方法
二维染色体编码
适应度函数
要求:该函数不能为负。
当目标是求函数给g(x)的最小值,而不是最大值时,可以通过 下面的公式 C max g ( x), g ( x) C max f(x)=
可以看出,如上所述周而复始的过程是一个简化了的进化过程。在其中做 了如下假定: 1 ) 某种生物的进化是通过该生物个体构成的群体的进化完成的, 群体中个体数目为常数。 2)原则上,每个个体能无限期地存活,并能无限制地产生后代。 3)变异只发生在某个基因点上,并且个体地基因组成唯一的决定了个体 对环境的适应程度。 4)个体对环境的适应性函数并不随时间的变化而变化。
数学和算法语言描述如下: 1) 初始化 初试生成 xk(0)=(xk1(0),xk2(0),……xkn(0))T , k=1,……,m, xk(0) 是第 k 个父辈个 体,并满足Gj(xk(0)>0),k=1,……m.令g=0. 2) 变异 生成yl(g+1)=xk(g)+z(g*n+l),满足Gj(yl(g+1) )>0;,j=1,2,…,m,l=1,…n. 其中k=
m, 如果 l p * u , p是整数 l(modm ),否则
下图给出了进化策略在二元函数优化问题中相邻两次迭代的示意图
二.遗传算法
基本概念 经过多年发展,遗传算法有许多形式,这里讨论标准遗传算法。 1)基因链码 生物的性状是由生物的遗传基因的链码所决定的。使用遗传算 法时,需要把问题的每一个解编码成为一个基因链码。不妨设 整 数 1552 是 问 题 的 一 个 解 , 我 们 可 以 用 1552 的 二 进 制 形 式 1100001000来表示这个解所对应的基因链码,其中每一位代表 一个基因。 2) 群体 一些个体组成了一个群体,一个群体是若干个个体的集合。由于 每个个体代表了问题的解,所以一个群体就是问题的一些解的集 合。
多元进化策略的生物学过程描述如下:
1) 初始化
生成由m个个体构成的群体。群体中每个个体的不同是由个体的基因的 不同而决定的,该群体被称为第1代群体。
2) 变异
平均每个个体产生n/m个后代。这样共生成n个后代个体。生成的这n个 个体与其各自的父辈个体在基因上略有不同。
3) 选择
每个个体由于对环境的适应性不同而表现出不同的生命力或适应值。N 个个体中只有生命力较强的m个个体成为下一代的父辈个体。回成一个优化问题的两个解。这两个解代表n维欧氏空间的两个点。由 于这两个点位置的不同,决定了其对应的目标函数值的不同。其中目 标函数值较高的解将参与下面步骤的运算。这是第一次迭代。 2) 变异
在第g次迭代中,根据被选择的解xg产生一个新解yg。xg与yg只是在n维 欧氏空间位置略有不同。这两个解所对应的点之差是一个随机向量。
变异过程 z(g)的选取体现了变异过程的特性。根据变异过程特点,要求z(g)是均值 为0,方差较小的随机向量。 我们可以选取z(g)满足正态分布。单变量正态分布概率密度函数如下:
多元正态分布,概率密度函数如下
其中z(g)=(z0,z1……z n)T. 表示多元随机变量,C 是协方差矩阵,n 是向 量维数。由于要求向量的n个分量彼此是独立的,每个分量是零均值的, 这时的多元正态分布概率密度函数有较简单的形式。
标准遗传算法:
1) 令进化代数g=0,并给出初始化群体P(g) 2) 对P(g)中每个个体估值。 3) 从P(g)中选择两个个体,并对这两个个体完成交叉和变异 操作,得到新一代群体P(g+1)。令g=g+1。 4) 如果终止条件满足,则算法结束。否则,转到(2)
遗传算法几个要素:
1) 编码 2) 初始种群设定
。
max F ( x)
其中x Rn,F(x)是x的实值函数。
注:这是一个无约束的最优化问题。而在实际中,我们常 会涉及到带有约束的优化问题
带约束条件的优化问题为 max F ( x) 其中F(x)是x的实值函数, x G Rn 这里 G = {xRn | Gj (x)>0, j=1,2……m}
遗传算法(Genetic Algorithms) 是Holland在60年代提出的, 其同事和学生进一步发展的该算法。由于该算法简单易用, 且对很多优化问题能够较容易地给出令人满意地解,所以 得到广泛地应用,其影响也越来越大。
一.进化策略
进化策略作为一种方法可以用于最优化问题的求解 首先定义描述所要解决的优化问题
多元进化策略
简单的二元进化策略在有些应用问题中可能成功。但对于很多的优化 问题,这不是一个好方法。我们意识到二元进化策略最可能达到的是问题 的极值。能否达到优化函数的最大值,主要依赖于初值的选择。 对二元进化策略改进的一种途径就是采用多元进化策略。
基本算法 首先引进几个符号和概念: 一个群体中父辈个体的数目用m表示 群体中后代个体数目用n表示 群体大小为m+n。 在 二 元 进 化 策 略 中 m=n=1, 即 m+n=1+1=2, 简 记 为 ( 1+1 ) 策 略 。 Rechenberg认为允许m>1,而n=1,这时称为(m+1)策略。 而其更一般的形式是进化策略(m+n)
3)交叉
x1 x2
双亲 1000 10011110 0110 11000110
后代 x1’ 1000 11000110 x2’ 0110 10011110
4)变异
100011000110
100011000010
5) 适应度 生物体对环境的适应程度的不同而表现出不同的生命力。在这 里,每个个体对应于优化问题的一个解xi,每个对应于一个函数值 fi。fi越大,则表明xi越好,即对环境的适应度越高,所以可以用 每个个体的函数值fi作为它对环境的适应度。 6)选择 选择的目的是为了从当前群体中选出优良的个体,使它们有机 会作为父代产生后代个体。判断个体优良与否的准则就是各自的适 应度值。即个体适应度越高,其被选择的机会就越多。