SIMULATION OF NON-CONTACT MEASUREMENT OF THE ELECTRICAL IMPEDANCE USING AN ANATOMICAL MODEL
外文翻译---液压密封完整性调查研究

外文翻译---液压密封完整性调查研究Mechanical Systems and Signal Processing, 2007, 21: 1115–1126A study of hydraulic seal integrityP. Chena, P.S.K. Chua, G.H. LimAbstract: The work described in this paper involved on-line detection of seal defects in a water hydraulic cylinder. An obvious effect of seal defect is internal leakage. Therefore, the approach used was to detect the internal leakage using suitable technique. The technique used involved detecting the acoustic emission (AE) due to the internal leakage. This paper evaluated various parameters of AE signals in terms of their capability in estimating the internal leakage rate in a water hydraulic cylinder. Experiments were carried out to study the characteristics of AE parameters at different internal leakage rates, the parameters including the root-mean-square (rms) value, the count rate, the peak magnitude of power spectral density and the energy. The correlations between these parameters and the internal leakage rate wereanalysed carefully. The results show that energy-based AE parameters, especially the rms value, are more suitable to interpret AE signals generated by internal leakage.Keywords: Acoustic emission; Water hydraulic cylinder; Internal leakage; AE count rate; Root mean square; Power spectral density; AE energy1. IntroductionModern water hydraulics, using tap water as the hydraulic fluid, has gained much interest in the past decade due to its inherent advantages compared to oil hydraulics. These advantages include environment friendliness, good product compatibility and no fire hazards [1, 2]. However, some problems with modern water hydraulics are still to be addressed. One of the most common problems is the relatively large internal leakage in water hydraulic components. For example, a water hydraulic cylinder could suffer from internal leakage across the piston seals. This is due to the very low viscosity of water in comparison with that of hydraulic oil [1, 3]. Therefore, it is important to monitor the internal leakage to achieve optimal performance and reliable and safe operations of water hydraulic systems.The work presented in this paper is part of a project that aims to develop a quantitative model to estimate the internal leakage flow rate in a water hydraulic cylinder by means of AE. It is focused on the internal leakage smaller than 1.0 L/min. In order to model the AE signal generated by the internal leakage, suitable parameters must first be selected to interpret the signal. Therefore, experiments were conducted to study the characteristics of various AE parameters in terms of their effectiveness in estimating the internal leakage rate, as described in this paper.2. Acoustic emissionAE is defined as the transient elastic waves that are generated by the rapid release of energy from localised sources. It has been found that AE signals can be generated by fluid leakage. Pollock and Hsu [10] studied the physical origin of these signals in detail and Goodman et al. [12] reported a variety of AE source mechanisms associated with leakage from vessels, tanks and pipelines. In the case of internal leakage in water hydraulic cylinders, the generation of AE signals is largely attributed to the turbulence induced by the internal leakage. AE signals can be categorised into two basic types. The burst-type AE refers to AE signals corresponding to individual AE events, while the continuous-type AE refers to an apparently sustained signal level from rapidly occurring AE events [16]. AE signals generated by internal leakage in water hydraulic cylinders are of continuous type, as shown in Fig. 1.AE counts are widely used as a practical measure of AE activity. This parameter is defined as the number of times the signal exceeds a counter threshold. For continuous-type AE, AE count rate is often used to measure the variation of AE counts with time. The root-mean-square (rms) value is often used to measure the energy content of AE signals. For an AE signal consisting ofx [0],x [1], ……, x [N−1] , its rms value isThe advantage of energy measurement is that the energy content of the AE signal can be directly related to important physical parameters associated with theenergy release at the AE source [14]. The above parameters have been used to describe AE signals in a variety of applications [11, 17, 18].The aforementioned parameters are measured in the time domain. Besides, parameters measured in the frequency domain are also of interest, such as the frequency and magnitude of the dominant frequency component and the energy contained within frequency bands. For the continuous-type AE, these parameters can be obtained through spectral analysis using Fourier transform. The power spectral density (PSD) of AE signals can be computed using the following equation [19]:where P[ k ] is the power spectral density, X [k]] is the discrete Fourier transform (DFT) of an AE signal x[n], andT is the sampling period. The PSD represents the distribution of the signal power over frequencies. Some studies of AE signals in the frequency domain can be found in Refs. [10, 13, 20, 21].3. ExperimentationDue to the complexity of AE phenomena, analytical methods are not well established. Therefore, experimental methods are introduced to investigate AE. In order to study the characteristics of AE signals generated by internal leakage in water hydraulic cylinders, experiments were deliberately designed, as described below.For each record of AE signal, the AE count rate, denoted as _N AE was calculated by dividing the AE counts by the signal duration. Both a fixed threshold and a floating threshold were used for counting. Since there was no well-defined procedure to choose the threshold value, a wide range of values were tried. For the fixed threshold, a value of 0.04V yielded the best results, as shown in Fig. 6a. It is noted that the AE count rate drops fast as the internal leakage rate decreases. For the floating threshold, the threshold value was set to be proportional to the rms value of the signal. The resulting AE count rate remained at a constant level, no provide a desirable simulation of the dynamic processes existing in a cylinder subject to internal leakage. Thus in the present work, efforts have been made to simulate the real internal leakage in hydraulic cylinders. In the following, the leakage mechanism is first studied; then, thesimulation of the leakage is presented.In order to simulate scores created by the abrasive action of solid particulates, a file was used, in the present work, to make scores on the piston seal surfaces of a water hydraulic cylinder. Fig. 2 shows the scored piston seals used in the experiments. These seals lead to an internal leakage smaller than 1.0 L/min for the pressure range of 0–70 bar. Sixteen scores were equally distributed along the circumference of the seals. The dimensions of these scores were measured with a non-contact optical measurement system. Fig.3 shows the profile of a score taken by the measurement system. Along the edge of the score, five key points were selected and their coordinates were measured. The width and depth of the score were then measured. In addition, a circular arc fit to these five points was calculated. Thus, an approximate radius of the score could be obtained.Fig. 2. The 16-score piston seals.Fig. 3. The profile of a score.4. Experimental resultsIn the experiment, 100 sets of data were acquired at different internal leakage rates, with each set consisting of 40 records of AE signals measured at a certain leakage rate. Each record of AE signal contained 4096 points sampled at 5 MHz, from which AE parameters were calculated. For each AE parameter, results obtained from the 40 records were then averaged. In the following, all the results are the average values.For each record of AE signal, the AE count rate, denoted as _N AE, was calculated by dividing the AE counts by the signal duration. Both a fixed threshold and a floating threshold were used for counting. Since there was no well-defined procedure to choose the threshold value, a wide range of values were tried. For the fixed threshold, a value of 0.04V yielded the best results, as shown in Fig. 4a. It is noted that the AE count rate drops fast as the internal leakage rate decreases.Fig. 4. AE count rate versus internal leakage rateFor the floating threshold, the threshold value was set to be proportional to the rms value of the signal. The resulting AE count rate remained at a constant level, nom atter how the leakage rate varied. This is shown in Fig. 4b, where the AE count rate was obtained with the threshold equal to the rms value of the signal. It can be seen that there is no desirable trend in the AE count rate with respect to the leakage rate.5. Predict the internal leakage rateAs has been shown in the above, the energy content of AE signal is closely related to the internal leakage rate in the water hydraulic cylinder. Therefore, it may be used to predict the internal leakage rate. The error of prediction, then, is of interest. In the following, an empirical model is built to predict the internal leakage rate based on measured AE signals and the error of prediction is analysed with statistical methods. Due to the simplicity in calculation, the rms value Vrms is chosen instead of the energy Ef to characterise AE signals. From the previous experimental data, the relationship between the AE rms value Vrms and the internal leakage rate Qi is obtained using the least squares method, given byQi=7.86Vrms+0.14.For a measured AE rms value, the internal leakage rate may be predicted with Eq.(7). Suppose the measured AE rms value is Vrms0. A 95% prediction interval for the true value of the internal leakage rate,denoted as Qi0, is given bywhere ^Qi is the internal leakage rate predicted by Eq. (7) based on the measured Vrms0 and d is a measure of the width of the prediction interval. Note that d is not a constant but varies with the measured AE rms value Vrms0. For the range of the internal leakage rates smaller than 1.0 L/min, d is about 0.078 L/min. Eq. (8) means that for the measured AE rms value Vrms0, the true value of the internal leakage rate Qi0 lies inside the intervale ^Qi d; ^Qi t dT with 95% confidence.6. ConclusionsThis paper analysed the characteristics of AE signals generated by internal leakage in a water hydraulic cylinder. Experiments were carefully designed, including the simulation of the internal leakage across the piston seals in a water hydraulic cylinder and the measurement of the internal leakage rate. AE signals obtained from the experiments were analysed, in which several AE parameterswere extracted from the AE signals and their effectiveness for predicting the internal leakage rate were studied.From the analysis results,some conclusions can be made, as follows:(1) AE signals are sensitive to small internal leakage in a water hydraulic cylinder and AE-based methods are able to predict the internal leakage that is smaller than 1.0 L/min.(2)Energy-based AE parameters, whether measured in the time domain or in the frequency domain, are more suitable than the AE count rate and the peak PSD magnitude to interpret AE signals generated by the internal leakage.References[1] G.W. Krutz, P.S.K. Chua, Water hydraulics—theory and applications 2004, in: Proceedings of the Workshop on Water Hydraulics, Agricultural Equipment Technology Conference (AETC ’04), Louisville, KY, USA, February 8–10, 2004.[2] E. Trostmann, Water Hydraulics Control Technology, Marcel Dekker, New York, USA, 1996.[3] W. Backe′ , Water- or oil-hydraulics in the future, in: Proceedings of the Sixth Scandinavian International Conference on Fluid Power, Tampere, Finland, May 26–28, 1999, pp. 51–64.[4] J. Watton, Condition Monitoring and Fault Diagnosis in Fluid Power Systems, Ellis Horwood, New York, USA, 1992.[5] T.T. Le, J. Watton, D.T. Pham, An artificial neural network based approach to fault diagnosis and classification of fluid power systems, Proceedings of the Institution of Mechanical Engineers, Part I, Journal of Systems and Control Engineering 211 (1997)307–317.[6] T.T. Le, J. Watton, D.T. Pham, Fault classification of fluid power system usinga dynamics feature extraction technique and neural networks, Proceedings of the Institution of Mechanical Engineers, Part I, Journal of Systems and Control Engineering 212 (1998) 87–97.[7] G. Thompson, G. Zolkiewski, An experimental investigation into the detection of internal leakage of gases through valves by vibration analysis, Proceedings of the Institution of Mechanical Engineers, Part E, Journal of Process Mechanical Engineering 211 (1997) 195–207.[8] M. Pietola, R. Ma¨ kinen, P. Va¨ yrynen, S. Kesanto, J. Varrio, Using a highresolution thermograph in predictive maintenance and fault diagnosis of fluid power components and systems, in: Proceedings of the Fourth Scandinavian International Conference on Fluid Power, Tampere, Finland, September 26–29, 1995, pp. 719–725.机械系统与信号处理, 2007, 21: 1115–1126液压密封完整性调查研究P. Chena, P.S.K. Chua, G.H. Lim摘要:本文中所涉及在液压缸的上线检测密封缺陷. 一个明显的影响密封的缺陷是内部泄漏。
Fluke 62 Mini 无接触红外热度测量仪说明书
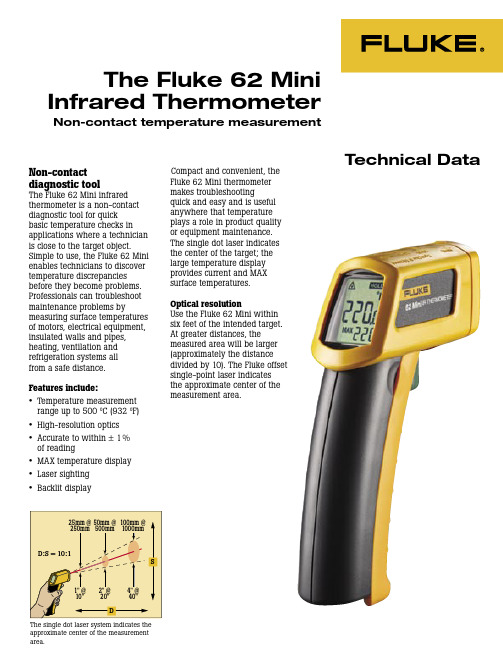
The Fluke 62 Mini Infrared ThermometerNon-contact temperature measurementNon-contactdiagnostic toolThe Fluke 62 Mini infraredthermometer is a non-contactdiagnostic tool for quickbasic temperature checks inapplications where a technician is close to the target object. Simple to use, the Fluke 62 Mini enables technicians to discover temperature discrepancies before they become problems. Professionals can troubleshoot maintenance problems by measuring surface temperatures of motors, electrical equipment, insulated walls and pipes, heating, ventilation and refrigeration systems allfrom a safe distance.Features include:•T emperature measurement range up to 500 ºC (932 ºF)• High-resolution optics•A ccurate to within ± 1%of reading• MAX temperature display • Laser sighting• Backlit displayTechnical Dataapproximate center of the measurement pact and convenient, the Fluke 62 Mini thermometer makes troubleshootingquick and easy and is useful anywhere that temperature plays a role in product quality or equipment maintenance. The single dot laser indicates the center of the target; the large temperature display provides current and MAX surface temperatures.Optical resolutionUse the Fluke 62 Mini within six feet of the intended target. At greater distances, the measured area will be larger (approximately the distance divided by 10). The Fluke offset single-point laser indicates the approximate center of the measurement area.Ordering informationFluke 62 Mini Infrared Thermometer Included:Storage Pouch-30 °C to 500 °C (-20 °F to 932 °F)10 ºC to 30 ºC (50 ºF to 86 ºF): ± 1 ºC (2 ºF)Outside 10 ºC to 30 ºC (50 ºF to 86 ºF): ± 1.5 ºC (3 ºF) or ± 1.5% of reading,whichever is greater±0.5% of reading or < ±1 °C (±2 °F),whichever is greater Preset 0.95< 500 mSec10:1 calculated @ 80% energy 6.5–18 microns thermopile detector 0.2 °C (0.5 °F)••°C or °F selectable0 to 50 °C (32 to 120 °F)10-90% RH non-condensing, @ up to 30 °C (86 °F)Up to 2 m (6 ft)Single offset laser 200 g (7 oz);152 x 101 x 38 mm (6 x 4 x 1.5 in)9 V Alkaline battery (included)12 hours-20 ºC to 65 ºC (-4 ºF to 150 ºF) without battery Includes protective boot and storage holster 2 years (conditional)Measurement range AccuracyRepeatabilityEmissivityResponse timeDistance to spot size Spectral range Display resolutionDisplay hold (7 seconds)LCD backlitTemperature displayAmbient operating range Relative humidity Typical distance to target (spot)Laser class IIWeight/dimensions PowerBattery life (alkaline)Storage temperature Options/accessories:Warranty:SpecificationsFluke. Keeping your worldup and running.Fluke CorporationPO Box 9090, Everett, WA USA 98206Fluke Europe B.V.PO Box 1186, 5602 BDEindhoven, The NetherlandsFor more information call:In the U.S.A. (800) 443-5853 or Fax (425) 446-5116In Europe/M-East/Africa (31 40) 2 675 200 or Fax (31 40) 2 675 222In Canada (800) 36-FLUKE or Fax (905) 890-6866From other countries +1 (425) 446-5500 or Fax +1 (425) 446-5116Web access: http://www.fl /©2005 Fluke Corporation. All rights reserved.Printed in U.S.A. 4/2005 2437622 D-US-N Rev A。
光学自由曲面加工技术

光学自由曲面加工技术English Answer:Optical Freeform Surface Manufacturing Technology.Optical freeform surfaces are complex optical elements with surfaces that deviate significantly from traditional spherical or cylindrical shapes. Their ability to manipulate light in novel ways has led to advancements in numerous fields, including optics, lasers, and imaging systems.The manufacturing of optical freeform surfaces requires specialized techniques to achieve the desired surface form and optical properties. One such technique is diamond turning, which uses a single-point diamond cutting tool to remove material from the workpiece in a controlled manner. Another technique is ultra-precision grinding, which utilizes a grinding wheel with sub-micron abrasiveparticles to shape the workpiece surface. These techniquesallow for precise control over the surface form and roughness, leading to high-quality optical components.Advancements in Optical Freeform Surface Manufacturing.Recent advancements in optical freeform surface manufacturing have enabled the production of increasingly complex and precise optical elements. These advancements include:Improved machining techniques: New diamond turning and ultra-precision grinding techniques have significantly reduced加工误差and improved surface quality.Advanced metrology systems: Non-contact measurement techniques such as interferometry and laser scanning allow for accurate and efficient characterization of freeform surfaces.Computational modeling and simulation: Computer simulations can now predict the behavior of light interacting with freeform surfaces, aiding in the designand fabrication of optical systems.Applications of Optical Freeform Surfaces.Optical freeform surfaces find applications in a wide range of fields, including:Imaging systems: Freeform lenses and mirrors enable compact and high-performance imaging systems with improved resolution and field of view.Optical communications: Freeform surfaces can be used to create optical components for fiber optic networks, improving signal transmission and bandwidth.Laser systems: Freeform surfaces can enhance laser beam quality, stability, and power output.Precision optics: Optical freeform surfaces are usedin instruments for metrology, microscopy, and spectroscopy.Challenges and Future Directions.While significant progress has been made in optical freeform surface manufacturing, several challenges remain:High production cost: The fabrication of freeform surfaces can be time-consuming and expensive, limitingtheir widespread adoption.Complex design and modeling: The design and modeling of freeform surfaces can be complex and computationally intensive.Metrology challenges: Measuring the complex shapes of freeform surfaces accurately and efficiently remains a challenge.Future research and development efforts will focus on addressing these challenges and further advancing the field of optical freeform surface manufacturing.Chinese Answer:光学自由曲面加工技术。
基于Canny算子的工件非接触式测量

基于Canny算子的工件非接触式测量摘要:为了测量高温或其他不宜直接接触的工件,提出了一种基于canny算子的边缘检测法测量工件的尺寸,该方法通过对原始器件图像的二值化处理,提取工件的轮廓,再进行阈值检测并返回轮廓坐标从而确定工件的相关参数。
与传统接触式测量方法相比,该方法能对高温等物体进行测量,同时该方法有测量精度高等特点。
理论及计算机仿真表明,该方法切实有效,有良好的应用前景。
关键词:非接触式测量;canny算子;边缘检测;二值化;阈值检测中图分类号:tp751 文献标识码:a 文章编号:1009-3044(2013)04-0849-03non-contact measurement of workpiece based on canny operatoryou xiao-long, liu song-lin(school of electronic & information engineering, nanjing university of information science & technology, nanjing 210044 , china)abstract: in order to measure the size of high temperature or other untouchable workpieces, a method based on canny operator is proposed.this method take the original device image and then processing two values, extracting the contour of the workpiece, then takes threshold detection and returnsthe contour coordinates to determine the workpiece parameters. compared with the traditional contact measurement methods ,this method can measure the high temperature workpieces and has the characteristics of higher measurementaccuracy.theory and computer simulation show that this method is effective,and it has a good application prospects.key words: non contact measurement; canny operator;edge detection; two values; threshold detection工业产品形状及尺寸的测量是现代化工业生产的重要环节,测量结果的准确性与时效性直接影响着产品生产的质量与效率[1]。
qcm质量灵敏度的分析与验证

摘要摘要QCM(Quartz Crystal Microbalance)是20世纪60年代出现的一种基于压电效应进行微质量测量的传感器装置,由于其测量精度可达纳克级,且结构简单、成本低、可实时监测,所以在生物医学、环境保护等领域应用广泛。
然而实际应用中需要先拟合出质量与谐振频率偏移量的线性关系,然后才能投入使用,这限制了QCM的应用。
另外,QCM表面电极对其受迫振动有影响,不同区域电极存在情况不同导致各区域在逆压电效应下引起的质点位移不同,因此QCM不同位置的质量灵敏度存在差异,所以QCM在应用中存在重复性低、测量误差大的问题,阻碍了QCM的推广应用。
本文以石英晶体的压电特性和振动特性为基础,推导了QCM的质量灵敏度计算方式,并分析了影响QCM质量灵敏度的因素。
本文的主要内容:1、从石英晶体的特性出发,介绍了石英晶体的压电效应、频率温度特性以及石英晶体谐振器的等效电路。
2、在石英晶体压电方程和质点位移方程的基础上,分区域分析了石英晶体谐振器的受迫振动情况,得出QCM质量灵敏度的计算方法。
通过Matlab仿真分析QCM的质量灵敏度分布,分析表明QCM电极中心的质量灵敏度最大,随着远离电极中心质量灵敏度呈指数级衰减。
然后通过Matlab仿真分析电极厚度、电极尺寸、石英晶片厚度以及电极密度对质量灵敏度的影响,以便在设计时提供理论参考。
由于能陷效应存在,QCM非电极区的范围要大于电极区,非电极区在质量测量中不容忽视,所以接着分析了非电极区在QCM质量测量过程中的影响。
3、在液相下QCM的谐振频率偏移量与液体的粘弹性有关,在已知液体粘度和密度的情况下,可以通过公式计算出理论的QCM谐振频率偏移量。
然后分别以水和有机试剂为被测物,测量QCM的频移并与理论频移值对比,实测值与理论值的最大误差不大于8.2%。
关键词:QCM,质量灵敏度,液滴实验IABSTRACTQCM (Quartz Crystal Microbalance) occurs in 1960s as a micro-mass measurement device based on piezoelectric effect. Because of its nanogram-level detection ability, simple structure, low detection cost and real-time monitoring, it is widely used in biochemistry, food safety, environmental protection etc. However, one needs to know the linear relationship between loading mass and resonace frequency offset before taking it into practical use, which limits the use of QCM. In addition, the electrodes on the surface influence the forced vibration. So each region has different displacement which is caused by inverse piezoelectric effect. That leads to uneven distribution of the mass sensitivity, which makes low repeatability and large measurement error while using QCM in application. These disadvantages hinder the popularization of QCM.Based on the piezoelectric characteristics and vibration characteristics of quartz crystal, the calculation method of QCM’s mass sensitivity is deduced and the factors influencing QCM’s mass sensitivity are analyzed. The main contents of this paper are: First, we introduce the characteristics of quartz crystal, the piezoelectric effect,frequency-temperature characteristic and quartz crystal resonator equivalent circuit.Second, based on the piezoelectric equation and the particle displacement equation of quartz crystal, we deduce the vibration amplitude of the quartz crystal resonator in different area, and then obtain the method of calculating the mass sensitivity. We use Matlab to analyze the distribution of the QCM’s mass sensitivity, and the result shows that the mass sensitivity has max value at the center of the electrode and exponentially decaying away from the center. Then we use Matlab as simulation tool to analyze the influence of electrode thickness, electrode size, quartz wafer thickness and the electrode density on the mass sensitivity, which can provide theoretical reference while designing a QCM. Due to the effect of energy trap, the QCM’s non-electrode area is larger than the electrode area. So the non-electrode region cannot be neglected while using in mass measurement. Therefore, we analyze the influence of the non-electrode region on mass measurement.Third, in the liquid phase the resonant frequency offset has relationships with liquid’s viscoelasticity, so if we known the viscosity and density of the liquid, theIItheoretical resonant frequency offset can be calculated. Then we use water and organic reagents as the measured object, and we mearsue the frequency shift of QCM and compare it with the theoretical frequency shift. The maximum relative error between the measured value and the theoretical value is not more than 8.2%.Keywords: QCM, mass sensitivity, droplet experimentIII目 录第一章绪论 (1)1.1 研究意义 (1)1.2石英晶体微天平分类 (1)1.2.1常规石英晶体微天平 (1)1.2.2电化学石英晶体微天平 (2)1.2.3耗散型石英晶体微天平 (2)1.2.4阵列式石英晶体微天平 (2)1.3 QCM在各领域中的应用 (2)1.3.1 在环境污染检测中的应用 (2)1.3.2在生物医学上的应用 (3)1.3.3在食品上的应用 (3)1.3.4在化学上的应用 (4)1.4 工作示意图 (4)1.5本论文的结构安排 (5)第二章QCM基本原理 (7)2.1 QCM的基本结构 (7)2.2石英晶体的基本特性 (7)2.2.1频率温度特性 (10)2.2.2压电效应 (12)2.3石英晶体谐振器 (14)2.3.1等效电路 (14)2.3.2能陷理论 (16)2.4 本章小结 (17)第三章QCM质量灵敏度 (18)3.1 振动位移分布 (18)3.1.1 压电方程 (18)3.1.2 质点位移方程 (20)3.1.3 QCM振动分析 (21)3.2m-m型电极的QCM质量灵敏度分析 (30)3.3影响质量灵敏度的因素分析 (33)IV3.3.1电极尺寸对质量灵敏度的影响 (33)3.3.2石英晶片厚度对质量灵敏度的影响 (34)3.3.3电极厚度对质量灵敏度的影响 (35)3.3.4电极密度对质量灵敏度的影响 (35)3.3.5非电极区质量效应在QCM测量中的影响 (36)3.4本章小结 (38)第四章实验与结果分析 (39)4.1 实验理论基础 (39)4.2 实验和数据分析 (41)4.2.1纯水测量 (42)4.2.2有机试剂一 (45)4.2.3有机试剂二 (49)4.2.4误差分析 (51)4.3 本章小结 (52)第五章总结与展望 (53)5.1 本文总结 (53)5.2 后续工作展望 (53)致谢 (54)参考文献 (55)VVI 主要符号表f S 质量灵敏度 QCM 石英晶体微天平 q ρ石英晶体密度 0f 石英晶体固有频率ij c 石英晶体的弹性刚度常数 R 电极质量负载因子h 石英晶片厚度22ε石英晶体介电常数 r k 波传播常量的径向分量2D 在2x 方向上的电位移 2E 在2x 方向上施加的电场cp f 部分电极区截止频率 ce f 全电极区截止频率cu f 非电极区截止频率 1u 在1x 方向上质点位移k 驱动频率的波数 η液体的粘度ρ液体的密度 e r 电极半径d r 液滴半径 26e 压电常数ij s 石英晶体弹性柔顺常数 226k 机电耦合系数6T 石英晶体表面切应力 6S 石英晶体切应变ϕ石英晶片表面电势 h '电极厚度ρ'电极密度 δ衰减长度66C 压电强化弹性系数第一章绪论本章首先简述了本文的研究意义以及QCM的分类,然后概述QCM在环境保护、生物医学、食品安全和化学等领域的应用,最后指出本文的研究内容及各章节安排。
基于数字图像相关方法的Q235_钢单轴拉伸变形研究

基于数字图像相关方法的Q235钢单轴拉伸变形研究肖汉斌1 陈 田1 于家硕1 裴雪冬1 李占峰21武汉理工大学交通与物流工程学院 武汉 430063 2大连港散杂货码头公司技术工程部 大连 116001摘 要:数字图像相关(DIC)方法是一种非接触式的光学测量方法,通过高速摄像机记录实验过程,并基于计算机视觉技术对实验过程进行分析与数值计算,从而得出目标区域在实验过程中的应变变化情况。
Q235钢是起重机的常用材料,研究Q235钢在拉伸载荷下的变形对保证起重机结构安全有重要意义。
文中通过DIC技术对Q235钢试件拉伸变形过程进行研究,对比DIC方法分析值、应变片测量值以及有限元仿真模拟值。
结果表明,通过DIC 方法得到的分析值与其余两种方式得出的数据相对误差均小于5%,为DIC方法在金属结构拉伸变形研究中提供了有力参考。
关键词:金属结构;数字图像相关;拉伸变形;Q235钢;有限元仿真中图分类号:TP391:U653.921 文献标识码:A 文章编号:1001-0785(2022)16-0019-07Abstract: Digital image correlation (DIC) method is a non-contact optical measurement method. The experimental process is recorded by a high-speed camera, and the experimental process is analyzed and numerically calculated by computer vision technology, so as to obtain the strain change of the target area during the experimental process. Q235 steel is a common material for cranes. It is of great significance to study the deformation of Q235 steel under tensile load to ensure the structural safety of cranes. In this paper, the tensile deformation process of Q235 steel specimen is studied by DIC technology. By comparing the analysis value of DIC method, the measured value of strain gauge and the simulation value of finite element simulation, it can be found that the relative error between the analysis value obtained by DIC method and the data obtained by the other two methods is less than 5%, which provides a powerful reference for the application of DIC method in the research of tensile deformation of metal structures.Keywords:metal structure; digital image correlation; tensile deformation; Q235 steel; finite element simulation0 引言起重机被广泛运用于港口运输、机械等行业,由于其部分金属构件长期处于复杂的载荷条件下,其故障的产生与金属结构的加工工艺、现场环境和作业工况有很大关系,故应力应变是反映金属故障的重要指标[1]。
基于光纤复合测量技术的涡轮叶片气膜孔检测

第 50 卷第 2 期2024 年 4 月Vol. 50 No. 2Apr. 2024航空发动机Aeroengine基于光纤复合测量技术的涡轮叶片气膜孔检测高继昆1,闫峰1,何小妹2,德晓薇1(1.中国航发沈阳发动机研究所,沈阳 110015; 2.航空工业北京长城计量测试技术研究所,北京 100095)摘要:为了解决航空发动机涡轮叶片气膜孔几何特征参数有效检测手段缺乏、测量结果一致性差的问题,设计并搭建了基于光纤复合测量技术的涡轮叶片气膜孔检测系统,提出了利用该系统对涡轮叶片气膜孔进行测量的方法,通过试验进行了方法验证。
搭建的系统为多传感器测量系统,具备叶片接触与非接触测量、空间姿态定位及3D投影能力,实现了涡轮叶片全范围气模孔的测量。
在试验中,选取高压涡轮叶片作为被测物体,应用该测量系统对叶片上的气膜孔进行了测量,计算得到了气膜孔直径、轴线角度及位置度的准确信息。
结果表明:通过测量不确定度的分析评定可知,该系统对气膜孔直径、位置度的测量不确定度均小于0.01 mm,完全满足设计公差对测量仪器的精度要求,可以用于涡轮叶片气膜孔工程化测量。
关键词:涡轮叶片;气膜孔;几何特征参数;光纤复合测量技术;接触测量;非接触测量;航空发动机中图分类号:V232.4文献标识码:A doi:10.13477/ki.aeroengine.2024.02.019Inspection of Turbine Blade Film Cooling Holes Based on Fiber OpticMulti-sensor Measurement TechniqueGAO Ji-kun1, YAN Feng1, HE Xiao-mei2, DE Xiao-wei1(1. AECC Shenyang Engine Research Institute,Shenyang 110015,China;2. Changcheng Institute of Metrology and Measurement,Beijing 100095,China)Abstract:In order to solve the problems of lacking effective inspection means and poor consistency of measurement results for aeroengine turbine blade film cooling hole geometrical feature parameters, an inspection system for turbine blade film cooling holes was designed and established based on fiber optic-based multi-sensor measurement technique. The measurement method of the film cooling holes using the system was proposed, and verified by measurement practices. The system is a multi-sensor measurement system with the ability of contact and non-contact measurement, spatial attitude positioning, and 3D projection, realizing measurement of film cooling holes over the entire turbine blade. A high-pressure turbine blade was selected for conducting the film cooling hole measurement by using the measurement system. Accurate geometrical feature parameters of the film cooling holes were calculated, including their diameters, axis angles, and position. The results show that through measurement uncertainty analysis and evaluation, uncertainties of the diameters and the positions are both less than 0.01mm, which fully meets the accuracy requirements of the measuring instrument derived from the design tolerances, and the system can be used for the inspection of the film cooling hole of the turbine blade.Key words:turbine blade; film cooling hole; geometrical feature parameter; fiber optic multi-sensor measurement technique; contact measurement; non-contact measurement; aeroengine0 引言涡轮叶片作为航空发动机关键部件之一,其气膜孔测量技术的精度和效率对于提高发动机性能和稳定性具有重要意义[1]。
基于光电成像的目标转动姿态非接触测量方法
摘 要 : 为 了测量物体 的转动姿态 ,往往利用接触式测量元件来获取待测 目标转动角度信息 。但在 军事和 民 用 领 域 ,常 需 要 一 种 低 时 间 延 迟 、高输 出 频率 及 高 测量 精 度 的 非 接 触 式 姿 态 测 量 方 法 。 由此 设 计 了一 种 利 用 高 分 辨 率
of object rotation attitude by using EO imaging.It shown by simulation that the measurement method
accuracy is higher than 0.05。and the m easurement data output ̄equency is 500 Hz,and the time delay is less than 2ms.This electro—optical im aging based non—contact m easurement of target rotation is easy,meeting the requirement of non—contact measurement in real time,high frequency and high accuracy.
Electro-optical im aging based non-contact m easurem ent of target rotation attitude YUAN Hong—wei,M IN Zhi—fang
(Huazhong Institute of Electro—optics,Wuhan National Laboratory for Optoelectronics,W uhan 430073,China)
- 1、下载文档前请自行甄别文档内容的完整性,平台不提供额外的编辑、内容补充、找答案等附加服务。
- 2、"仅部分预览"的文档,不可在线预览部分如存在完整性等问题,可反馈申请退款(可完整预览的文档不适用该条件!)。
- 3、如文档侵犯您的权益,请联系客服反馈,我们会尽快为您处理(人工客服工作时间:9:00-18:30)。
Introduction
New data of diagnostic relevance can be found with the measurement of the impedance of biological tissue. A noninvasive method of measuring the impedance can give information on the electrical characteristics of tissue. A change in the impedance for example can give a prediction of the healing process of wounds. If the patient has acute pain it is not always possible to touch the skin, so a non-contact method must be used. In some applications (e.g. impedance measurement in the brain) impedance can hardly be measured with surface electrodes [1]. The developed sensor should be an instrument, which is moved around on the skin of a patient, in order to detect areas with impedances that deviate from normal.
D˜ A−1C˜D˜ SDµ−1DA−1CDS − ω2
D + Dσ iω
e = −iωje (5)
0.01 m 0.0085 m 0.0055 m
0.004 m 0.006 m 0.01 m
excitation coil
upper detection coil lower detection coil
geometries, a numerical method was used. The simulations
are done with MAFIA [3]. This program is based on the
Finite Integration Technique. Therefore the Maxwell equa-
excitation coil is calculated:
A(rn, t)
=
µi(t) 4π
PE ∂rs
1 ds
PB ∂s | rn − rs |
(2)
Here rn is any measurement point, i(t) is the alternating excitation current, PB the beginning and PE the end of the path. Using this magnetic vector potential the flux Φ(t) can
0.03 m
tissue
z y x
0.03 m
0.03 m
Figure 2: The coils are simulated as rectangular coils. The measurement coil is simulated as two coils parallel one upon the other. The measurement system is above the tissue.
The primary field is created directly by the excitation coil and induces a voltage Uind in the sensor. The induced voltage dUind created by the eddy currents is proportional to the frequency and lags the primary excitation field and the induced voltage Uind by 90◦. In general dUind will have a real and an imaginary part but for biological tissue the imaginary part is dominant [2]. Fig. 1 shows the induced voltage Uind from the primary field and from the secondary field dUind using only the imaginary part. To calculate the induced voltage Uind without tissue, first the geometric arrangement of the excitation coil is parameterized with the parameter s. Then the magnetic vector potential A of the
C and S denote the discrete curl and div operators in the grid and C˜ and S˜ denote them in the dual grid. The material properties are descrbed by the diagonal matrices Dµ, D and Dσ. DS, DA, D˜ S and D˜ A are diagonal matrices and describe the dimension of the grid [4]. The coils are simulated as filaments. The excitation coil is driven by an alternating current. The measuring coils are simulated as ideal filaments with no current flow. The measured voltage can be calculated using the electric field. Using MAFIA the whole Maxwell equations are solved and there is now negligence of the displacement currents is done. Geometrical arrangement: In this part a three coil system is examined. The first is used as an excitation coil. The others, an upper and a lower coil, are built up as a vertical gradiometer. A homogeneous tissue block is placed underneath. Fig. 2 shows the geometrical arrangement for the simulation. The tissue block has the size of 0.03 m x 0.03 m x 0.03 m. The excitation coil has a length of 0.01 m on each side and the distance to the tissue is 0.01 m, the gradiometer coil has an upper and a lower coil with a length of 0.004 m and 0.006 m on each side and the distances to the tissue are 0.0085 m and 0.0055 m. The excitation coil is driven by an alternating current of 1 A. The volume which is used for the numerical field calculation is 0.05 m x 0.05 m x 0.06 m. A mesh with equidistant mesh points and a distance of 0.5 mm is used. The frequency
tions are written as discrete equations in frequency space. So the the electric field e can be expressed as a function of the driving current density je:
SIMULATION OF NON-CONTACT MEASUREMENT OF THE ELECTRICAL IMPEDANCE USING AN ANATOMICAL MODELL
C.H. Riedel, M.-A. Golombeck, O. Do¨ssel Institut fu¨r Biomedizinische Technik, Universita¨t Karlsruhe (TH), Germany
Claudia.Riedel@ibt.uni-karlsruhe.de
Abstract—The measurement of the impedance of biological tissue can be a non-invasive method to find new data of diagnostic relevance. A system for a non-contact measurement of the electrical impedance of biological tissue is presented. The system consists of an excitation coil and two sensing coils, an upper and a lower coil. If the two sensing coils are coupled it can be used as a gradiometer coil. Numerical experiments with focus on the eddy currents in the tissue and on the detection of the small changes of the signal are carried out to calculate the fields, eddy current distributions and induced voltages. Hereby tests with different frequencies of the excitation current and different conductivities of a tissue block are used. Then the homogeneous tissue block is replaced with a fraction of the arm of an anatomical model which contains different tissue classes.