北邮实验报告封面
北邮通电实验报告

实验3 集成乘法器幅度调制电路信息与通信工程学院2016211112班苏晓玥杨宇宁2016210349 2016210350一.实验目的1.通过实验了解振幅调制的工作原理。
2.掌握用MC1496来实现AM和DSB的方法,并研究已调波与调制信号,载波之间的关系。
3.掌握用示波器测量调幅系数的方法。
二.实验准备1.本实验时应具备的知识点(1)幅度调制(2)用模拟乘法器实现幅度调制(3)MC1496四象限模拟相乘器2.本实验时所用到的仪器(1)③号实验板《调幅与功率放大器电路》(2)示波器(3)万用表(4)直流稳压电源(5)高频信号源三.实验内容1.模拟相乘调幅器的输入失调电压调节。
2.用示波器观察正常调幅波(AM)波形,并测量其调幅系数。
3.用示波器观察平衡调幅波(抑制载波的双边带波形DSB)波形。
四.实验波形记录、说明1.DSB信号波形观察2.DSB信号反相点观察3.DSB信号波形与载波波形的相位比较结论:在调制信号正半周期间,两者同相;负半周期间,两者反相。
4.AM正常波形观测5.过调制时的AM波形观察(1)调制度为100%(2)调制度大于100%(3)调制度为30%A=260.0mv B=140.0mv五.实验结论我们通过实验了解振幅调制的工作原理是:调幅调制就是用低频调制信号去控制高频振荡(载波)的幅度,使其成为带有低频信息的调幅波。
目前由于集成电路的发展,集成模拟相乘器得到广泛的应用,为此本实验采用价格较低廉的MC1496集成模拟相乘器来实现调幅之功能。
DSB信号波形与载波波形的相位关系是:在调制信号正半周期间,两者同相;负半周期间,两者反相。
通过实验了解到了调制度的计算方法六.课程心得体会通过本次实验,我们了解了振幅调制的工作原理并掌握了实现AM和DSB的方法,学会计算调制度,具体见实验结论。
我们对集成乘法器幅度调制电路有了更好的了解,对他有了更深入的认识,提高了对通信电子电路的兴趣。
和模电实验的单独进行,通电实验增强了团队配合的能力,两个人的有效分工提高了实验的效率,减少了一个人的独自苦恼。
北邮数字电路与逻辑设计实验-实验报告(上)

北京邮电大学电路实验中心<数字电路与逻辑设计实验(上)>实验报告班级: xxx学院: xxx实验室: xxx 审阅教师:姓名(班内序号): xxx)学号: 2xxx实验时间: xxxx评定成绩:目录实验1 Quartus II 原理图输入法设计与实现 (3)一、实验目的 (3)二、实验所用器材 (3)三、实验任务要求 (3)四、实验原理图 (3)五、实验仿真波形图及分析 (4)实验2 用VHDL 设计与实现组合逻辑电路 (5)一、实验目的 (5)二、实验所用器材 (5)三、实验任务要求 (5)四、VHDL代码 (5)五、实验仿真波形图及分析 (7)实验3 用VHDL 设计与实现时序逻辑电路 (8)一、实验目的 (8)二、实验所用器材 (8)三、实验任务要求 (8)四、模块端口说明及连接图 (8)五、VHDL代码 (9)六、实验仿真波形图及分析 (10)实验4 用VHDL 设计与实现数码管动态扫描控制器 (10)一、实验目的 (10)二、实验所用器材 (11)三、实验任务要求 (11)四、模块端口说明及连接图 (11)五、VHDL代码 (11)六、实验仿真波形图及分析 (15)故障及问题分析 (16)总结和结论 (17)实验1 Quartus II 原理图输入法设计与实现一、实验目的(1)熟悉用Quartus II原理图输入法进行电路设计和仿真;(2)掌握Quartus II 图形模块单元的生成与调用;(3)熟悉实验板的使用。
二、实验所用器材(1)计算机;(2)直流稳压电源;(3)数字系统与逻辑设计实验开发板。
三、实验任务要求(1)用逻辑门设计实现一个半加器,仿真验证其功能,并生成新的半加器图形模块单元。
(2)用(1)中生成的半加器模块和逻辑门设计实现一个全加器,仿真验证其功能,并下载到实验板测试,要求用拨码开关设定输入信号,发光二极管显示输出信号。
(3)用3线-8线译码器(74LS138)和逻辑门设计实现函数+CBA,仿真验证其功能,并下载到实验板测试。
北邮数字电路与逻辑设计实验-实验报告(下)

北京邮电大学电路实验中心<数字电路与逻辑设计实验(下)>实验报告班级: xxx 学院: xxx实验室: xxx 审阅教师:姓名(班内序号): xxx 学号: xxx实验时间: xxx评定成绩:目录一、任务要求 (2)1.基本要求 (2)2.提高要求 (2)二、系统设计 (2)1.设计思路 (2)2.总体框图 (4)3.分块设计 (5)(1)分频器模块 (5)(2)4×4键盘输入模块 (5)(3)数码管显示模块 (6)(4)8×8 LED点阵显示模块 (6)(5)LCD液晶屏显示模块 (6)(6)中心模块 (6)三、仿真波形及波形分析 (6)1.分频器模块 (6)2.4×4键盘输入模块 (7)3.数码管显示模块 (7)4.8×8 LED点阵显示模块 (8)5.LCD液晶屏显示模块 (8)6.中心模块 (8)四、源程序 (9)1.分频器模块 (9)2.4×4键盘输入模块 (9)3.数码管显示模块 (11)4.8×8 LED点阵显示模块 (12)5.LCD液晶屏显示模块 (19)6.中心模块 (23)五、功能说明及资源利用情况 (26)六、故障及问题分析 (27)七、总结和结论 (27)一、任务要求本电路可供甲乙二人进行猜拳游戏。
通过不同的按键控制,选择多种出拳方式,显示猜拳的结果,实现猜拳游戏,防止了作弊的可能。
1.基本要求1、甲乙双方各用4×4 键盘中的三个按键模拟“石头”、“剪刀”、“布”,一个按键为“确认”。
4×4 键盘第一行为甲,第二行为乙;2、裁判用4×4 键盘第三行的一个按键模拟“开”,一个按键为“准备”,一个按键为“复位”;3、裁判宣布“准备”后,甲乙双方分别选择出拳方式并确认;4、裁判“开”以后,用点阵的左右三列同时显示甲乙双方的猜拳选择(如下图所示),并用两个数码管显示甲乙的猜拳比分;图1甲“布”,乙“剪刀”;甲“剪刀”,乙“石头”5、猜拳游戏为五局三胜制。
北邮大学物理演示实验报告
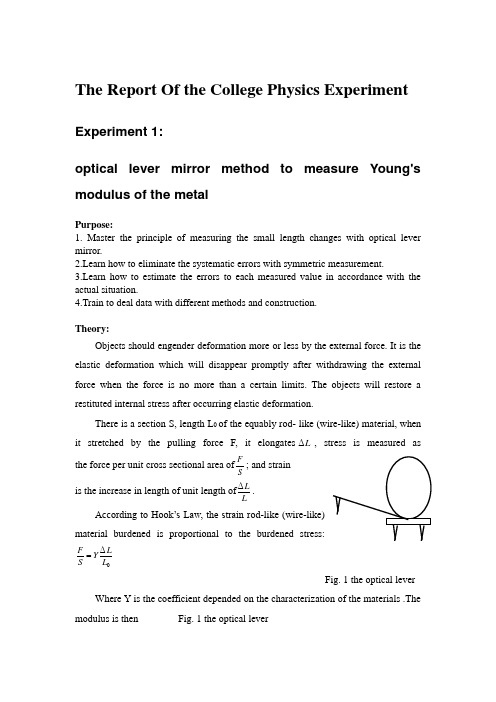
The Report Of the College Physics ExperimentExperiment 1:optical lever mirror method to measure Young'smodulus of the metalPurpose:1. Master the principle of measuring the small length changes with optical levermirror.2.Learn how to eliminate the systematic errors with symmetric measurement.3.Learn how to estimate the errors to each measured value in accordance with theactual situation.4.Train to deal data with different methods and construction.Theory:Objects should engender deformation more or less by the external force. It is theelastic deformation which will disappear promptly after withdrawing the externalforce when the force is no more than a certain limits. The objects will restore arestituted internal stress after occurring elastic deformation.There is a section S, length L 0 of the equably rod- like (wire-like) material, whenit stretched by the pulling force F, it elongates L Δ, stress is measured as the force per unit cross sectional area ofS F ; and strain is the increase in length of unit length of LL Δ. According to Hook’s Law, the strain rod -like (wire-like)material burdened is proportional to the burdened stress:0ΔL L Y S F Fig. 1 the optical lever Where Y is the coefficient depended on the characterization of the materials .Themodulus is thenFig. 1 the optical leverknown as Young’s modulus (Y). and hence: LS FL Y Δ0 (1) This experiment is to measure the Young ’s modulus of a kind of model steel, in which F can be determined by the calculated weight of weight, sectional area S can be get by calculating the diameter of the wire measured with micrometer screw gouge, 0L can be measured by conventional measurement apparatus such as meter and so on. But L Δis difficult to measure accurately for its small length change used ordinary apparatus. So we choose amplification ——“optical lever mirror” to measure this small change L Δ. The optical lever mirror physical diagram is Fig. 1Fig.2 the principle of optical lever mirrorFig.2 is the principle chart of measuring the tiny length change by optical lever mirror. The left curled object is the optical lever mirror, M is a reflector, b is the so- called short – optical lever mirror arm length, O is fixed- side of b-side, the other side b will rise or fall when the measured object elongating or shortening, and change the direction of normal line of M. The original wire length is 0L , from the right adjusted telescope we can see the reading of scale imagine of M of 1n , while the steel is elongated, from the telescope we can see the reading of scale imagine of M: 2n . In this way, the tiny wire elongation is L Δ, the corresponding angle change of the optical Db MΔn=n-nOlever mirror is θ, and the reading change of scale imagine of M is 21Δn n n -=. Be reversible by the optical path that light lever angle should be θ2. Using the geometric method in Fig.2 we can get:bL ∆=≈θθtg (2) D n D n n ∆=-=≈1222tg θθ (3) Hence n Db L ∆=∆2 (4) Where 12n n n -=∆, equivalent to the displacement of the long arm of optical lever mirror. bD 2 is the magnification of optical lever mirror, as D >> b, so ∆n >> ∆L, that means we get linear amplification of the small amount, and enhance the measurement accuracy of L ∆.This measurement is known as amplification. This amplification has a wide range of applications in designing all kinds of testing equipment for its advantage of stable performance, high precision, linear amplification and so on.Taking into account the wire by the external force there is a lag effect of flexibility, as to say that the steel can’t be due immediately to the elongated length of i L (i i L L L ∆+=0) when it is elongated, but only to the elongation of i i L L δ-. Similarly, the steel can’t be reduced to the length of L i when once the stretching force of the wire has been reduced, but only reduced to i i L L δ+. Therefore the measured length of the wire by the experiment is not the actual elongated or contracted length. In order to eliminate the systematic errors by the lag effect of flexibility, the measurement should be included a symmetrical measurement process of increasing the tensile strength and reducing the tensile strength. To the experiment, we can get this to increase or reduce the weights, we can take average amount of the stretching of wire as long as increase or reduce a corresponding weight to eliminate the effects of lagged volume. That is:[]()()[]i i i i i i L L L L L L L L L L L ∆+=+∆++-∆+=+=0002121δδ减增Procedure:(1)Attach 2kg hanger for weights to end of the wire to remove any irregularities. Adjust the three foot screws under the Young’s modulu s chassis, and observe the standard ruler on the platform at the same time until the middle of the platform is at the level of state.(2)Regulate the location of the optical lever mirror. Take the optical lever mirror on the platform, the two front feet on the cross- platform, the rear foot on the cylindrical casing of the lower end of the fixed wire (the rear foot must be placed on the edge of the metal casing, but not on the location of the gap),and let the mirror of optical lever mirror to be basic vertical or slight angle, as shown in Fig. 1.(3)Adjust the telescope. Place the telescope about 2m away from the optical lever mirror. Loose the fixed screw of telescope and move up or down to let the mirror of optical lever mirror and the telescope are on the same height. Take aim at the mirror of optical lever mirror along the tube axis above the telescope. Shift the fixed position of the telescope until we can see the scale imagine from the optical lever mirror. And then observe from the eyepiece. Adjust the eyepiece to see the cross wire clearly and finally revolve the focusing hand wheel to flexible the telescope in the tube until we can see the ruler scale clearly from the telescope.(4)Observe the stretch change. Attach 2kg hanger for weights to the end of the wire as the beginning, and take the telescope reading of 0n . Load the measured wire with successive kilogram weights, taking the telescope reading after each addition ——76543210n ,n ,n ,n ,n ,n ,n ,n . Unload kilogram by kilogram, and read thetelescope at each stage ——01234567n ,n ,n ,n ,n ,n ,n ,n ''''''''. Note: Add or subtract the weight lightly to avoid a relatively large vibration. After adding or subtracting the weight, the wire will have a scalable micro-vibration, and we should read after the steel gradually becoming stable.(5)Measure the distance b from the front foot to the rear foot of optical lever mirror. Rent the 3 feet of the optical lever mirror in white paper. Draw the connection of the two front feet and then measure the vertical distance from the rear foot to theline with the vernier scale.(6)Measure the diameter of the wire at several points about 3-5 times along its length and find a mean value. This measurement must be done carefully with a micrometer screw-gauge and note the zero error each time.(7)Use meter ruler to measure the distance D from the plane mirror to the scale.(8)Use meter ruler to measure the original length of wire.(9)Notes①The wire must be clamped tightly at the both side, at one hand to reduce the system error, and at the other hand to avoid falling down to damage the test devices.②Don ’t move the telescope and the table in the measuring and reading process, or you must start measuring again.③Keep the measured wire straight so as to avoid misusing the measuring process for the elongation, resulting in measurement error.④Keeping the weight should be 1kg and don ’t touch the mirror in the measuring progress.⑤You must adjust the telescope in a certain scope to avoid damaging it.Data and the resultsKG △x=0.05 CM1.0F =仪镜尺距(he distance from the ruler to the mirror)D =150 mm ; △x仪= 0.05 CMThe wire length:L1(上读数) / cm L2(下读数)/cm 钢丝长度L/cm7.8 42.2 34.4The diameter of the wire:First record=0.02 mm ; △d仪=0.004 mm次数 1 2 3 4 5 6diameter ofthe wire/mm0.80 0.81 0.81 0.85 0.85 0.82光杠杆常数b=85.17 mm ;△b仪=0.002 mmgraphical method:F(*9.80N)10.0 11.5 13.0 14.5 16.5 17.5 19.0 20.5 22.0 23.5 25.0 26.5△x/c m 2.0152.1952.3552.512.7552.943.163.4053.613.834.0054.20The discuss of this experiment and my experiment:After this experiment I know that we should use plot to obtain the value of Y in this experiment.Eliminating the systematic errors in the experiment is also very important.I think that I have learned how to eliminate the systematic errors with symmetric measurement.I also have learned that how to estimate the errors to each measured value in accordance with the actual situation.To deal data withdifferent methods and construction is the purpose that we must get.。
推荐-北邮—微原软件实验报告 精品

微机原理软件实验报告学院:信息与通信工程学院班级:班内序号:姓名:学号:实验二分支,循环程序设计一.实验目的:1.开始独立进行汇编语言程序设计;2.掌握基本分支,循环程序设计;3.掌握最简单的DOS 功能调用.二.实验内容:1.安排一个数据区(数据段),内存有若干个正数,负数和零.每类数的个数都不超过9.2.编写一个程序统计数据区中正数,负数和零的个数.3.将统计结果在屏幕上显示.三.预习题:1.十进制数0 -- 9 所对应的ASCII 码是什么? 如何将十进制数0 -- 9 在屏幕上显示出来?答:0—9对应的ASCII 码是30H—39H;在屏幕上显示0—9,需要将对应字符的ASCII 码赋给DL,并进行DOS的2号功能调用,0—9的ASCII 码正是其本身的数值加上30H。
2.如何检验一个数为正,为负或为零? 你能举出多少种不同的方法?答:①用CMP命令和0比较,如果ZF为1,则该数为零;再用该数和8000H相与,取出符号位判断,可区分正负;②用CMP命令和0比较,结果不小于0时用JGE命令进行跳转,否则为负数;用JGE 命令跳转后,如果为0再用JZ命令跳转,否则为正数。
四.选作题:统计出正奇数,正偶数,负奇数,负偶数以及零的个数.五.实验过程1.流程图2.源代码DATA SEGMENTNUM DW 0,0,1,2,3,4,5,101,-6,-7,-8,-8,-9 ;有2个0,6 个正数,5 个负数N DW ($-NUM)/2 ;该组数据的个数Z DB 0 ;0 的个数P DB 0 ;正数的个数PO DB 0 ;正奇数的个数PE DB 0;正偶数的个数M DB 0 ;负数的个数MO DB 0;负奇数的个数ME DB 0 ;负偶数的个数STR0 DB 'number of zeros : $' ;STR0-4为用于显示的字符串STR1 DB 0DH, 0AH, 'number of positive numbers : $'STR2 DB 0DH, 0AH, 'number of negative numbers : $'STR3 DB 0DH, 0AH, ' odd : $'STR4 DB ' even : $'DATA ENDSSTACK SEGMENT STACKDW 100 DUP(?)STACK ENDSCODE SEGMENTASSUME DS:DATA, SS:STACK, CS:CODESTART: MOV AX, DATAMOV DS, AXMOV AX, STACKMOV SS, AX ;初始化DS、SSLEA BX, NUM ;将NUM 中第一个数字的地址送入BXMOV CX, N ;将数据个数送入CXAGAIN: MOV AX, [BX] ;取出NUM 中的第一个数字CMP AX, 0 ;和0比较JGE PLU ;大于等于0时转PLUINC M ;负数的个数加1TEST AX, 1 ;检测该数据最低位是否为1,即是否为负奇数JNZ MINODD ;ZF为0时转MINODD,该数为负奇数INC ME ;负偶数个数加1JMP NEXTMINODD: INC MO ;负奇数个数加1JMP NEXTPLU: JZ ZER ;等于0时转ZERINC P ;正数个数加1TEST AX, 1 ;检测该数据最低位是否为1,即是否为正奇数JNZ PLUODD ;ZF为0时转PLUODD,该数为正奇数INC PE ;正偶数个数加1JMP NEXTPLUODD: INC PO ;正奇数个数加1JMP NEXTZER: INC Z ;零的个数加1NEXT: ADD BX,2 ;偏移地址加2,指向下一数字LOOP AGAIN ;CX自减,CX≠0时继续循环DISPLAY: ;在屏幕上显示统计结果MOV AH, 09H ;9号功能调用,显示字符串MOV DX, OFFSET STR0 ;将字符串的首地址的偏移地址送到DX,DS已;是其段基址INT 21HMOV AH, 02H ;2号功能调用,显示单个字符MOV DL, Z ;将零的个数送到DLADD DL, 30H ;0—9数字本身加上30H即为其ASCII 码INT 21HMOV AH, 09H ;正数部分统计结果显示,原理同上MOV DX, OFFSET STR1INT 21HMOV AH, 02HMOV DL, PADD DL, 30HINT 21HMOV AH, 09HMOV DX, OFFSET STR3INT 21HMOV AH, 02HMOV DL, POADD DL, 30HINT 21HMOV AH, 09HMOV DX, OFFSET STR4INT 21HMOV AH, 02HMOV DL, PEADD DL, 30HINT 21HMOV AH, 09H ;负数部分统计结果显示,原理同上MOV DX, OFFSET STR2INT 21HMOV AH, 02HMOV DL, MADD DL, 30HINT 21HMOV AH, 09HMOV DX, OFFSET STR3INT 21HMOV AH, 02HMOV DL, MOADD DL, 30HINT 21HMOV AH, 09HMOV DX, OFFSET STR4INT 21HMOV AH, 02HMOV DL, MEADD DL, 30HINT 21HMOV AX, 4C00H ;返回DOSINT 21HCODE ENDSEND START3.运行结果数据为:0,0,1,2,3,4,5,101,-6,-7,-8,-8,-9运行结果:zero表示零的个数,为2;positive number表示正数的个数,为6,其中奇数odd为4个,偶数even为2个;negative number表示负数的个数,为5,其中奇数odd为2个,偶数even 为3个。
北邮模电综合实验报告

电子电路综合实验设计实验名称:阶梯波发生器的设计与实现学院:班级:学号:姓名:班内序号:实验6 阶梯波发生器的设计与实现一. 摘要阶梯波是一种特殊波形,在一些电子设备及仪表中用处极大。
本实验电路是由窄脉冲-锯齿波发生器构成。
通过将运算放大器的几个典型电路:方波发生器、积分器和迟滞电压比较器,加以改进组合,设计成了阶梯波发生器。
实验用两个二极管作为控制门,一个是阶梯波形成控制门,另一个是阶梯波返回控制门,控制阶梯波的周期。
调节相应电位器的阻值就能改变阶梯数、阶梯幅值和阶梯周期。
关键字:阶梯波方波发生器迟滞电压比较器积分器二. 实验任务及设计要求1、 基本要求:1) 利用所给元器件设计一个阶梯波发生器,500,3opp f H z U V ≥≥,阶数6N =;2) 设计该电路的电源电路(不要求实际搭建),用PROTEL 软件绘制完整的电路原理图(SCH )及印制电路板图(PCB )。
2、 提高要求:利用基本要求里设计的阶梯波发生器设计一个三极管输出特性测试电路,在示波器上可以观测到基极电流为不同值时的三极管的输出特性曲线束。
3、 探究环节:能否提供其他阶梯波发生器的设计方案?如果能提供,请通过仿真或实验对结果加以证明;三. 设计思路及结构框图1. 设计思路仔细阅读试验原理及要求分块设计阶梯波发生器窄带脉冲发生器积分器迟滞比较器计算电阻电容等器件参数计算机仿真若波形不符合则重新计算参数在电路板上搭建电路认真检查连接保证正确实验室实际调试2总体结构框图本实验中阶梯波发生器电路是由方波-三角波发生器与迟滞电压比较器构成。
图1中,运算放大器U1构成迟滞电压比较器,U3是积分器,U2为窄脉冲发生器。
两个二极管,其中D1是阶梯形成控制门,D2是阶梯返回控制门。
由于U2的同相输入端加入一个正参考电压,U2输出为负脉冲。
在负脉冲持续期间,二极管D1导通,积分器U3对负脉冲积分,其输出电压上升。
负脉冲消失后,D1截止,积分器输入、输出电位保持不变,则形成一个台阶,积分器U3的输出的阶梯波就是迟滞比较器U1的输入,该值每增加一个台阶,U1的输入电压增加一个值。
北邮数据库实验报告2模板
北京邮电大学实验报告课程名称:数据库系统原理实验名称:E-R建模与关系表转换网络工程系315班姓名王倩教师吴起凡成绩_________2016年4月5日实验二 E-R建模与关系表转换●实验目的1. 理解和掌握E-R图的基本概念。
2. 培养根据实际应用领域数据对象描述,抽取数据对象特征、关联关系等信息,设计数据库概念结构的能力。
3. 选做:学习Power Designer,进行数据模型转换和关系表的自动创建,培养软件辅助设计工具的使用能力。
●实验原理对GSM网络的各种配置资源,及资源之间的相互关系,如控制,分配给,相邻等,进行抽象,设计概念数据模型(CDM),形成E-R图,然后利用Power Designer 数据库概念设计工具,将数据库概念结构转化为物理结构,然后再转化为SQL脚本,从而在数据库中直接生成表结构。
●实验平台及环境1. 软硬件环境处理器:Inter(R) Core(TM) i5-2520M CPU 2.50GHz内存:2G操作系统:Windows 8.1 专业版,32位2. 工具实验平台: Microsoft SQL Server2012数据库管理系统数据库系统概念设计工具:Sybase Power Designer 12●实验内容1.根据数据需求描述抽象出E-R图阅读《GSM移动通信网络配置数据库》课程实验背景资料-11-v4.doc,根据GSM的基本概念,分析其中的数据需求,将其描述抽象成实体和联系,并确定实体和联系的属性,特别要注意标明其主键和外键等约束关系,最终形成E-R图。
2.将E-R图输入相关设计工具(Power Design)形成概念模型(CDM)。
3.使用工具将E-R图转换为数据库物理结构(PDM)。
4.将物理模型转化为生成数据库中的表和视图的脚本,注意要选择数据库为SQL Server。
5.执行SQL脚本,生成表和视图。
6.成功后,查看生成的表和视图的情况。
●实验步骤1. 需求分析GSM移动通信网络配置数据库是对通信网中的各种资源及各种资源之间的关系进行描述。
北邮实验报告封面
北邮实验报告封面篇一:北邮通原实验报告北京邮电大学通信原理实验报告班级:xxxxxxxx 专业:xxxxxx 姓名:xxxx 学号:xxxxx 同组人:xxxx目录通信原理实验报告 ................................................ ................................................... (1)实验一:双边带抑制载波调幅(DSB-AM) ........................................ (3)一、实验目的: .............................................. ................................................... . (3)二、实验系统框................................................... .. (3)三、实验步骤: .............................................. ................................................... . (4)四、实验结果: .............................................. ................................................... . (6)2.3 实验二:具有离散大载波的双边带调幅(AM) ............................................ .. (12)一、实验目的: .............................................. ................................................... .. (12)二、实验系统框图: .............................................. (12)三、实验步骤: .............................................. ................................................... .. (13)四、实验结果: .............................................. ................................................... .. (13)思考题: .............................................. ................................................... .. (17)实验三:调频(FM) ............................................ ................................................... (18)一、实验目的: .............................................. (18)二、实验系统框图: .............................................. ................................................... (18)三、实验步骤: .............................................. ................................................... .. (18)四、实验结果: .............................................. ................................................... .. (19)思考题: .............................................. ................................................... .. (21)实验六:眼图 ................................................ (23)实验目的 ................................................ ................................................... (23)实验步骤 ................................................ ................................................... (23)实验结果 ................................................ ................................................... (23)实验七:采样、判决 ................................................ ................................................... (24)实验目的 ................................................ (24)实验步骤 ................................................ ................................................... (24)实验结果 ................................................ ................................................... (24)实验总结: .............................................. ................................................... .. 错误!未定义书签。
北京邮电大学操作系统实验实验报告1
北京邮电大学操作系统实验实验报告操作系统实验实验报告实验日期:11月23日实验名称:实验一一、实验目的1.学习LINUX操作系统2.熟悉UNIX/LINUX的常用基本命令3.理解fork()与clone()函数的区别和联系4.深入理解生产者和消费者问题二、实验内容(1)安装LINUX:(2)熟悉UNIX/LINUX的常用基本命令如ls、who、wc、pwd、ps、pstree、top,cat,cd,chgrp,chmod,chown,comm,cmp,cp,rm,diff,mv,rmdir等,了解环境。
(3)比较fork()和clone()的功能,利用fork()生成子进程和clone()生成线程。
(4)利用pthread库,通过其中的mutex来实现生产者和消费者问题。
三、项目要求及分析基本要求:(1)安装LINUX:使用FEDORA11(2)熟悉UNIX/LINUX的常用基本命令如ls、who、wc、pwd、ps、pstree、top,cat,cd,chgrp,chmod,chown,comm,cmp,cp,rm,diff,mv,rmdir等,了解环境。
(3)比较fork()和clone()的功能,利用fork()生成子进程和clone()生成线程。
(4)利用pthread库,通过其中的mutex来实现生产者和消费者问题。
四、具体实现1.linux常用指令1.1 目录操作和DOS 相似,Linux 采用树型目录管理结构,由根目录开始一层层将子目录建下去,各子目录以“/”隔开。
用户login后,工作目录的位置称为home directory,由系统管理员设定。
‘—’符号代表自己的home directory,例如:~/myfile 是指自己home目录下myfile这个文件。
Linux 的通配符有三种:‘*’和‘?’用法与DOS相同,‘’代表区间内的任一字符,如test[05]即代表test0,test1,……,test5的集合。
北邮vhdl小学期实验报告
数字逻辑课程设计实验实验报告姓名徐同学、陈同学、连同学、朱同学、熊同学学院计算机学院专业计算机科学与技术班级 xxxxxxxxxx学号xxxxxxxxxx/xxxxxxxxxx/xxxxxxxxxx/xxxxxxxxxx/xxxxxxxxxx2015年7 月北京邮电大学课程设计报告课程设计名称数字逻辑学院计算机指导教师班级班内序号学号学生姓名成绩xxxxxxxxxx30 xxxxxxxxxx 徐同学xxxxxxxxxx14 xxxxxxxxxx 陈同学xxxxxxxxxx13 xxxxxxxxxx 连同学xxxxxxxxxx28 xxxxxxxxxx 朱同学xxxxxxxxxx26 xxxxxxxxxx 熊同学课程设计内容教学目的:掌握 QuartusII 软件的使用方法,用VHDL进行较复杂逻辑电路的设计和调试基本内容:1.交通灯控制 2.电子钟 3.药片装瓶系统团队分工:连同学:负责编写、调试交通灯。
徐同学、陈同学:负责编写、调试电子钟,其中徐同学负责实验报告的撰写朱同学、熊同学:负责编写调试药片装瓶系统。
课程设计报告(附页)课程设计成绩评定遵照实践教学大纲并根据以下四方面综合评定成绩:1、课程设计目的任务明确,选题符合教学要求,份量及难易程度2、团队分工是否恰当与合理3、综合运用所学知识,提高分析问题、解决问题及实践动手能力的效果4、是否认真、独立完成属于自己的课程设计内容,课程设计报告是否思路清晰、文字通顺、书写规范评语:成绩:指导教师签名:2015年月日注:评语要体现每个学生的工作情况,可以加页。
实验一:交通灯一、实验目的1)学习采用状态机方法设计时序逻辑电路2)掌握QuartusII软件的使用方法3)掌握用VHDL语言实现有限状态机4)掌握ISP器件的使用二、实验所用器件和设备可编程逻辑器件MAX7000S系列一片TEC_8实验系统一台USB—BLASTER下载线一条三、实验要求以实验台上的12个指示灯分别代表红,黄,绿三种信号的灯。