Strain path dependence of {1 0 -12}twinning activity in a polycrystalline magnesium alloy
聚合物环带球晶的结晶机理

聚合物环带球晶的结晶机理徐 军*,叶海木,刘 津,郭宝华(清华大学化工系高分子研究所,北京 100084)摘要:聚合物环带球晶作为一类特殊的球晶结构,其结晶机理一直倍受关注。
经过几十年的研究,对于环带球晶形成机理的认识在不断深入,但是仍有许多问题尚未解决。
本文总结了常见聚合物环带球晶的分类,综述了国内外在聚合物环带球晶片晶组织形式和片晶扭转机理研究上的主要进展,力图展示聚合物环带球晶研究的整体概况。
根据前期研究结果,总结了手性聚羟基脂肪酸酯环带球晶的形成机理。
最后,提出了目前环带球晶研究中尚未解决的一些问题。
关键词:环带球晶;片晶;组织方式;片晶扭转引言环带球晶(banded spherulite)是在正交偏光显微镜下,不仅显示M altese黑十字,还呈现出明暗交替的周期性带状结构的一类球晶。
通常情况下,这些明暗相间的条带在球晶中呈同心环形,有时又被称为环状球晶(ringed spherulite)。
多种聚合物,如聚乙烯、聚偏氟乙烯、聚酯和聚酰胺等,在一定的条件下,均可以形成环带球晶[1,2]。
此外,一些小分子结晶时,也能形成环带球晶[3]。
聚合物环带球晶以其美丽的外表和神秘的内部结构吸引了众多研究者的关注。
目前,聚合物环带球晶的研究已有50多年的历史了,对环带球晶的微观结构和形成机理的认识在不断深入,但是对环带球晶中片晶的组织形式和片晶扭转的驱动力方面,仍然有不同的看法,许多问题尚待解决。
本文参考相关文献和笔者在可降解聚酯环带球晶中的研究结果,拟总结聚合物环带球晶的种类及其形成机理。
读者还可以参考近年来的两篇综述,分别总结了聚合物环带球晶中表面应力的来源[2]和国内外聚合物环带球晶研究的进展[1]。
本文将主要集中于环带球晶中片晶的组织形式以及单根片晶扭转的动态过程和微观机制。
关于聚合物环带球晶的文献不胜枚举,疏漏之处,欢迎批评指正。
1 聚合物环带球晶的种类偏光显微镜是观察环带球晶最直接、最简单的方法。
SBN陶瓷英文文献

Ferroelectric and piezoelectric properties of tungsten substituted SrBi 2Ta 2O 9ferroelectric ceramicsIndrani Coondoo *,S.K.Agarwal a ,A.K.Jha ba Superconductivity and Cryogenics Division,National Physical Laboratory,Dr K.S.Krishnan Road,New Delhi 110012,India bDepartment of Applied Physics,Delhi College of Engineering,Bawana Road,Delhi 110042,India1.IntroductionDefects in crystals significantly influence physical and various other properties of materials [1].For instance,as it is well known,doping by other elements leads to significant changes in the electrical properties of silicon.Historically,‘‘defect engineering’’has been developed in the field of semiconducting materials such as compound semiconductors as well as in diamond,Si and Ge [2–4].Subsequently,the concept of defect engineering has been applied to other functional materials,and the significant improve-ment in material properties have been achieved in high transition-temperature superconductors [5],amorphous SiO 2[6],photonic crystals [7]and also in the field of ferroelectrics,such as BaTiO 3,Pb(Ti,Zr)O 3(PZT),etc.[8,9].Various structural and electrical properties of bismuth layer-structured ferroelectrics (BLSF)are also strongly affected on deviation from stoichiometric composi-tions and defects have been recognized as a crucially important factor [10–13].It has been found that in BLSF small changes in chemical composition result in significantly altered dielectric and ferroelectric properties including dielectric constant and remanent polarization.In SrBi 2Ta 2O 9(SBT)and SrBi 2Nb 2O 9(SBN),orthor-hombic structural distortions with non-centrosymmetric spacegroup A 21am cause spontaneous ferroelectric polarization (P s )along a axis [14,15].SBT,a member of the BLSF family,has occupied an important position among the Pb-free ferroelectric memory materials [16–18].Tungsten (W 6+)has recently been investigated as a dopant for bismuth titanates and lanthanum doped bismuth titanates,in which the remanent polarization was observed to enhance when a small amount of Ti 4+was substituted by W 6+[19,20].With the objective to improve structural,dielectric and ferroelectric proper-ties,the hexavalent tungsten (W 6+)was chosen as a donor cation for partial replacement of the pentavalent tantalum (Ta 5+)SBT.In this report,the effect of tungsten substitution in SBT (SBTW),on the microstructural,ferroelectric and piezoelectric properties is reported.The results including the improvement in polarization properties have been discussed.2.ExperimentalSamples of compositions SrBi 2(W x Ta 1Àx )2O 9(SBWT),with x =0.0,0.025,0.050,0.075,0.10and 0.20were synthesized by solid-state reaction method taking SrCO 3,Bi 2O 3,Ta 2O 5and WO 3(all from Aldrich)in their stoichiometric proportions.The powder mixtures were thoroughly ground and passed through sieve of appropriate size and then calcined at 9008C in air for 2h.The calcined mixtures were ground and admixed with about 1–1.5wt%polyvinyl alcohol (Aldrich)as a binder and then pressed at $300MPa into disk shaped pellets.The pellets were sintered at 12008C for 2h in air.Materials Research Bulletin 44(2009)1288–1292A R T I C L E I N F O Article history:Received 3October 2008Received in revised form 5December 2008Accepted 6January 2009Available online 15January 2009Keywords:A.CeramicsC.X-ray diffractionD.FerroelectricityA B S T R A C TTungsten substituted samples of compositions SrBi 2(W x Ta 1Àx )2O 9(x =0.0,0.025,0.050,0.075,0.10and 0.20)were synthesized by solid-state reaction method and studied for their microstructural,electrical conductivity,ferroelectric and piezoelectric properties.The X-ray diffractograms confirm the formation of single phase layered perovskite structure in the samples with x up to 0.05.The temperaturedependence of dc conductivity vis-a`-vis tungsten content shows a decrease in conductivity,which is attributed to the suppression of oxygen vacancies.The ferroelectric and piezoelectric studies of the W-substituted SBT ceramics show that the remanent polarization and d 33values increases with increasing concentration of tungsten up to x 0.05.Such compositions with low conductivity and high P r values should be excellent materials for highly stable ferroelectric memory devices.ß2009Elsevier Ltd.All rights reserved.*Corresponding author.Present address:Liquid Crystal Group,National Physical Laboratory,Dr K.S.Krishnan Road,New Delhi 110012,India.Tel.:+919810361727;fax:+911125170387.E-mail address:indrani_coondoo@ (I.Coondoo).Contents lists available at ScienceDirectMaterials Research Bulletinj o ur n a l h o m e p a g e :w w w.e l se v i e r.c om /l oc a t e /m a t r e sb u0025-5408/$–see front matter ß2009Elsevier Ltd.All rights reserved.doi:10.1016/j.materresbull.2009.01.001X-ray diffractograms of the sintered samples were recorded using a Bruker diffractometer in the range 108 2u 708with CuK a radiation.The sintered pellets were polished to a thickness of 1mm and coated with silver paste on both sides for use as electrodes and cured at 5508C for half an hour.Electrical conductivity was performed using Keithley’s 6517A Electrometer.The polarization–electric field (P –E )hysteresis measurements were done at room temperature using an automatic P –E loop tracer based on Sawyer–Tower circuit.Piezoelectric charge co-efficient d 33was measured using a Berlincourt d 33meter after poling the samples in silicone–oil bath at 2008C for half an hour under a dc electric field of 60–70kV/cm.3.Results and discussion3.1.Structural and micro-structural studiesThe phase formation and crystal structure of the ceramics were examined by X-ray diffraction (XRD),which is shown in Fig.1.The XRD patterns of the samples show the characteristic peaks of SBT.The peaks have been indexed with the help of a computer program–POWDIN [21]and the refined lattice parameters are given in Table 1.It is observed that a single phase layered perovskite structure is maintained in the range 0.0 x 0.05.Owing to the same co-ordination number i.e.6and the smallerionic radius of W (0.60A˚)in comparison to Ta (0.64A ˚),there is a high possibility of tungsten occupying the tantalum site.The observance of unidentified peak of very low intensity in the compositions with x >0.05indicates the solubility limit of W concentration in SBT.The unidentified peak is possibly due to tungsten not occupying the Ta sites in the structure as the intensity of this peak is observed to increase with tungsten content.Composition and sintering temperature influences the micro-structure such as grain growth and densification of the specimen,which in turn control other properties of the material [11,13].The effects of W substitution on the microstructure have been examined by SEM and the obtained micrographs are shown in Fig.2.It shows the microstructure of the fractured surface of the studied samples.It is clearly observed that W substitution has pronounced effect on the average grain size and homogeneity of the grains.Randomly oriented and anisotropic plate-like grains are observed in all the samples.It is also observed that the average grain size increases gradually with increasing W content.The average grain size in the sample with x =0.0is $2–3m m while that in the sample with x =0.20the size increases to $5–7m m.3.2.Electrical studiesThe electrical conductivity of ceramic materials encompasses a wide range of values.In insulators,the defects w.r.t.the perfect crystalline structure act as charge carriers and the consideration of charge transport leads necessarily to the consideration of point defects and their migration [22].Many mechanisms were put forward to explain the conductivity mechanism in ceramics.Most of them are approximately divided into three groups:electronic conduction,oxygen vacancies ionic conduction,and ionic and p-type mixed conduction [22].Intrinsic conductivity results from the movement of the component ions,whereas conduction resulting from the impurity ions present in the lattice is known as extrinsic conductivity.At low temperature region (ferroelectric phase),the conduction is dominated by the extrinsic conduction,whereas the conduction at the high-temperature paraelectric phase ($300–7008C)is dominated by the intrinsic ionic conduction [23,25].Fig.3shows the temperature dependence of dc conductivity (s dc )for the undoped and doped SBT samples.The curves show that the conductivity increases with temperature.This is indicative of negative temperature coefficient of resistance (NTCR)behavior,a characteristic of dielectrics [22].It is observed in Fig.3that throughout the temperature range,the dc conductivity of the doped samples are nearly two to three orders lower than that of the undoped sample.Two predominant conduction mechanisms indicated by slope changes in the two different temperature regions are observed in Fig.3.Such changes in the slope in the vicinity of the ferro-paraelectric transition region have been observed in other ferroelectric materials as well [23,24].In addition,it is also observed (Table 2)that the activation energy calculated using the Arrhenius equation [22]in the paraelectric phase increase from $0.80eV for the undoped sample to $2eV for the doped samples.The X-ray photoemission spectroscopic study has confirmed that when Bi 2O 3evaporates during high-temperature processing,vacancy complexes are formed in the (Bi 2O 2)2+layers [26].As a result,defective (Bi 2O 2)2+layers are inherently present in SBT.The undoped SBT shows n-type conductivity,since when oxygen vacancies are created,it leaves behind two trapped electrons [27]:O o !12O 2"þV o þ2e 0(1)where O o is an oxygen ion on an oxygen site,V o is a oxygen vacant site and e 0represents electron.The conductivity in the perovskites can be described as an ordered diffusion of oxygen vacancies [28].Their motion is manifested by enhanced ionic conductivity associated with an activation energy value of $1eV [26].These oxygen vacancies can be suppressed by addition of donors,since the donor oxide contains more oxygen per cation than the host oxide it replaces [29].It has been reported that conductivity in Bi 4Ti 3O 12(BIT)can be significantly decreased,up to three orders of magnitude with the addition of donors,such as Nb 5+and Ta 5+at the Ti 4+sites [23,30].A few other studies on layered perovskites have also reported a decrease inconductivityFig.1.XRD patterns of SrBi 2(W x Ta 1Àx )2O 9samples sintered at 12008C.Table 1Lattice parameters of SrBi 2(W x Ta 1Àx )2O 9samples.Concentration of W a (A ˚)b (A ˚)c (A ˚)0.0 5.5212 5.513924.92230.025 5.5214 5.520225.10790.05 5.5217 5.519925.05850.075 5.5191 5.504525.05670.10 5.5142 5.506125.0850.205.51335.493925.0861I.Coondoo et al./Materials Research Bulletin 44(2009)1288–12921289with addition of donors [23,24,31].In the present study,the Ta 5+-site substitution by W 6+in SBT can be formulated using a defect chemistry expression as WO 3þV o!Ta 2O 512W Ta þ3O o (2)It shows that the oxygen vacancies are reduced upon the substitution of donor W 6+ions for Ta 5+ions.Hence,it is reasonable to believe that the conductivity in SBT is suppressed by donor addition.As per the above discussion,the high s dc observed in the undoped SBT (Fig.3)can be attributed to the motion of oxygen vacancies.As already discussed,the doped samples show reduced conductivity because the transport phenomena involving oxygen vacancies are greatly reduced.The high E a value of $1.75–2eVcorresponding to the high-temperature region in the doped ceramics is consistent with the fact that in the donor-doped materials,the ionic conduction reduces [32].The activation energy E a in the low temperature ferroelectric region (Table 2)corre-sponds to extrinsic conduction.At lower temperatures the extrinsic conductivity results from the migration of impurity ions in the lattice.Some of these impurities may also be associated with lattice defects.Pure SBT has large number of Schottky defects (oxygen vacancies)in addition to impurity ions whereas in the doped samples,due to charge neutrality,there is relatively less content of oxygen vacancies.Thus,in the doped samples the conductivity in the low temperature region is largely due to the impurity ions only.This explains the high activation energy in pure SBT in the low temperature region compared to doped samples (Table 2).In the high-temperature region,the value of E a in the doped samples is observed to increase with W concentration up to x =0.05but beyond that,it decreases (Table 2).The decrease in the activation energy for samples with x >0.05suggests an increase in the concentration of mobile charge carriers [33].This observation can be ascribed to the existence of multiple valence states of tungsten.Since tungsten is a transitional metal element,the valence state of W ions in a solid solution most likely varies from W 6+to W 4+depending on the surrounding chemical environment [34].When W 4+are substituted for the Ta 5+sites,oxygen vacancies would be created,i.e.one oxygen vacancy would be created for every two tetravalent W ions entering the crystal structure,whichFig.3.Variation of dc conductivity with temperature in SrBi 2(W x Ta 1Àx )2O 9samples.Fig.2.SEM micrographs of fractured surfaces of SrBi 2(W x Ta 1Àx )2O 9samples with (a)x =0.0,(b)x =0.025,(c)x =0.050,(d)x =0.075,(e)x =0.10and (f)x =0.20Table 2Activation energy (E a )in the high-temperature paraelectric region and low temperature ferroelectric region;Curie temperature (T c )in SrBi 2(W x Ta 1Àx )2O 9samples.Concentration of W E a (high temp.)(eV)E a (low temp.)(eV)T c (8C)0.00.790.893110.025 1.920.593080.05 1.960.543250.075 1.940.543380.10 1.860.573680.201.740.54390I.Coondoo et al./Materials Research Bulletin 44(2009)1288–12921290explains the increase in the concentration of mobile charge carriers which ultimately results in an decrease in the E a beyond x>0.05. Hence it is reasonable to conclude that W ions in the SBWT exists as a varying valency state,i.e.at lower doping concentration they exist in hexavalent state(W6+)and at a higher doping concentra-tion,they tend to exist in lower valency states[8].The P–E loops of SrBi2(Ta1Àx W x)2O9are shown in Fig.4.It is observed that W-doping results in formation of well-defined hysteresis loops.Fig.5shows the compositional dependence of remanent polarization(2P r)and the coercivefield(2E c)of SrBi2(Ta1Àx W x)2O9samples.Both the parameters depend on W content of the samples.It is observed that2P rfirst increases with x and then decreases while2E cfirst decreases with x and then increases(Fig.5).The optimum tungsten content for maximum2P r ($25m C/cm2)is observed to be x=0.075.It is known that ferroelectric properties are affected by compositional modification,microstructural variation and lattice defects like oxygen vacancies[10,35,36].In hard ferroelectrics, with lower valent substituents,the associated oxide vacancies are likely to assemble in the vicinity of domain walls[37,38].These domains are locked by the defects and their polarization switching is difficult,leading to an increase in E c and decrease in P r[38]. On the other hand,in soft ferroelectrics,with higher valent substituents,the defects are cation vacancies whose generation in the structure generally increases P r.Similar observations have been made in many reports[38–41].Watanabe et al.[42]reported a remarkable improvement in ferroelectric properties in the Bi4Ti3O12ceramic by adding higher valent cation,V5+at the Ti4+ site.It has also been reported that cation vacancies generated by donor doping make domain motion easier and enhance the ferroelectric properties[43].Further,it is known that domain walls are relatively free in large grains and are inhibited in their movement as the grain size decreases[44].In the larger grains, domain motion is easier which results in larger P r.Also for the SBT-based system,it is known that with increase in the grain size the remanent polarization also increases[45,46].Based on the obtained results and above discussion,it can be understood that in the undoped SBT,the oxygen vacancies assemble at sites near domain boundaries leading to a strong domain pinning.Hence,as observed,well-saturated P–E loop for pure SBT is not obtained.But in the doped samples,the suppression of the oxygen vacancies reduces the pinning effect on the domain walls,leading to enhanced remanent polarization and lower coercivefield.Also,the increase in grain size in tungsten added SBT,as observed in SEM micrographs(Fig.2)contribute to the increase in polarization values.In the present study,the grain size is observed to increase with increasing W concentration.However, the2P r values do not monotonously increase and neither the E c decreases continuously with increasing W concentration(Fig.5). The variation of P r and E c beyond x>0.05,seems possibly affected by the presence of secondary phases(observed in XRD diffracto-grams),which hampers the switching process of polarization [47–50].Also,beyond x>0.05the increase in the number of charge carriers in the form of oxygen vacancies leads to pinning of domain walls and thus a reduction in the values of P r and increase in E c is observed.Fig.6shows the variation of piezoelectric charge coefficient d33 with x in the SrBi2(Ta1Àx W x)2O9.The d33values increases with increase in W content up to x=0.05.A decrease in d33values is observed in the samples with x!0.075.The piezoelectric coefficient,d33,increases from13pC/N in the sample with x=0.0to23pC/N in the sample with x=0.05.It is known that the major drawback of SBT is its relatively higher conductivity,which hinders proper poling[51].High resistivity is therefore important for maintenance of poling efficiency at high-temperature[52,53].The W-doped SBT samples show an electrical conductivity value up to three orders of magnitude lower than that of undoped sample(Fig.3).The positional variation of2P r and2E c in SrBi2(W x Ta1Àx)2O9samples.Fig.6.Variation of d33in SrBi2(W x Ta1Àx)2O9samples.Fig. 4.P–E hysteresis loops in SrBi2(W x Ta1Àx)2O9samples recorded at roomtemperature.I.Coondoo et al./Materials Research Bulletin44(2009)1288–12921291decrease in conductivity upon donor doping improve the poling efficiency resulting in the observed higher d33values.Moreover, since the grain size increases with W content in SBT,it is reasonable to believe that the increase in grain size will also contribute to the increase in d33values[54].The decrease in the value of d33for samples with x!0.075is possibly due to the presence of secondary phases as observed in diffractograms[1,51,55]and the increase in oxygen vacancies for samples with x>0.05.4.ConclusionsX-ray diffractograms of the samples reveal that the single phase layered perovskite structure is maintained in the samples with tungsten content x0.05.SEM micrographs reveal that the average grain size increases with increase in W concentration. The temperature dependence of the electrical conductivity shows that tungsten doping results in the decrease of conductivity by up to three order of magnitude compared to W free SBT.All the tungsten-doped ceramics have higher2P r than that of the undoped sample.The maximum2P r($25m C/cm2)is obtained in the composition with x=0.075.The reduced conductivity allows high-temperature poling of the doped samples.Such compositions with low loss and high P r values should be excellent materials for highly stable ferroelectric memory devices.The d33value is observed to increase with increasing W content up to x0.05.The value of d33 in the composition with x=0.05is$23pC/N as compared to$13 pC/N in the undoped sample.AcknowledgmentsThe authors sincerely thank Prof.P.B.Sharma,Dean,Delhi College of Engineering,India for his generous support and providing ample research infrastructure to carry out the research work.The authors are thankful to Dr.S.K.Singhal,Scientist, National Physical Laboratory,India for his fruitful discussion and suggestions.References[1]Y.Noguchi,M.Miyayama,K.Oikawa,T.Kamiyama,M.Osada,M.Kakihana,Jpn.J.Appl.Phys.41(2002)7062.[2]A.Bonaparta,P.Giannozzi,Phys.Rev.Lett.84(2000)3923.[3]S.Connell,E.Siderashaddad,K.Bharuthram,C.Smallman,J.Sellschop,M.Bos-senger,Nucl.Instrum.Methods B85(1994)508.[4]T.Derry,R.Spits,J.Sellschop,Mater.Sci.Bull.11(1992)249.[5]K.Salama,D.F.Lee,Supercond.Sci.Technol.7(1994)177.[6]H.Hosono,Y.Ikuta,T.Kinoshita,M.Hirano,Phys.Rev.Lett.87(2001)175501.[7]S.Noda,A.Chutinan,M.Imada,Nature407(1999)608.[8]S.Shannigrahi,K.Yao,Appl.Phys.Lett.86(2005)092901.[9]G.H.Heartling,nd,J.Am.Ceram.Soc.54(1971)1.[10]H.Watanabe,T.Mihara,H.Yoshimori,C.A.Paz De Araujo,Jpn.J.Appl.Phys.34(1995)5240.[11]T.Atsuki,N.Soyama,T.Yonezawa,K.Ogi,Jpn.J.Appl.Phys.34(1995)5096.[12]T.Noguchi,T.Hase,Y.Miyasaka,Jpn.J.Appl.Phys.35(1996)4900.[13]M.Noda,Y.Matsumuro,H.Sugiyama,M.Okuyama,Jpn.J.Appl.Phys.38(1999)2275.[14]R.E.Newnham,R.W.Wolfe,R.S.Horsey,F.A.D.Colon,M.I.Kay,Mater.Res.Bull.8(1973)1183.[15]A.D.Rae,J.G.Thompson,R.L.Withers,Acta Crystallogr.Sect.B:Struct.Sci.48(1992)418.[16]H.M.Tsai,P.Lin,T.Y.Tseng,J.Appl.Phys.85(1999)1095.[17]Y.Shimakawa,Y.Kubo,Y.Nakagawa,T.Kamiyama,H.Asano,F.Izumi,Appl.Phys.Lett.74(1999)1904.[18]Y.Noguchi,M.Miyayama,T.Kudo,Phys.Rev.B63(2001)214102.[19]J.K.Kim,T.K.Song,S.S.Kim,J.Kim,Mater.Lett.57(2002)964.[20]W.T.Lin,T.W.Chiu,H.H.Yu,J.L.Lin,S.Lin,J.Vac.Sci.Technol.A21(2003)787.[21]Wu E.,POWD,An interactive powder diffraction data interpretation and indexingprogram Ver2.1,School of Physical Science,Flinders University of South Australia, Bedford Park,S.A.JO42AU.[22]R.C.Buchanan,Ceramic Materials for Electronics:Processing,Properties andApplications,Marcel Dekker Inc.,New York,1998.[23]H.S.Shulman,M.Testorf,D.Damjanovic,N.Setter,J.Am.Ceram.Soc.79(1996)3124.[24]M.M.Kumar,Z.G.Ye,J.Appl.Phys.90(2001)934.[25]Y.Wu,G.Z.Cao,J.Mater.Res.15(2000)1583.[26]B.H.Park,S.J.Hyun,S.D.Bu,T.W.Noh,J.Lee,H.D.Kim,T.H.Kim,W.Jo,Appl.Phys.Lett.74(1999)1907.[27]C.A.Palanduz,D.M.Smyth,J.Eur.Ceram.Soc.19(1999)731.[28]C.R.A.Catlow,Superionic Solids&Solid Electrolytes,Academic Press,New York,1989.[29]M.V.Raymond,D.M.Symth,J.Phys.Chem.Solids57(1996)1507.[30]S.S.Lopatin,T.G.Lupriko,T.L.Vasiltsova,N.I.Basenko,J.M.Berlizev,Inorg.Mater.24(1988)1328.[31]M.Villegas,A.C.Caballero,C.Moure,P.Duran,J.F.Fernandez,J.Eur.Ceram.Soc.19(1999)1183.[32]Y.Wu,G.Z.Cao,J.Mater.Sci.Lett.19(2000)267.[33]B.H.Venkataraman,K.B.R.Varma,J.Phys.Chem.Solids66(2005)1640.[34]C.D.Wagner,W.M.Riggs,L.E.Davis,F.J.Moulder,Handbook of X-ray Photoelec-tron Spectroscopy,Perkin Elmer Corp.,Chapman&Hall,1990.[35]Y.Noguchi,I.Miwa,Y.Goshima,M.Miyayama,Jpn.J.Appl.Phys.39(2000)1259.[36]M.Yamaguchi,T.Nagamoto,O.Omoto,Thin Solid Films300(1997)299.[37]W.Wang,J.Zhu,X.Y.Mao,X.B.Chen,Mater.Res.Bull.42(2007)274.[38]T.Friessnegg,S.Aggarwal,R.Ramesh,B.Nielsen,E.H.Poindexter,D.J.Keeble,Appl.Phys.Lett.77(2000)127.[39]Y.Noguchi,M.Miyayama,Appl.Phys.Lett.78(2001)1903.[40]Y.Noguchi,I.Miwa,Y.Goshima,M.Miyayama,Jpn.J.Appl.Phys.39(2000)L1259.[41]B.H.Park,B.S.Kang,S.D.Bu,T.W.Noh,L.Lee,W.Joe,Nature(London)401(1999)682.[42]T.Watanabe,H.Funakubo,M.Osada,Y.Noguchi,M.Miyayama,Appl.Phys.Lett.80(2002)100.[43]S.Takahashi,M.Takahashi,Jpn.J.Appl.Phys.11(1972)31.[44]R.R.Das,P.Bhattacharya,W.Perez,R.S.Katiyar,Ceram.Int.30(2004)1175.[45]S.B.Desu,P.C.Joshi,X.Zhang,S.O.Ryu,Appl.Phys.Lett.71(1997)1041.[46]M.Nagata,D.P.Vijay,X.Zhang,S.B.Desu,Phys.Stat.Sol.(a)157(1996)75.[47]J.J.Shyu,C.C.Lee,J.Eur.Ceram.Soc.23(2003)1167.[48]I.Coondoo,A.K.Jha,S.K.Agarwal,Ferroelectrics326(2007)35.[49]T.Sakai,T.Watanabe,M.Osada,M.Kakihana,Y.Noguchi,M.Miyayama,H.Funakubo,Jpn.J.Appl.Phys.42(2003)2850.[50]C.H.Lu,C.Y.Wen,Mater.Lett.38(1999)278.[51]R.Jain,V.Gupta,A.Mansingh,K.Sreenivas,Mater.Sci.Eng.B112(2004)54.[52]I.S.Yi,M.Miyayama,Jpn.J.Appl.Phys.36(1997)L1321.[53]A.J.Moulson,J.M.Herbert,Electroceramics:Materials,Properties,Applications,Chapman&Hall,London,1990.[54]H.T.Martirena,J.C.Burfoot,J.Phys.C:Solid State Phys.7(1974)3162.[55]R.Jain,A.K.S.Chauhan,V.Gupta,K.Sreenivas,J.Appl.Phys.97(2005)124101.I.Coondoo et al./Materials Research Bulletin44(2009)1288–1292 1292。
《金属学原理》各章习题及解答(晶体的塑性变形)
第8 章晶体的塑性形变题解1. 细铜棒两端固定,从100°C 冷却到0°C,问发生的内应力有多大?铜的热膨胀系数=1.5×10⁻⁶/°C,弹性模量E=1.103×1011 Pa)。
解:设棒长为 1 ,热膨胀系数α=1.5×10⁻⁶/°C ,从100°C 冷却到0°C 棒收缩量∆L=α∆T=1.5×10-6×100=1.5×10⁻⁴,如果棒仍保持弹性范围,根据胡克定律,内应力σ应为:σ=Eε=1 ×11 ××−4 =×7.103 10 1.5 10 Pa 1.65 10 Pa2. 板材轧制时,设弹性变形量从表面到中心是线性的。
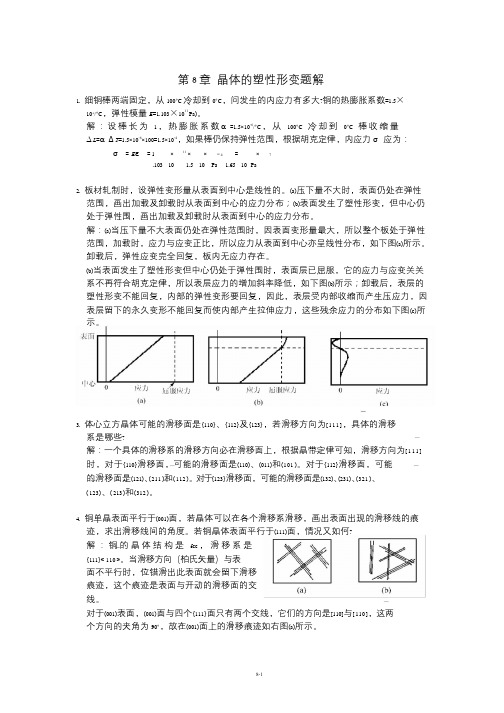
(a)压下量不大时,表面仍处在弹性范围,画出加载及卸载时从表面到中心的应力分布;(b)表面发生了塑性形变,但中心仍处于弹性围,画出加载及卸载时从表面到中心的应力分布。
解:(a)当压下量不大表面仍处在弹性范围时,因表面变形量最大,所以整个板处于弹性范围,加载时,应力与应变正比,所以应力从表面到中心亦呈线性分布,如下图(a)所示。
卸载后,弹性应变完全回复,板内无应力存在。
(b)当表面发生了塑性形变但中心仍处于弹性围时,表面层已屈服,它的应力与应变关关系不再符合胡克定律,所以表层应力的增加斜率降低,如下图(b)所示;卸载后,表层的塑性形变不能回复,内部的弹性变形要回复,因此,表层受内部收缩而产生压应力,因表层留下的永久变形不能回复而使内部产生拉伸应力,这些残余应力的分布如下图(c)所示。
3. 体心立方晶体可能的滑移面是{110}、{112}及{123},若滑移方向为[111],具体的滑移系是哪些?解:一个具体的滑移系的滑移方向必在滑移面上,根据晶带定律可知,滑移方向为[111] 时,对于{110}滑移面,可能的滑移面是(110)、(011)和(101 )。
单斜相阿利特的晶体结构研究(英文)

Recent work have concerned the identification of stabilized modifications at room temperature due to the importance in the quality control of Portland cement. Differential thermal analysis (DTA) showes the T1–T2 transi-
The objective of this paper was to describe the superstructures of the monoclinic modification of C3S. Some indices for describing the reflections due to the superstructures were proposed to express the orientations and
1 Experimental
The specimens were provided by China Building Materials Academy (CBMA). A selected-area electron diffraction (SAED) technique was applied to record the reflections. A TEM device (Model JEM–2010UHR, JEOL, Tokyo, Japan) equipped with a double tilt goniometry was used to record the HRTEM images at an accelerating voltage of 200 kV. The preparation of specimens for the TEM was performed by a conventional method applied for the observation of ceramic powders except for the dispersion of the specimens in ethanol. Table 1 shows the chemical compositions of the specimens, which was provided by the CBMA. The three specimens are remarked as A, B, and C.
阿贡实验室RietveldRefinementwithGSAS

5
Errors & parameters?
position – lattice parameters, zero point (not common)
- other systematic effects – sample shift/offset shape – profile coefficients (GU, GV, GW, LX, LY, etc. in GSAS) intensity – crystal structure (atom positions & thermal parameters)
9
So how does Rietveld refinement work?
Rietveld Minimize
MR w(Io Ic )2
Io
Exact overlaps - symmetry
Incomplete overlaps
SIc
Residuals:
Rwp
w(I o Ic )2
wI
c2
Least-squares cycles
False minimum
True minimum – “global” minimum
parameter c2 surface shape depends on parameter suite
3
Fluoroapatite start – add model (1st choose lattice/sp. grp.)
c
5i
ig
i
i1
18
wo3-乙醇气敏材料
Temperature and acidity effects on WO 3nanostructures and gas-sensing properties of WO 3nanoplatesHuili Zhang a ,Zhifang Liu b ,Jiaqin Yang b ,Wei Guo b ,Lianjie Zhu a ,*,Wenjun Zheng b ,**aSchool of Chemistry and Chemical Engineering,Tianjin Key Laboratory of Organic Solar Cells and Photochemical Conversion,Tianjin University of Technology,Tianjin 300384,PR China bDepartment of Materials Chemistry,Key Laboratory of Advanced Energy Materials Chemistry (MOE),TKL of Metal and Molecule-based Material Chemistry,Synergetic Innovation Centre of Chemical Science and Engineering (Tianjin),College of Chemistry,Nankai University,Tianjin 300071,PR ChinaA R T I C L E I N F OArticle history:Received 4January 2014Received in revised form 28May 2014Accepted 11June 2014Available online 12June 2014Keywords:Nanostructures SolvothermalElectron microscopy X-ray diffractionA B S T R A C TWO 3nanostructures were successfully synthesized by a facile hydrothermal method using Na 2WO 4Á2H 2O and HNO 3as raw materials.They are characterized by X-ray diffraction (XRD),scanning electron microscope (SEM)and transmission electron microscope (TEM).The speci fic surface area was obtained from N 2adsorption –desorption isotherm.The effects of the amount of HNO 3,hydrothermal temperature and reaction time on the crystal phases and morphologies of the WO 3nanostructures were investigated in detail,and the reaction mechanism was rge amount of acid is found for the first time to be helpful to the oriented growth of tungsten oxides,forming nanoplate-like products,while hydrothermal temperature has more in fluence on the crystal phase of the product.Gas-sensing properties of the series of as-prepared WO 3nanoplates were tested by means of acetone,ethanol,formaldehyde and ammonia.One of the WO 3nanoplates with high speci fic surface area and high crystallinity displays high sensitivity,fast response and distinct sensing selectivity to acetone gas.ã2014Elsevier Ltd.All rights reserved.1.IntroductionAs an n -type indirect band gap semiconductor,WO 3has attracted much attention and been studied extensively in recent years.So far,many methods have been reported for synthesis of WO 3nanomaterials with various morphologies,such as nano-plates [1–5],nanorods [6–8],nanowires [9–11],nanoparticles [12]and nano fibres [13]etc .Recently,Zou et al.have prepared a new WO 3nanoplate via a simple thermal treatment process from a W-containing inorganic –organic nanohybrid precursor [14].Leaf-like WO 3nanoplatelets were fabricated via aging treatment of the precursor solutions obtained by pulsed laser ablating pure tungsten target immersed in deionized water [15].Ma et al.have prepared triclinic WO 3nanoplates by a simple hydrothermal method at various temperatures using Na 2WO 4Á2H 2O and HBF 4as precursors [1].Nimittrakoolchai and Supothina have synthesized WO 3ÁH 2O and H 2WO 4ÁH 2O platelet particles by a precipitation method using (NH 4)10W 12O 41Á5H 2O and HNO 3as precursors,and investigated the effect of nitric concentration on the yield [16].However,so far,no reference has been found concerning the effectsof both hydrothermal temperature and the amount of acid on crystal phases and morphologies of WO 3nanostructures.WO 3nanostructures could be extensively applied in electro-chromic and photochromic devices [6,17–20],lithium ion batteries [21–22],photoelectrodes [23],photocatalysts [24–26],solar energy devices [27–28],field electron emission [29–30]and gas sensors [1,10,13,14,16,31–42]etc.Being one of the important gas-sensor materials,more and more WO 3nanomaterials with new structures or morphologies have been synthesized because the gas-sensing properties could be tuned by the structures and morphologies of the materials.For instance,WO 3nanowires [10],nano fibers [13],hollow microspheres [31],nanocrystals [32,33],thin films [34]and WO 3nanorods/graphene nanocomposites [35]have been used as the sensing materials for detection of nitrogen oxides,NH 3and ethylene.More gaseous species,such as H 2[14,34,36],ethanol [1,14,37,38],CO [14,37],H 2S [39],and ozone [37,40]could also be detected by WO 3-based nanocrystals and films.However,so far there are few reports on acetone [14,41]and formaldehyde [14]sensing properties of WO 3nanoplates although acetone and formaldehyde are harmful to health,as common reagents widely used in industries and labs.Besides,a nanoplate-like material normally has a high sensitivityand rapid response [42]due to the effective and rapid diffusion of the analyte gas onto the entire sensing surface through the two-dimensional (2D)nanostructures.Therefore,it is worthwhile studying the gas sensing properties of the 2D WO 3nanoplates.*Corresponding author.Tel.:+862260214259;fax:+862260214252.**Corresponding author.Tel.:+862223507951;fax:+862223502458.E-mail addresses:zhulj@ (L.Zhu),zhwj@ (W.Zheng)./10.1016/j.materresbull.2014.06.0130025-5408/ã2014Elsevier Ltd.All rights reserved.Materials Research Bulletin 57(2014)260–267Contents lists available at ScienceDirectMaterials Research Bulletinj o u r n a l h o m e p a g e :w w w.e l s e v i e r.c o m /l o c a t e /m a t r e s buHerein,a facile hydrothermal route was adopted for syntheses of series of WO3nanostructures.The effects of the amount of HNO3,hydrothermal temperature and reaction time on crystal phases and morphologies of WO3products were investigated and discussed.The formation mechanism of the WO3nanoplates was studied on the basis of control experiments.The gas-sensing properties of the as-prepared WO3on acetone,ethanol,formalde-hyde and ammonia were evaluated,and a nanoplate-like WO3 shows a high sensitivity,rapid response and distinct selectivity to acetone gas.2.Experimental2.1.Synthesis of WO3nanostructuresIn a typical procedure,0.3299g of Na2WO4Á2H2O(1mmol)was added into certain volume of distilled water and dissolved thoroughly under stirring.Then,certain amount of HNO3(w, 65%)was dropped into the solution and kept stirring for10min. The total volume of the solution was always kept to be25.0mL.The above mixture was transferred into a33.0mL of Teflon-lined stainless steel autoclave,sealed and kept in an electric oven at certain temperature for12h.The autoclave was then taken out and allowed to cool naturally to room temperature.The obtained precipitate was separated by centrifugation,washed by distilled water and absolute ethanol for three times,respectively,and dried at50 C.2.2.CharacterizationsThe XRD measurements were performed on a Rigaku D/max-2500diffractometer with Cu K a radiation(l=0.154056nm)at 40kV and100mA.The SEM images were taken with a JEOL JSM-6700F scanning electron microscope.The TEM and high resolution TEM(HRTEM)images of the WO3nanoplates were obtained on a JEOL JEM-2100F microscope operating at200kV.The N2adsorp-tion–desorption isotherm measurements were operated on a V-Sorb2800P surface area and pore size analyzer.2.3.Fabrication and test of WO3gas sensorsThe schematic illustration of the gas-sensing measurement and working principle of HW-30A system can be found in the references[1,43].The WO3nanoplates were slightly grinded with several drops of terpineol in an agate mortar.The formed slurry was coated onto an alumina tube with a diameter of1mm and length of4mm,positioned with a pair of Au electrodes and four Pt wires on both ends of the tube.After calcination at400 C for1h, the alumina tube was jointed with the measuring electric circuit.In order to improve the stability and repeatability,the gas-sensing element was aged at340 C for two weeks before the measure-ment.Acetone,ethanol,formaldehyde and ammonia with various concentrations were chosen to evaluate the gas-sensing properties of the as-prepared WO3.The sensor response is defined as S=R a/R g, where R a and R g are the electrical resistance of the sensor in air and in test gas,respectively.The response and recovery time is defined as the time for the sensor to reach90%of its maximum response and fall to10%of its maximum response,respectively.3.Results and discussion3.1.Effects of hydrothermal temperature and the amount of HNO3on the crystal phases and morphologies of the productsFig.1shows the crystal phase evolution of the products obtained at120 C using various amount of HNO3.When0.5mL of HNO3is used,the main product is orthorhombic WO3ÁH2O(JCPDS 43-0679)with a little impurity(Fig.1a).Increasing the amount of HNO3to1.5mL leads to the formation of a pure orthorhombic WO3ÁH2O(Fig.1b).The monoclinic phase of unhydrous WO3 (JCPDS43-1035)appears when2.5mL of HNO3is used and the relative peak intensity of this phase increases gradually by increasing the volume of HNO3until12.0mL(Fig.1c–f).When the amount of HNO3is further increased,however,no pure phase of monoclinic WO3is produced(Fig.1g and h).On the contrary,the relative intensity of the diffraction peaks of the monoclinic WO3 becomes lower,but that of the WO3ÁH2O phase becomes higher again.When the volume of HNO3reaches20.0mL,the diffraction peaks of the monoclinic WO3phase become even faint.The morphology evolution of the products prepared at120 C using various amount of HNO3is demonstrated in Fig.2.It was observed that the product’s morphology changes greatly in the low volume region of HNO3.A nanoparticle and nanorod mixture was collected when0.5mL of HNO3was used in the reaction system. Slightly increasing the volume of HNO3to1.5mL would lead to the formation of a bigflower-like hierarchical structure which is composed of many crossed and lapped quasi-round nanoplates with rough surfaces.The accumulated quasi-round nanoplates start dispersal and the surfaces become smooth when the volume of HNO3is increased to2.5mL.Most of the nanoplates are about 600nm in diameter and25nm in thickness.If5.0mL of HNO3is used,square-like nanoplates with a side length of around200nm and thickness of30–40nm are obtained.The surfaces of these nanoplates are rather smooth.When the volume of HNO3is in the range of 5.0–12.0mL,the products’morphologies are similar, unless the size of the nanoplate gradually becomes smaller with increasing the acid quantity.Some square-like nanoplates become a bit irregular and their surface roughness also increases if the amount of HNO3reaches15.0mL.Further increasing the amount of HNO3to20.0mL,irregularly shaped nanoplates with rather rough surfaces were obtained.This morphology is similar to that of the product in Fig.2c,unless the size is much smaller.One may notice that the phase composition of these two products(Fig.1c and h)is also similar.The other series of products were obtained at180 C,a higher hydrothermal temperature.The corresponding XRD patterns are shown in Fig.3.Orthorhombic WO3ÁH2O(JCPDS43–0679)was produced using0.5mL of HNO3.Increasing the amount of HNO3to 1.5mL leads to the formation of a mixture with most orthorhombic WO3ÁH2O and a little monoclinic WO3(JCPDS43–1035).The phase compositions of the products change dramatically withslightlyFig. 1.XRD patterns of the products prepared by hydrothermal method at120 C using various amount of HNO3:(a)0.5mL,(b)1.5mL,(c)2.5mL,(d)5.0mL,(e) 10.0mL,(f)12.0mL,(g)15.0mL and(h)20.0mL.H.Zhang et al./Materials Research Bulletin57(2014)260–267261increasing the volume of HNO 3from 1.5mL to 2.0mL.Pure monoclinic WO 3is obtained in the presence of 2.0mL of HNO 3.With further increasing the amount of HNO 3,the crystal phases of the products do not change any more.But the intensity of the diffraction peaks increases firstly and then declines slightly.The peak intensity reaches maximum using 10mL of HNO 3,which indicates the highest crystallinity of the WO 3product obtained at this condition.Thus,10mL of HNO 3is a suitable amount to obtain a pure monoclinic WO 3with a high crystallinity.The morphology evolution of the products prepared at 180 C using various amount of HNO 3is demonstrated in Fig.4.When 0.5mL of HNO 3is used,a nanoparticle –nanorod mixture (Fig.4a)is obtained,similar to the morphology of the product prepared at 120 C (Fig.2a).However,in the case of 1.5mL HNO 3,the two products prepared at these two hydrothermal temperatures have completely different morphologies.As shown in Fig.4b,the product comprises many non-uniform big rectangular blocks andplates.Slightly increasing the HNO 3–2.0mL leads to formation of WO 3nanoplates with different size,and some nanoplates accumulate with their large surfaces.When 10.0mL or 15.0mL of HNO 3is used,the product is well-dispersed nanoplates with the large surfaces exposed (Fig.4d and e).The side length and thickness of an individual nanoplate are approximately 100nm and 40nm,respectively.Changing the amount of HNO 3in the range of 10–15mL does not in fluence the morphology of the products.But in case of 20.0mL HNO 3,the uniformity of the product decreases and the size of the nanoplate increases to certain extent,although its crystal phase is kept unchanged.Because both the uniformity and crystallinity of the sample prepared at 180 C using 10.0mL of HNO 3are high,its TEM and HRTEM images were taken.As shown in Fig.5a,the side length and thickness of the most WO 3nanoplates are around 100nm and 30–40nm,respectively,which is consistent with the SEM result.The clear 2D crystal lattice (Fig.5b)shows that theinterplanarFig. 2.SEM images of the products prepared by hydrothermal method at 120 C using various amount of HNO 3:(a)0.5mL,(b)1.5mL,(c)2.5mL,(d)5.0mL,(e)10.0mL,(f)12.0mL,(g)15.0mL and (h)20.0mL.262H.Zhang et al./Materials Research Bulletin 57(2014)260–267distances are 0.37and 0.38nm,corresponding to (020)and (002)crystal planes,respectively.The fast Fourier transform pattern (the inset)indicates its single crystalline nature.On the basis of above results we conclude that both hydrothermal temperature and the amount of HNO 3in fluence the crystal phase and morphology of the product.Fig.6shows a summary of these two effects.Similar to the result in our previous work [1],low temperature favours the formation of WO 3ÁH 2O andhigh temperature is propitious to production of anhydrous WO 3.Increasing temperature results in dehydration of WO 3ÁH 2O,forming pure WO 3phase,even using a small volume of HNO 3(for example,2.0mL HNO 3).However,at the low hydrothermal temperature,120 C,no pure phase of WO 3was obtained even if a large volume of HNO 3was used.In the region of small volume of HNO 3,the crystal phases and morphologies of the products are found more sensitive to the change in acid quantity and reaction temperature.For instance,when 1.5mL of HNO 3was used,a hierarchical flower-like hydrous WO 3was formed at 120 C,but a non-uniform rectangular block and plate-like hydrous and anhydrous WO 3mixture is the main product at 180 C.This may be attributed to different nucleation rate,diffusion rate of nanoparticles and dehydration rate at different temperatures.At high temperature,the formation rate of tungsten oxide nucleus is fast and the hydrous WO 3loses water quickly once beyond its decomposition temperature,which partially counteracts the in fluence of larger amount of water on the crystal phase of the product when small volume of HNO 3is used.Moreover,the diffusion rate of nanoparticles is low at low temperature,which contributes to the formation of a big architecture.But a high diffusion rate at high temperature helps to epitaxy along certain crystal face [44].Therefore,different morphological products were produced at two hydrothermal temperatures using 1.5mL of HNO 3.When large amount of HNO 3(for instance,10mL HNO 3)is used,however,it is different from the above case.The similar morphology of the two products obtained at the twotemperaturesFig. 3.XRD patterns of the products prepared by hydrothermal method at 180 C using various amount of HNO 3:(a)0.5mL,(b)1.5mL,(c)2.0mL,(d)10.0mL,(e)15.0mL and (f)20.0mL.Fig.4.SEM images of the products prepared by hydrothermal method at 180 C using various amount of HNO 3:(a)0.5mL,(b)1.5mL,(c)2.0mL,(d)10.0mL,(e)15.0mL and (f)20.0mL.H.Zhang et al./Materials Research Bulletin 57(2014)260–267263clearly shows that large amount of acid is bene ficial to the oriented growth of the tungsten oxides,forming nanoplates.This,on the one hand,may be related to the high degree of supersaturation of the solution,which will increase the nucleation rate and dehydration rate of H 2WO 4,and ultimately increase the reaction rate.On the other hand,the acidity of a reaction system in fluences surface energies of certain crystal facets [45],which may signi ficantly in fluence the oriented growth of a crystal,and consequently in fluence the morphology of the product.Thus,suitable amount of acid is a dominant factor to the formation of nanoplate-like morphology.However,the acidity effect on the crystal phase of the product is found weaker than that of temperature.The low nucleation rate at 120 C results in the larger size of the nanoplates (compared to the product prepared at 180 C),which accords with the crystallization principle.The low dehydration rate at the lower temperature leads to incomplete dehydration of the product,forming a mixed phase of product.Thus,a larger size of mixed phase of nanoplate was obtained at 120 C using 10mL of HNO 3.3.2.Formation mechanismBecause the product prepared at 180 C using 15.0mL of HNO 3shows the better gas-sensing property,its time-dependent crystal phase and morphology evolutions were investigated.It represents the effect of hydrothermal time on the crystal phase and morphology of a WO 3nanostructure.As shown in Fig.S1and S2in the supporting information (ESI),pure uniform orthorhombic WO 3ÁH 2O (JCPDS 43–0679)nanoplates were obtained at 1h,which were quickly transformed to WO 3nanoplates.A mixture of WO 3ÁH 2O and WO 3was collected at 1.5h and pure monoclinic WO 3(JCPDS 43-1035)nanoplates were produced at 2h.These results con firm that a hydrous WO 3was formed at the early stage of the reaction and prolonging hydrothermal time results in a quick dehydration of WO 3ÁH 2O.The corresponding chemical reactions contain:WO 2À4þ2H þ!WO 3ÁH 2O(1)WO 3ÁH 2O !WO 3þH 2O(2)This reaction process is similar to the work by Lee et al.[46,46],where the high concentrations of HNO 3(0.29–11.5mol L À1)were replaced by low concentrations of HCl (pH 2–6)and NaCl was used as a capping agent.However,WO 3nanorods were obtained in their work although a similar procedure was applied.Lee et al.believed that NaCl selectively adsorbed onto the crystal planes parallel to the c -axes of WO 3crystal nucleus to accelerate the preferential growth,resulting in the formation of 1D structure.In our case,no capping agent or directing agent was used.Besides,as shown in Fig.6,a large amount of acid is bene ficial to the oriented growth of nanoplate-like tungsten oxides.Except the external factors,the intrinsic crystal structure is also an essential factor for morphology control of the product.The orthorhombic H 2WO 4consists of layers of [WO 6]octahedra,which share their four equatorial oxygen atoms.Water molecules and oxygen atoms in the axial positions of the [WO 6]octahedra form hydrogen bonds with the neighboring layers [3],as shown in Fig.S3a in the ESI.The monoclinic WO 3possesses a distorted ReO 3structure,see Fig.S3b.The layers of [WO 6]octahedra in the orthorhombic H 2WO 4and the monoclinic WO 3are similar.The shared four equatorial oxygen atoms extend forming a 2D plane structure.At high temperature,the hydrogen bonds in the layers of [WO 5(OH 2)]octahedra of the H 2WO 4were replaced by W ÀÀO ÀÀW bonds forming a three-dimensional W ÀÀO ÀÀW lattice-work and losing the crystal waters.The similarity of the WO 6octahedral sheets in H 2WO 4and WO 3results in the formation of the nanoplate-like WO 3.3.3.Gas-sensing properties and mechanismAll gas-sensing measurements were operated at 300 C.Therefore,the samples were calcined at 450 C for 2h before the gas-sensing measurements to ensure their thermal stability.The XRD patterns of the calcined WO 3samples are shown in Fig.S4in the ESI.All diffraction peaks for all the samples can be indexedtoFig. 5.(a)TEM and (b)HRTEM images of the sample prepared at 180 C using 10.0mL of HNO 3(the inset is the fast Fourier transformpattern).Fig.6.Schematic representation of the formation of the WO 3nanostructures with various morphologies and crystal phases:(a)orthorhombic WO 3ÁH 2O,(b)a mixture of orthorhombic WO 3ÁH 2O and monoclinic WO 3and (c)monoclinic WO 3,prepared at two hydrothermal temperatures using various amount of HNO 3.264H.Zhang et al./Materials Research Bulletin 57(2014)260–267monoclinic WO3(JCPDS43-1035),which indicates that pureanhydrous WO3products were obtained after the heat treatment.The SEM images of the calcined WO3samples,Fig.S5in the ESI,demonstrate that the product morphologies before and after theheat treatment are similar,which verifies again that thecondensation from WO3ÁH2O to WO3is a topotactic conversion process.The synthetic conditions of the precursors,the morphol-ogies and Brunauer–Emmett–Teller(BET)surface areas of thecalcined WO3products are summarized in Table1.The gas-sensing properties of the series of WO3nanomaterialsarefirst evaluated by means of200ppm acetone gas(Fig.7a).Theresults show that the sensor based on the S3sample is moresensitive than the others.The response of the S2sensor is slightlylower than that of the S3sensor.The third sensitive sensor is basedon the P3sample.The high responses of the S2,S3and P3sensorsmay be attributed to their high BET surface areas,highcrystallinities and plate-like morphologies[38].The most sensitive three sensors based on the samples S2,S3and P3were then chosen to investigate the sensitivities in thepresence of various concentrations of acetone gases,from10ppmto400ppm.As shown in Fig.7b,the S3sensor always has thehigher response than the other two sensors to any concentration ofacetone gas.The responses for all the three sensors increasesignificantly with increasing the concentration of acetone gas.Forinstance,the response for the S3sensor increases from4.1to15.8with increasing the concentration of acetone from10ppm to400ppm.Fig.8a represents the dynamic responses of the S2,S3and P3sensors to acetone gases with various concentrations from10ppmto400ppm.Sharp rises and drops in voltage values were observedfor all concentrations of acetone gases when they were injectedand discharged,respectively.This indicates that the WO3nano-plate sensors have a wide range of acetone-detecting abilities andare of fast response and recovery speeds to acetone gases.Forexample,the response and recovery time of the S3sensor are7sand23s,respectively,for100ppm acetone gas(Fig.8b).The resultsalso show that the response increases with increasing theconcentration of acetone gas at the same operating conditions.The sensing selectivity of the S3sensor was explored bycomparing the responses of the S3sensor to acetone,ethanol,formaldehyde and ammonia gases with various concentrations.Asshown in Fig.9,the responses of the S3sensor to all the four gasesincrease gradually with increasing the concentrations of the gases.However,the order of magnitude of the responses to differentgases is quite different.It is less sensitive to ethanol and almostinsensitive to formaldehyde and ammonia,compared to acetone.Thus,the as-prepared WO3nanoplate(S3)displays a distinctsensing selectivity to acetone gas,which could be explained byconsidering its sensing mechanism.As an n-type semiconductor,the sensing mechanism of theWO3nanoplate could be explained using the classical electrondepletion theory[41,47,48].Oxygen molecules in airfirst physically adsorb on the surface of WO3semiconductor.The O2(ads)capturesan electron from WO3forming OÀ2(ads).At an elevated tempera-ture,the chemically adsorbed O2(ads)molecules can obtainenough energy to capture two electrons or OÀ2(ads)to capture one more electron forming OÀ(ads).Because the oxygen ionosorption depletes electrons in the conduction band,conductance of the WO3 sensor is decreased.When the WO3nanoplate sensor is exposed to the reducing gases,acetone,ethanol,formaldehyde and ammonia, the gases react with the OÀ(ads)on the surface of WO3.Referring to the references[49,50],the reactions could be expressed by the following Eqs.(3)–(6).CH2Oþ2OÀðadsÞ!CO2þH2Oþ2eÀ(3) C2H5OHþ6OÀðadsÞ!2CO2þ3H2Oþ6eÀ(4) CH3COCH3þ8OÀðadsÞ!3CO2þ3H2Oþ8eÀ(5) NH3þ5=2OÀðadsÞ!NOþ3=2H2Oþ5=2eÀ(6) The gas removes chemisorbed oxygen anions and releases electrons to the conduction band.This will decrease the amount of the surface OÀ(ads)and increase the concentration of electrons in the conduction band,which eventually increases the conductance of the WO3sensor.According to the Eqs.(3)–(5),more electrons are released with increasing carbon chain.Consequently,the response increases because of the increased conductance of the sensor. Therefore,the gas response of acetone is higher than those of ethanol and formaldehyde gases at the equivalent concentration.As it is known that WO3is an acid oxide and generally it shows relatively high response to ammonia[13,41,51,52],but this is not always the case.For instance,Yu et al.reported that the gas responses of the WO3nanorods are7.6,18and27.5for1mL of ammonia,ethanol and acetone,respectively[35].A similar result was also found by Li and his co-workers[53],where the gas responses of the WO3hollow-spheres are2.89,6.14and13.50for 500ppm of ammonia,ethanol and acetone gases,respectively. These works show that the responses of the WO3nanostructures to ammonia gases are low and much lower than those of ethanol and acetone gases at the equivalent condition,which is similar to our result.Wefind that the response of the as-prepared WO3nanoplate to the alkaline gas,NH3,is lower than those of ethanol and acetone gases although it is slightly higher than that of formaldehyde.One may notice that the four gas responses(Fig.9)of the WO3 nanoplate increase with increasing the quantity of the released electrons(Eqs.3–6).This further confirms the proposed sensing mechanism above.From this point of view,it is reasonable that the as-prepared WO3nanoplate shows a distinct sensing selectivity to acetone gas.The sensing performance of a material can be strongly affected by a few factors.The higher the BET surface area is,the higher the oxygen-adsorption quantity is,and the higher sensitivity the WO3 sensor has[54].High crystallinity is also beneficial to highTable1The synthetic conditions of the precursors and properties of the WO3products after calcination at450 C for2h.Samples T( C)HNO3(mL)[H+](mol LÀ1)Morphologies Surface areas(m2gÀ1)P1120 5.0 2.9Nanoplate17.6P212010.0 5.8Nanoplate24.2P312012.0 6.9Nanoplate28.7P412015.08.6Nanoplate25.3S1180 2.0 1.2Big block and plate12.2S218010.0 5.8Nanoplate23.9S318015.08.6Nanoplate40.1S418020.011.5Nanoplate19.4H.Zhang et al./Materials Research Bulletin57(2014)260–267265sensitivity of a WO 3sensor [38].Therefore,the S3sensor has the highest value of acetone response due to the largest BET surface area exposed to gas and good crystallinity.Besides,the plate-like morphology of the WO 3allows for rapid diffusion of acetone molecules,which results in a fast gas-sensing response.In a word,the WO 3nanoplate (S3)is very promising for fabrication of an acetone gas sensor because of its high sensitivity,distinct selectivity and fast response to acetone gas.4.ConclusionsSeries of tungsten oxide nanostructures with different crystal phases and morphologies have been synthesized at two temper-atures by a facile hydrothermal method using various amount of HNO 3,and the formation mechanism of the WO 3nanoplate was explored based on series of time-dependant control experiments.The results show that the tungstate first reacts with hydrion forming hydrous WO 3,followed by a dehydration rge amount of acid,high temperature and long reaction time are found generally bene ficial to the formation of anhydrous WO 3nano-plates.It is worth mentioning that large amount of acid is found helpful to the oriented growth of the tungsten oxides,forming a nanoplate-like product.But the effect of acid quantity on the crystal phase of a product is weaker than that of temperature.The low dehydration rate at the low temperature (120 C)leads to incompletely dehydration of the product,forming a WO 3ÁH 2O and WO 3mixed phase of nanoplate,even if a large amount of acid (10mL)is used.At the high hydrothermal temperature (180 C)the nucleation rate,diffusion rate of nanoparticles and dehydration rate are increased signi ficantly,resulting in the formation of pure monoclinic WO 3nanoplates,even if a small amount of acid (2mL)is used.The gas-sensing measurements show that the sensitivities of the sensors based on the S3,S2and P3samples are the top three in the presence of 200ppm acetone gas.The S3sensor shows a distinct selectivity and fast response to acetone gas,which implies that the WO 3nanoplate (S3)is a promising material for fabrication of an acetone gassensor.Fig.7.Response comparison of the sensors based on the samples (a)P1-P4and S1-S4in the presence of 200ppm acetone gas and (b)P3,S2and S3in the presence of various concentrations of acetonegases.Fig.8.(a)Dynamic response –recovery curves of the P3,S2and S3sensors for acetone gas detection and (b)response transients of the S3sensor to 100ppm acetone gas.R e s p o n s eConce ntration /pp mFig.9.Sensing selectivity of the S3sensor to four gases with variousconcentrations.266H.Zhang et al./Materials Research Bulletin 57(2014)260–267。
90Nb和91Nb的高自旋态结构
第28卷增刊2004年12月高能物理与核物理HIGH ENERGY PHYSICS AND NUCLEAR PHYSICSVol.28,Supp.Dec.,2004 90Nb和91Nb的高自旋态结构∗崔兴柱1,2竺礼华1;1)吴晓光1李广生1温书贤1王治民1贺创业1张振龙1,2孟锐1,2马瑞刚1骆鹏3郑勇3霍俊德2M.M.Ndontchueng41(中国原子能科学研究院北京102413)2(吉林大学物理学院长春130023)3(中国科学院兰州近代物理研究所兰州730000)4(Universit´e de Douala,Facult´e de Sciences,B.P.8580Cameroun)摘要用能量为80MeV的19F束通过反应76Ge(19F,xn)布居了90Nb和91Nb的高自旋态.通过在束测量分析90Nb和91Nb退激射线的符合级联关系,发现了新的属于90Nb和91Nb的跃迁,建立了90Nb和91Nb的高自旋态能级纲图.通过经验壳模型计算指定了部分能级的组态,并结合实验DCO比值和与相邻核素的系统比较,确认了新能级的自旋和宇称.关键词高自旋态在束伽马谱学能级纲图原子核壳模型组态1引言在幻数核附近,由于能态的角动量由核子的角动量耦合形成,没有转动的贡献,核子间的相互作用比较容易研究.中子数N∼50区的大量研究[1—4]表明,该核区的核素大多具有球形核结构,一些以88Sr作为核心的壳模型计算[5—10]与实验数据符合得很好. 90Nb的质子数和中子数分别为41和49,分别临近L–S耦合和j–j耦合的闭壳,接近球形核,而91Nb的质子和中子数分别为41和50,中子为闭壳结构.它们具有明显的壳层结构,高自旋态呈现较强的粒子性.在本工作中分别观察到了属于上述两个核的新的γ跃迁.用经验壳模型计算方法,根据邻近核的低能部分提取两体相互作用,计算出部分能级的能量,通过与实验能级能量的比较,确定了部分能级的组态.2实验和数据分析本实验采用76Ge(19F,xn)反应来布居90Nb和91Nb的高自旋态.19F束流是由中国原子能科学研究院的HI–13串列加速器提供的,束流能量为80MeV.靶由厚度为2.2mg/cm2的76Ge和10mg/cm2厚的铅衬组成.退激γ射线由15台HPGe-BGO反康谱仪测量(其中5台放置于与束流线为90◦的位置,4台放置于44.6◦,4台放置于135.4◦,其余2台分别放置于54.7◦和125.3◦)共记录了68×106个二重γ-γ符合事件.通过离线反演生成对称化的Eγ∼Eγ两维矩阵.采用Radware软件对该两维矩阵进行γ射线开窗分析,得到各γ射线之间的级联关系,得到的90Nb 和91Nb的部分纲图分别如图1,图2所示.由于本次实验采用了重离子束和较高的能量,C.A.Fields实验[11]中90Nb低能部分的γ射线未在本实验中观测到.为了确定新观测到的能级的自旋及宇称,还对实验数据进行了DCO(方向角关联)比值分析.首先建立了一个DCO二维Eγ-Eγ矩阵,即以位于与束流方向成90◦的探测器探测到的γ射线能量作为二维Eγ-Eγ矩阵的x轴,将其他角度探测器探测到的γ射线能量作为二维Eγ-Eγ矩阵的y轴.根据得到的DCO矩阵就可以提取各γ射线的DCO比值,经过与已知多级性的γ射线的DCO比值的比较,从而得到各条γ射线的多极性[7].DCO比值的定义为R DCO=Iγ1(θ)εγ1(θ)εγ2(90◦)/Iγ1(90◦)εγ1(90◦)εγ2(θ),(1)其中Iγ1(θ)为在二维Eγ-Eγ矩阵的y轴上用γ2射线开窗得到的γ1的计数,γ1(90◦)为在x轴上用γ2射*国家重点基础研究发展规划项目(TG2000077405)和国家自然科学基金(10175090,10105015,10375092)资助1)E-mail:zhulh@27—3028高能物理与核物理(HEP&NP)第28卷线开窗得到的γ1的计数,θ为除90◦外的角度,εγ(θ)为θ角度上所有探测器对γ射线的探测效率.图190Nb的能级纲图图291Nb的能级纲图表1是这次实验中观测到的部分γ射线的DCO比值,通过与已知多级性γ射线的比较即可以定出新得到γ射线的多极性.从表中可以看出,γ射线的DCO比值明显分为两组.DCO比值接近1.5的γ射线对应于∆I=2的跃迁,而DCO比值接近0.5的γ射线则对应于∆I=1的跃迁.表1本次实验部分γ射线的DCO数据E aγI bγR cDCOσλd JπiJπfE ei/keV 90Nb813.4100(10)0.50(0.09)M19+8+813.4 996.326.8(5.2)0.88(0.67)E19−9+1809.7 1067.552.1(7.2) 1.48(0.37)M211−9+1880.9 1249.98.9(3.7)0.78(0.37)M1(10+)9+2062.8 2062.856.3(7.5) 1.61(0.30)E2(10+)8+2062.8 607.18.1(2.8)0.72(0.43)M112−11−2488.0 1876.612.1(3.5) 1.97(1.60)E2(11+)(9+)2690 775.665.2(8.1) 1.35(0.51)E2(12+)(10+)2818.4 495.860.7(7.8)0.57(0.21)M1(13+)(12+)3316.3 626.3 6.3(2.5) 1.30(0.64)E2(13+)(11+)3316.3 676.6 4.5(2.1)0.22(0.16)M1(13+)(12+)3495.0 587.1 5.0(2.5)0.35(0.29)M1(13−)(12−)3075.1 597.58.5(2.9)0.66(0.35)M1(14−)(13−)3672.6 660.437.6(8.2)0.43(0.20)M1(15+)(13+)3976.7 446.412.8(4.2)0.56(0.53)M1(15+)(13+)4423.1 571.414.9(3.8)0.78(0.52)(E2)f(15+)(13+)4066.4 1694.67.0(2.6) 2.23(1.40)E2(17+)(15+)5761.0 384.0 5.3(2.3)0.35(0.25)M1(18+)(17+)6145.0 1904.2 3.3(1.8)0.49(0.31)M1(15−)(14−)5576.8 1774.4 6.6(2.6) 1.66(0.62)E2(17−)(15−)7351.2 743.2 2.1(1.4)0.71(0.44)M1(18−)(17−)8094.4 281.3g 1.1(1.0)8375.7 91Nb(假定2290keV相对强度为100)421.135.8(7.7)0.35(0.17)M1(27/2+)(25/2+)5452.5 1063.414.9(7.3)0.58(0.24)M1f(29/2+)(27/2+)6515.8 919.026.7(5.4)0.62(0.24)M1(31/2+)(29/2+)7434.9 1982.567.1(8.4)0.78(0.32)(E2)f(31/2+)(27/2+)7434.5 661.752.0(7.5)0.43(0.20)M1(33/2+)(31/2+)8095.6 1717.410.0(4.6)0.55(0.29)M1(23/2+)(21/2+)5182.0 904.3 5.7(2.3)0.40(0.15)M1(25/2+)(23/2+)6086.7 2076.215(4.0) 2.53(1.04)E2(21/2−)(21/2+)5541.4 730.110(3.3) 1.29(0.30)E2(25/2−)(21/2−)6271.5 645.39(3)0.48(0.16)M1(27/2−)(25/2−)6919.8 aγ−射线的能量误差约为0.5keV;bγ−射线相对强度;c由多极性为2的γ−射线开窗得到的R DCO值;d由R DCO得出的射线多极性;e衰变能级的能量;f多极性由进一步的系统比较确定; g峰很弱无法确定其多极性.由于DCO数据只能确定γ射线的跃迁多极性,不能指定跃迁是磁跃迁还是电跃迁.通过对邻近的核的能级纲图进行分析,并做系统性比较,推定90Nb 和91Nb中部分能级的自旋和宇称.而在Nillson单粒子能级图中,可以看到N=49的三个核的基态价核子都是位于g9/2轨道的一个质子和一个中子空穴,因此这3个核的能级结构非常相似,如图3所示.而N=50的同中子素具有位于g9/2轨道的一个质子,他们的能级结构也非常相似,如图4.但是,这些核的能级结构存在一些差别,这主要是由于它们的价质子所处的平均场和价核子的激发状态不完全相同.增刊崔兴柱等:90Nb和91Nb的高自旋态结构29图3N=49的临近90Nb的同中子素的纲图比较图4N=50的临近91Nb的同中子素的纲图比较3经验壳模型计算由于90Nb和91Nb的中子数分别为49和50,接近或等于N=50的满壳结构,所以可以用近球形的壳模型的经验公式来描述.选择90Zr作为核芯,通过研究核外价核子的组态,以及由附近核的低激发态提取的价核子间的相互作用以及价核子和声子间的相互作用,来研究90Nb和91Nb的能级结构[12,14].至于不选88Sr作为我们计算的核芯,是因为选90Zr计算比较简单,而计算结果表明其计算结果和实验数据符合很好.对90Nb的10+态能级,其能量可描述为E90Nb{[πg9/2⊗νg−19/2]8+⊗2+}10+=E91Nb[πg9/2⊗2+]11/2++E89Zr[νg−19/2⊗2+]13/2+−E90Zr2++∆(πg9/2⊗νg−19/2)8++S,(2)其中∆(πg9/2⊗νg−19/2)8+=E[πg9/2⊗νg−19/2]8+−(E91Nbπg9/2+E89Zrνg9/2)−S,(3)S=B(90Nb)+B(90Zr)−B(89Zr)−B(91Nb)为质量过剩项.用同样的方法我们可以得到其他的能态的结构.本次计算的部分结果分别列于表2和表3.同时,为了便于比较,我们将计算值也分别在图1,图2中绘出.表290Nb中部分能级壳模型计算值与观测值的比较JπE exp/keV configuration E calc/keV9−1808πg9/2⊗νp−11/2g−19/2s1/2190511−1880πg9/2⊗νp−11/2g−19/2d3/2213212−2487πg9/2⊗νp−11/2g−19/2d5/2252413−3074πp−11/2g29/2⊗νg−19/2305314−3671πf−15/2g29/2⊗νg−19/237709+813πg9/2⊗νg−19/283410+2063[πg9/2⊗νg]8+⊗2+208311+2689[πg9/2⊗νg−19/2]9+⊗2+285712+2818πg9/2⊗νg−29/2s1/2282613+3315πg9/2⊗νg−29/2s1/2333414+未观测πg9/2⊗νg−29/2d3/2363215+4067πg9/2⊗νg−29/2d5/2392317+5761πf−15/2p−11/2g39/2⊗νg−19/2512918+6145πf−15/2p−11/2g39/2⊗νg−19/25900表390Nb中部分能级壳模型计算值与观测值的比较JπE exp/keV configuration E calc/keV27/2+6916πp−11/2g29/2⊗νfg−19/2s1/22627421/2+3465πg9/2⊗νg−19/2d3/2349023/2+5182πg9/2⊗νg−19/2d5/2526725/2+5116πg9/2⊗νg−19/2g7/2503127/2+5452πp−11/2f−15/2g9/2g7/2d5/2553129/2+6515πf−15/2p−13/2g9/2g7/2d5/26382从表2中可以看出四准粒子态的大部分计算与实验得到的能级数据基本相符,但是基于六准粒子态计算的17+和18+两个能态已经偏离了实验数据很多,不过还可以描述大致的规律.这可能是由于组态混杂引起的,也可能是从相邻核中提取剩余相互作用时所选的组态不正确所致.通过上述计算,我们可以进一步确定各能级的自旋及宇称指定的正确性.4结论实验布居了90Nb和91Nb的高自旋态,得到了新的能级结构,实验结果和经验壳模型的计算符合得很好.表明了90Nb和91Nb具有较好的壳层结构,是一个近球形核.通过经验壳模型计算与实验能级的比较确定了一些90Nb和91Nb高自旋态的价核子组态.30高能物理与核物理(HEP&NP)第28卷本工作是在中国原子能科学研究院HI–13串列加速器上完成的,加速器运行组为实验提供稳定的高品质束流,许国基研究员提供了实验靶,在此表示感谢,同时作者还要感谢兰州近代物理研究所的张玉虎、柳敏良等人在经验壳模型计算方面给予的指导和帮助.参考文献(References)1Warburton E K,Olness J W,Lister C J.J.Phys.,1986, G12:10172Tulapurkar A A,Das P,Mishra S N.Phys.Rev.,1996, C54:29043Schubart R,Jungclaus A,Harder A.Nucl.Phys.,1995, A591:5154Ghugre S S,Patel S B,Bhowmik R K.Phys.Rev.,1995, C51:11365JI Xiang-Dong,Wildental B H.Phys.Rev.,1988,C37: 12566B Lomqvist J,Rydstr¨o m L.Phys.Scr.,1985,31:317Muto K,Shimano T,Horie H.Phys.Lett.,1984,135B:3498Stefanova E A,Danchev M,Schwenger R.Phys.Rev., 2002,C65:0343239Johnstone I P,Johnstone L D.Phys.Rev.,1997,C55: 122710Arnell S E,F oltescu D,Roth H A.Phys.Rev.,1994,C49: 5111Fields C A,De Boer F W N,Kraushaar J J.Nucl.Phys., 1981,A363:31112Piiparinen M,Atac A,Blomqvist J.Nucl.Phys.,1986, A605:19113LI Guang-Sheng,Chin.Phys.Lett.,1999,16(11):796 14Bayer S,Byrne A P,Dracoulis G D.Nucl.Phys.,2001, A694:3Study of High Spin States in90Nb and91Nb∗CUI Xing-Zhu1,2ZHU Li-Hua1;1)WU Xiao-Guang1LI Guang-Sheng1WEN Shu-Xian1WANG Zhi-Min1HE Chuang-Ye1ZHANG Zhen-Long1,2MENG Rui1,2MA Rui-Gang1LUO Peng3ZHENG Yong3HUO Jun-De2M.M.Ndontchueng41(China Institute of Atomic Energy,Beijing102413,China)2(Department of Physics,Jilin University,Changchun130023,China)3(Institute of Modern Physics,Chinese Academy of Sciences,Lanzhou730000,China)4(Universit´e de Douala,Facult´e de Sciences,B.P.8580Cameroun)Abstract The high spin states of90Nb and91Nb have been populated via reaction76Ge(19F,xn)atbeam energy of80MeV.The de-excitingγ-rays have been measured with in-beamγ-ray spectroscopymethod.Afterγ-γcoincidence analysis,the new level scheme of90Nb and91Nb was established.Basedon the semi-empirical shell model calculations,the configurations of the levels have been suggested,in addi-tion,the spins and parities of the new levels have been assigned according to the experimental DCO valuesand to the systematic comparison with the neighboring nuclei.Key words high spin state,in-beamγ-ray spectroscopy,level scheme,nuclear shell model,configu-ration*Supported by Major State Basic Research Development Program(TG2000077405)and National Natural Science Foundation of China(10175090,10105015,10375092)1)E-mail:zhulh@。
层状双金属氢氧化物
包装工程第44卷第19期·104·PACKAGING ENGINEERING2023年10月层状双金属氢氧化物/聚乙烯醇气体阻隔薄膜材料制备及性能研究张子怡,李梦冉,薛程,范婷婷,李欢欢,李中波*(安徽农业大学轻纺工程与艺术学院,安徽合肥230036)摘要:目的研发出一种具有优异氧气阻隔性能的柔性薄膜,其在食品包装领域具有良好的应用前景。
方法以具有生物降解性能的聚乙烯醇(PVA)为成膜基材,镁铝层状双金属氢氧化物(MgAl-LDH)为改性剂,柠檬酸为交联剂,采用流延法制备出具有优异气体阻隔性能的PVA/MgAl-LDH复合薄膜。
结果随着柠檬酸的含量的增加,复合薄膜的亲水性能逐渐增加,阻隔性能逐渐下降;随着复合薄膜中MgAl-LDH的含量的增加,复合薄膜的疏水性能和阻隔性能逐渐提高。
当复合薄膜中MgAl-LDH的质量分数为1.5%时,薄膜的力学性能最好,抗拉强度为42 MPa,断裂伸长率为16.7%,此MgAl-LDH质量分数下薄膜的气体阻隔性能也最优异,气体透过量为16 mL/(m2·24 h·0.1 MPa)。
结论柠檬酸的引入增加了薄膜内部亲水基团的数量,提升了复合薄膜的亲水性能。
MgAl-LDH可以减少PVA薄膜内部自由体积,提升PVA薄膜的力学性能和阻隔性能。
关键词:聚乙烯醇;镁铝层状双金属氢氧化物;柠檬酸;复合薄膜;阻隔性能中图分类号:TS206.4 文献标识码:A 文章编号:1001-3563(2023)19-0104-08DOI:10.19554/ki.1001-3563.2023.19.014Preparation and Properties of PVA/MgAl-LDH Gas Barrier FilmsZHANG Zi-yi, LI Meng-ran, XUE Cheng, FAN Ting-ting, LI Huan-huan, LI Zhong-bo*(College of Light Textile Engineering and Art, Anhui Agricultural University, Hefei 230036, China)ABSTRACT: The work aims to develop a flexible film with excellent oxygen barrier performance and good application prospects in the field of food packaging. The PVA/MgAl-LDH composite film with excellent gas barrier performance was prepared by the casting method with biodegradable polyvinyl alcohol (PVA) as the film-forming substrate, mag-nesium-aluminum layered bimetallic hydroxide (MgAl-LDH) as the modifier, and citric acid as the cross-linking agent.The experimental results showed that with the increase of citric acid content, the hydrophilic property of the composite film gradually increased and the barrier performance decreased gradually. With the increase of MgAl-LDH content in the composite film, the hydrophobic property and barrier property of the composite film gradually increased. When the content of MgAl-LDH in the composite film was 1.5%, the mechanical properties of the film were the best, with a ten-sile strength of 42 MPa and an elongation at break of 16.7%. The gas barrier performance of the film with this MgAl-LDH content was also the best, with a gas permeability of 16 mL/(m2·24 h·0.1 MPa). In addition, the introduc-tion of citric acid increases the number of hydrophilic groups inside the film, and the hydrophilic properties of the composite film are enhanced. MgAl-LDH can reduce the free volume inside the PVA film and enhance the mechanical收稿日期:2023-04-27基金项目:安徽省教育厅自然科学重点项目(2022AH050875);安徽省科技重大专项(202103a06020005);安徽省大学生创新创业项目(S202120364214)第44卷第19期张子怡,等:层状双金属氢氧化物/聚乙烯醇气体阻隔薄膜材料制备及性能研究·105·and barrier properties of the PVA film.KEY WORDS: polyvinyl alcohol; magnesium-aluminum layered bimetallic hydroxide; citric acid; composite film; bar-rier performance阻隔性薄膜指对气体、有机化合物等低分子量的化学物质具有非常低的透过性的薄膜。
高温蠕变1
Viewpoint PaperHigh-temperature deformation and creep in Mg wrought alloysStefano Spigarelli *and Mohamad El MehtediDipartimento di Meccanica,Universita`Politecnica delle Marche,via Brecce bianche,60131Ancona,Italy Received 4November 2009;revised 14December 2009;accepted 17December 2009Available online 23December 2009Abstract—The high-temperature deformation data obtained for a number of different Mg alloys by torsion and tension creep are discussed.ZM21alloy exhibited peak flow stresses comparable to that observed in AZ31,and the equivalent strain to fracture in torsion for the two alloys was similar.In the cases of ZEK200and ZM21,creep was found to obey the same constitutive equations as hot working,suggesting a continuity of mechanical parameters and substructure in the two regimes.Ó2009Acta Materialia Inc.Published by Elsevier Ltd.All rights reserved.Keywords:Magnesium alloys;High-temperature deformation;Creep test1.IntroductionInterpretation of the high-temperature deformation of magnesium alloys has been the subject of much atten-tion in recent years,due to the attractive properties of these materials.In particular,the present authors have studied at length the effect of the initial state on the hot workability of AZ31alloy [1–3];in the same context,other research has aimed at investigating the hot work-ability of materials of the Mg–Zn group [3–7].In addi-tion,the creep properties of Mg–Zn wrought alloys have been analysed in some detail in recent papers [7–9].Although a range of data has been discussed in some detail in the papers cited above,a comprehensive comparative analysis of the behaviour of these alloys is still lacking.The aim of the present study is thus to present and discuss the torsion and creep data obtained by the authors,in order to obtain new significant infor-mation that could be useful for the processing and/or applications of these alloys.2.Materials and methodsThe materials considered in this study are summa-rized in Table 1.Three different batches of AZ31were tested in torsion.The first batch was produced by ingot technology,and underwent different pre-treatments,identified by the suffixes I1H,E1,E1H and E1HSC;asecond batch was produced by direct chill casting (DCC)and was tested in the as-cast condition (I2);the third batch was die cast (DC)and rolled (R1).The other Zn-containing Mg alloys considered here included DCC ZM21tested in two different initial states (I1,E1),DCC ZK60,DCC ZEK200(Mg–1.52%Zn–0.27%Nd,0.19%Y–0.38%Zr)tested after extrusion,and,last but not least,an alloy identified here as AMZ110Ca (0.75%Al–0.79%Mn–0.55%Zn–0.17%Ca),again produced by DCC and then extruded.The hot workability of these materials was tested in torsion;the relationships used to convert the raw data obtained in torsion to equivalent stress and equivalent strain may be obtained from each of the studies mentioned in Table 1.Constant-load creep tests were carried out between 100and 125°C on the ZM21-E1[8],ZEK200-E1[9]and AMZ110+Ca-E1[7]alloys;details on the experi-mental techniques for creep testing are given in Refs.[8,9].2.1.Elevated temperature deformation:hot workability As pointed out by McQueen and Ryan in their com-prehensive study of the constitutive analysis of hot working [10],the constitutive equations relating stress and testing parameters are used to calculate the process-ing forces at given strain rate;in addition,the extensive use of finite-element modelling (FEM)is still largely based on the input of these relationships correlating peak flow stress,temperature and strain rates.The most widely used constitutive equation is:1359-6462/$-see front matter Ó2009Acta Materialia Inc.Published by Elsevier Ltd.All rights reserved.doi:10.1016/j.scriptamat.2009.12.034*Corresponding author.E-mail:s.spigarelli@univpm.itScripta Materialia 63(2010)704–709/locate/scriptamatanisms operating during deformation,in practice this parameter is strongly sensitive to the scatter of the experimental data.In the case of the AZ31,the Q HW cal-culated values range from135kJ molÀ1(a value equiva-lent to that of self-diffusion in Mg),to224kJ molÀ1, even though the majority of the data is reasonably close to150–160kJ molÀ1.An average value of Q HW=164 kJ molÀ1was used to plot Z as a function of peakflow stress in Figure1.Analysis of thisfigure clearly shows that almost all the data collapse on a relatively narrow scatter band,delimitated by the two curves(broken lines),that,for a given strain rate,identify a lower (Eq.(1)with n=5,a=0.028MPaÀ1and A=1Â1011sÀ1)and a higher(Eq.(1)with n=5,a=0.018 MPaÀ1and A=2Â1011sÀ1)limit of the peak stress. Most of the experimental data align on the same master curve(solid line)described by Eq.(1)with n=5, a=0.019MPaÀ1and A=3Â1011sÀ1.Figure1also shows that the extruded alloy data overlap on the master curve in the high-Z regime;as temperature increases and/or strain rate decreases,i.e.Z decreases,the data for the extruded alloy gradually drift toward the lower limit of r.A possible explanation for this behaviour lies in the lower grain size of extruded alloys.Dynamic recrystallization(DRX),in AZ31as in many other Mg alloys,involves the creation of new grains,frequently nucleating at previous grain boundaries(Table2),fol-lowing a scheme that has been analysed by McQueen and Konopleva[11]:twinning takes place at low strains to reorient grains not suited for slip,preceding the other mechanisms except basal glide that occurs in favourably oriented grains.As strain reaches a critical level,DRX starts where high misorientations have been created by accumulation of dislocations,i.e.in those points(near grain boundaries and twins)where slip has occurred on several slip systems.The newfine grains form a“neck-lace”along grain boundaries and deform more easily than the grain core,thus repeatedly undergoing recrystalliza-tion.Thesefine grains can coarsen when testing tempera-ture is very high,but impingements of recrystallized necklace grains on the opposite side of the original de-formed grain could occur only when the initial structure wasfine-grained;in this case the necklace grainsfill the volume microstructure so that afine equiaxed DRX struc-ture results[12].On the other hand,a coarse initial grain size[11]should lead to only partially recrystallized micro-structures,and,since DRX swept out dislocations and is expected to reduceflow stress,to higher working loads.Table1.Summary of the hot-workability parameters for the alloys considered in this study.For the less-common alloys the chemical composition is also given(wt.%).Material Condition Ref.a[MPaÀ1]n Q HW[kJ molÀ1] AZ31-I1H a Ingot+heat treated(500°C/2h quench)[1]0.020 5.5224AZ31-E1a Ingot+extruded[2]0.020 3.9152AZ31-E1H a Ingot+extruded+heat treated(500°C/2h quench)[2]0.020 4.2157AZ31-E1HSC a Ingot+extruded+heat treated(500°C/2h slow cooling)[1]0.020 3.6135AZ31-I2Direct chill cast(DCC)[1]0.020 4.7150AZ31-R1Die cast–rolled[3]0.020 4.2168AMZ110Ca-E1b DCC–extruded[7]0.010 6.2201ZM21-I1DCC[4]0.024 4.7173ZM21-E1DCC–extruded[3]0.049 3.3201 cS.Spigarelli,M.El Mehtedi/Scripta Materialia63(2010)704–709705Figure 2shows the Z parameter as a function of the peak flow stress for the other wrought Mg–Zn alloys con-sidered in the present study and for an additional sand-cast ZM21alloy (ZM21-I2),tested by Sivakesavam and Prasad [13]in compression.The experimental values of the activation energy range from 173to 201kJ mol À1(only ZK60exhibits a lower Q HW value:115kJ mol À1;see Table 2),but to make comparison easier,the value of 164kJ mol À1was used in Figure 2.Figure 2a plotsregime (corresponding to temperatures of 450and 500°C,i.e.well above the maximum testing temperature usually used for Al-containing Mg alloys).The similitude in strength between AZ31and ZM21suggests that a mere 1%Zn and 0.8%Mn (the AZ31in general contains 0.2%Mn)are equivalent,in terms of strengthening effect,to 3%Al;this observation thus seems to confirm that Zn acts as solid solution strengthener,as already postulated in other studies (see,for a discussion on this subject,the references Table 2.Details on the microstructure before and after high-temperature deformation for some of the alloys investigated.Material Notes on the initial microstructure Notes on the final microstructure (after rupture)AZ31-E1EQM;GS =5l m0.05s À1:early onset of necklace recrystallization at 200°C(around 30%of recrystallized structure);FR structure at 250–400°C,presence of extensive twinning inside grains,and moderate grain coarsening at400°C;onset of DRX is retarded by increasing strain rate (no DRX at 5s À1,200°C)AZ31-E1H EQM;GS =12l m0.05s À1:twins on severely deformed grains at 200and 250°C;partly (40–50%)recrystallized structure (necklace DRX)at 300°C.FR structure at 350–400°C.Twinning observed inside recrystallized grains.Moderate grain coarsening at 400°C AMZ110Ca-E1AEQM;GS =3l m0.5s À1:severely deformed microstructure at 200°C;few recrystallized grains on grain boundaries of deformed grains at 250°C;AFR structure at 350°C;FR structure at 400°CZM21-I1EQM;GS =20l m 0.5s À1:severely deformed microstructure between 200and 300°C;bimodal distribution of large and fine grains produced by recrystallization at 350°C and aboveZM21-E1AEQM;GS =40l m 0.5–5s À1:severely deformed grains below 300°C;AFR grain structure at 400°C.FR structure and large grain growth at 500°CZEK200-E1EQM;GS =11l m0.5–5s À1:severely deformed grains below 300°C;early onset of recrystallization on grain boundaries at 350°C.AFR grain structure at 400°C.FR structure and moderate grain growth at 450°CEQM,equiaxed microstructure;AEQM,almost completely equiaxed microstructure;FR,fully recrystallized;AFR,almost fully recrystallized;GS,grain size;DRX,dynamic recrystallization.706S.Spigarelli,M.El Mehtedi /Scripta Materialia 63(2010)704–709precipitates.Figure 2b plots the data obtained by testing ZK60and ZEK200;the large scatter of the ZK60data points was expected,due to the large difference between the experimental value of the activation energy and the value used in Figure 2.The relatively high strength of ZEK200was also expected,due to its alloying with rare-earth (RE)elements;again,as in ZM21,extensive DRX was observed only in the very-high-temperature regime.The above analysis gives some interesting indications that could be used to predict the processability,in terms of working loads,of the set of investigated alloys.How-ever,Figures 1and 2do not give any information about the ductility,i.e.the maximum strain that could be accu-mulated at high temperature without cracking.Torsion testing,due to the pure shear condition,in itself cannot give quantitative information on this subject,except the equivalent strain to fracture.This parameter,obtained in all the investigated alloys by a common testing proce-dure,could nevertheless be used as a comparative index to analyse the ability of the different materials to deform without defects.Figure 3plots the equivalent strain to fracture as a function of Z for the AZ31(Fig.3a)and the Zn-containing alloys (Fig.3b).Analysis of Figure 3a clearly indicates that for AZ31,while in the case of peak stress values the differences in initial microstructure have a relatively minor effect,the same is not true for the strain to fracture;as a mattersidered,the strain to fracture was found to increase from ZEK200to ZK60.The relatively low values of the equivalent strain to fracture observed in ZEK200can be associated with the presence of RE elements forming RE-rich particles.Furthermore,the drop in strain to fracture at low-Z values in AMZ110+Ca (the four data points well below the band of the other experimental data)can easily be explained by the use of an excessively high testing temperature (450°C,equivalent to the eutectic temperature in Mg–Al binary system).2.2.Elevated temperature deformation:creep regime Figure 4plots the minimum creep rate values for the Zn-containing wrought alloys that have been tested by the authors of the present study between 100and 150°C [7–9];for all these materials,the value of the acti-vation energy for creep was found to be close to 180kJ mol À1,i.e.reasonably close the Q HW values re-ported in Table 1.This value was thus used to plot the Zener–Hollomon parameter as a function of applied stress.Figure 4also shows the straight lines representing the power-law equation:Z ¼_eexp ðQ =RT Þ¼A 0r n ð2Þconventionally used to described the minimum strain rate dependence on applied stress in creep (where A 0is a material parameter,Q is the activation energy for creep,and n is the creep exponent),for two cast alloys,AS21[14]and AE44[15].These two alloys were here considered as reference standards for commercial die-cast materials with acceptable (AS21)and excellent (AE44)creep response.In both cases their enhanced creep strength,when compared with the classical AZ91,is based on the presence of stable precipitates (Mg 2Si in AS21and RE-rich particles in AE44).The values of the stress exponent describing the data in Figure 4were 12.7,14.8and 18.9for AMZ1100+Ca,Figure 3.Equivalent strain to fracture in torsion as a function of Z ,for (a)AZ31and (b)the other Zn-containing alloys.S.Spigarelli,M.El Mehtedi /Scripta Materialia 63(2010)704–709707Even more remarkable is the equivalence of the creep response of the ZEK200and AMZ110+Ca;only at the highest temperature (150°C)does the RE-contain-ing alloy exhibit lower creep rates than the material con-taining 0.17%Ca.The increase in creep resistance when compared to ZM21is also in this case attributable to the presence of precipitates,i.e.Ca-and RE-rich particles,respectively.An interesting point to be considered is the contiguity and overlap of creep and hot-working data.In a recent paper,McQueen and Kassner [16]emphasized that in the traditional approach,different paradigms govern creep and hot workability.While creep studies aim at increasing the resistance to flow and reducing the accu-mulated strain,hot-working researches go for the oppo-site target;nevertheless,the continuity of steady-state parameters and structures between creep and hot-work-ing regimes has been confirmed in the case of Al [16].The situation should be significantly different in Mg,since above 225°C non-basal slip is theoretically ex-pected to act as rate-controlling mechanism [17],and hot-working studies are usually carried above this limit;in the case of the alloys considered here,for example,torsion testing was usually carried out between 200and 500°C,while the maximum testing temperature in creep was 150°C.In addition,the extended ductility in torsion leads to the onset of DRX,a mechanism never observed in creep.Therefore one might wonder whether creep and torsion data differ in their Z –r relations;the problem is addressed in Figure 5,where torsion and creep data were plotted for those alloys for which both sets were available.Analysis of Figure 5proves that the tensile creep and torsional data obtained by testing3.ConclusionsThe analysis of the torsion and creep data obtained by testing the wrought alloys considered in the present study led to the following conclusions:1.The effect of a different initial microstructure on the hot-working response of AZ31alloy mainly consists in a significant variation of the maximum attainable strain (equivalent strain to fracture in torsion);a fine grain size—obtained,for example,by extrusion—reduces the working loads and leads to an increase in the hot workability.2.The Mg–Zn alloys can be successfully deformed at higher temperatures when compared with Mg alloys containing Al and,in general,the working loads do not dramatically differ from those necessary for AZ31in the same temperature and strain rate range.The equivalent strain to fracture in torsion is slightly higher for ZM21than for AMZ110;ZEK200,as expected due to the presence of a RE addition,is the least ductile alloy investigated here.3.Necklace DRX is the typical recrystallization mecha-nism operating in all the investigated alloys;the lower temperature limit for the onset of DRX was found to vary with the presence of Al (which seems to extend DRX to lower temperatures).In addition,the initial grain size could significantly affect the DRX phenom-ena,since a fine initial grain size,for example,pre-vents the presence of unrecrystallized regions in the final structure.4.The creep response of wrought Mg alloys containing Zn is more than acceptable;ZM21is only marginally inferior to the AS21reference material,while 708S.Spigarelli,M.El Mehtedi /Scripta Materialia 63(2010)704–709References[1]M.El Mehtedi,S.Spigarelli,E.Evangelista,G.Rosen,Int.J.Mater.Res.100(2009)447–451.[2]S.Spigarelli,M.El Mehtedi,M.Cabibbo,E.Evangelista,J.Kaneko,A.Jager,V.Gartnerova,Mater.Sci.Eng.A 462(2007)197–201.[3]M.El Mehtedi,L.Balloni,S.Spigarelli,E.Evangelista,G.Rosen,B.H.Lee,C.S.Lee,Metall.Sci.Technol.25(2007)23–30.[4]M.El Mehtedi,L.Balloni,S.Spigarelli,E.Evangelista,G.Rosen,Key Eng.Mater.367(2008)79–86.[5]G.Harel,M.El Mehtedi,S.Spigarelli,M.S.Bamberger,E.Evangelista,S.Sereni,G.Rosen,in:M.O.Pekguleryuz,N.R.Neelameggham,R.S.Beals, E.A.Nyberg(Eds.), Magnesium Technology2008,TMS,Warrendale,PA, 2008,p.141.[6]S.Spigarelli,M.El Mehtedi,P.Ricci,Mater.Sci.Forum604–605(2009)212–222.[7]S.Spigarelli,M.El Mehtedi,D.Ciccarelli,M.Bamberger,G.Cupito`,Y.Rami,Mater.Sci.Forum638–642(2010)1482–1487.[8]M.El Mehtedi,S.Spigarelli,E.Evangelista,G.Rosen,Mater.Sci.Eng.A510–511(2009)403–406.[9]S.Spigarelli,M.El Mehtedi,Mater.Sci.Eng.A527(2009)126–131.[10]H.J.McQuen,N.D.Ryan,Mater.Sci.Eng.A322(2002)43–63.[11]H.J.McQueen, E.V.Konopleva,in:J.Hryn(Ed.),Magnesium Technology2001,TMS,Warrendale,PA, 2001,p.227.[12]M.R.Barnett,Mater.Trans.44(2003)571.[13]O.Sivakesavam,Y.V.R.K.Prasad,Mater.Sci.Eng.A362(2003)118–124.[14]E.Evangelista,S.Spigarelli,E.Gariboldi,E.Cerri,O.Lohne,K.Pettersen,Mater.Sci.Forum419–422(2003) 433.[15]S.Spigarelli,Mater.Sci.Forum604–605(2009)357–365.[16]H.J.McQueen,M.E.Kassner,Mater.Sci.Eng.A410–411(2005)58–61.[17]S.S.Vagarali,ngdon,Acta Metall.29(1981)1969–1982.S.Spigarelli,M.El Mehtedi/Scripta Materialia63(2010)704–709709。
钛合金tc11动态拉伸力学行为的实验研究
钛合金TC11动态拉伸力学行为的实验研究张 军, 汪 洋(中国科学技术大学近代力学系 中科院材料力学行为和设计重点实验室 安徽合肥 230027)摘要:利用MTS809材料试验机和旋转盘式间接杆杆型冲击拉伸实验装置,对双态组织两相钛合金TC11进行了应变率为0.001 s-1的准静态和190s-1的动态单向拉伸实验,获得了TC11等温和绝热拉伸应力-应变曲线;实施了应变率为190s-1的冲击拉伸复元实验,获得了TC11在高应变率下的等温应力-应变曲线。
试验结果表明,TC11的拉伸力学行为具有明显的应变硬化效应、应变率强化效应和绝热温升软化效应。
采用修正的Johnson-Cook模型较好地表征了TC11在试验应变率范围内的拉伸力学行为。
关键词:两相钛合金;动态拉伸;绝热温升软化;复元试验EXPERIMENTAL INVESTIGATION ON THE DYNAMIC TENSION BEHA VIOR OFTITANIUM ALLOY TC11Jun Zhang, Yang Wang(Department of Modern Mechanics, CAS Key Laboratory of Mechanical Behavior and Design of Materials, University of Science and Technology of China, Hefei, Anhui 230027, PR China)Abstract:Quasi-static and dynamic uniaxial tension tests for a titanium alloy TC11 with a duplex microstructure were performed using MTS809 testing system and rotating disk bar-bar tensile impact apparatus, respectively. The isothermal stress-strain curve at 0.001s-1 and the adiabatic stress-strain curve at 190s-1 were obtained. The dynamic tensile recovery test was carried out at the rate of 190s-1 and the isothermal stress-strain curve at the high strain rate was obtained. The experimental results indicate that there exists the strain hardening, strain-rate strengthening and adiabatic temperature-rise softening phenomenon in the tension behavior of TC11. A modified Johnson-Cook model was chosen to describe the tensile behavior of TC11 at different strain rates. The model results agree well with the experimental data.Keywords: Two phase titanium; Dynamic tension; Thermal softening; Recovery test0. 引言两相钛合金具有比强度高、高低温性能优异、耐腐蚀等优点,是航空、航天工程中广泛使用的结构材料。
- 1、下载文档前请自行甄别文档内容的完整性,平台不提供额外的编辑、内容补充、找答案等附加服务。
- 2、"仅部分预览"的文档,不可在线预览部分如存在完整性等问题,可反馈申请退款(可完整预览的文档不适用该条件!)。
- 3、如文档侵犯您的权益,请联系客服反馈,我们会尽快为您处理(人工客服工作时间:9:00-18:30)。
Strain path dependence of {10À12}twinning activityin a polycrystalline magnesium alloySeong-Gu Hong,a ,⇑Sung Hyuk Park b and Chong Soo Lee b ,⇑aDivision of Industrial Metrology,Korea Research Institute of Standards and Science,Daejeon 305-340,Republic of Korea bDepartment of Materials Science and Engineering,Pohang University of Science and Technology,Pohang 790-784,Republic of KoreaReceived 24August 2010;revised 17September 2010;accepted 20September 2010Available online 25September 2010The {10À12}twinning activity in plastic deformation of a polycrystalline magnesium alloy was investigated using the in situ electron backscatter diffraction technique in combination with Schmid factor analysis.The activation of different twin variants depending on the strain path introduced a significant difference in the intersection characteristics between twin bands,causing a totally different twinning contribution to the deformation.The intersection between different twin variant pairs was found to retard the twin growth and promote the nucleation of new twins.Ó2010Acta Materialia Inc.Published by Elsevier Ltd.All rights reserved.Keywords:Magnesium alloy;{10À12}twinning;Twin variant;Schmid factorDeformation twinning is an important mecha-nism for plastic deformation of wrought magnesium (Mg)alloys because the specific texture,developed dur-ing manufacturing process,makes the operation of slip systems difficult [1–7].Although several types of defor-mation twins have been reported for Mg alloys [1–7],the {10À12}twin is recognized to occur most easily and frequently,and accommodates most early plastic deformation,causing a low flow stress and strain hard-ening rate [4,7].The {10À12}twinning is generally known to occur under two strain paths (i.e.loading con-ditions):tension parallel to the c -axis of the hexagonal close-packed lattice or compression perpendicular to the c -axis [8].Recently,Hong et al.[6,7]reported that different twin variants are active depending on the strain path (their selection mechanism is governed by the Schmid law),and this influences the twinning activity in the deformation,causing a strain path dependence of flow stress and strain hardening behaviors.As the twin nucleation was governed by the Schmid law,the strain path dependence of the material yield (i.e.yield strength),which is dominated by twin nucleation,was explained successfully.It is noted,however,that the twinning activity under further deformation beyondyielding was quite different from what we was expected:(i)although a greater value of the highest Schmid factor (SF)can be achieved for the strain path of tension par-allel to the c -axis,the twinned volume fraction at a given strain was much larger for the strain path of compres-sion perpendicular to the c -axis,inducing a more signif-icant twinning contribution to the deformation;and (ii)when considering that twin growth occurs under lower stresses than those required for twin nucleation [9],the twinning process after yielding would be dominated by a twin growth mechanism.This was true for the strain path of compression perpendicular to the c -axis.For the strain path of tension parallel to the c -axis,however,twin nucleation continued to occur up to $5%,indicat-ing that there was another control factor for twin growth and it was closely related to the strain path.In this study,therefore,we explored why the {10À12}twinning activity exhibits a strain path dependence and what the control factor for twin growth is.For this purpose,quasi-static tensile and compressive tests com-bined with the in situ electron backscatter diffraction (EBSD)technique were performed on rolled Mg alloy and SF analysis was used to interpret the results.A commercial hot-rolled AZ31Mg alloy (Mg–3.6%Al–1.0%Zn–0.5%Mn)plate,50mm thick,which was homogenized at 400°C for 4h,was used.The material had a twin-free equiaxial grain structure,with an aver-age linear intercept grain size of $30l m.The initial1359-6462/$-see front matter Ó2010Acta Materialia Inc.Published by Elsevier Ltd.All rights reserved.doi:10.1016/j.scriptamat.2010.09.030⇑Corresponding authors.Tel.:+82428685868;fax:+82428685032(S.-G.Hong),tel.:+82542792141;fax:+82542792399(C.S.Lee);e-mail addresses:sghong@kriss.re.kr ;cslee@postech.ac.krScripta Materialia 64(2011)145–148/locate/scriptamattexture of the material,measured by EBSD,exhibited an intense basal texture,with a randomly oriented a-axis in the rolling plane.Tensile and compressive specimens were machined from the homogenized plate along the normal direction (ND)to the rolling plane and rolling direction(RD), respectively:the gage sections of the tensile and compres-sive specimens were10mmÂ4mmÂ2mm(lengthÂwidthÂthickness)and10mmÂ4mmÂ4mm,respec-tively.Note that the tension along the ND(T-ND)and the compression along the RD(C-RD)correspond to the strain paths of tension parallel to the c-axis and compression perpendicular to the c-axis,respectively. For EBSD examination,the specimen surface was ground on2400grit silicon carbide papers and polished using 1l m diamond paste,followed by afinal polish with colloidal silica to remove any strains and provide a high-quality surfacefinish.The specimen was loaded to the stress level required using an INSTRON8801testing machine at room tem-perature and a strain rate of10À3sÀ1,then unloaded. The unloaded specimen was then examined with EBSD installed in afield emission scanning electron micro-scope.By repeating this process at four different stress levels,in situ EBSD observation on tensile and compres-sive tests became possible.For the EBSD experiment, automated EBSD scans were performed in the stage control mode with TSL data acquisition software on an area of0.12mm2with a step size of0.3l m.Analysis of the EBSD data was accomplished with TSL OIM analysis software and the data with a confidence index of>0.1were used for twin variant analysis.Because of the intense basal texture,the crystallo-graphic lattice of the material is hardly oriented for both basal and prismatic slips for T-ND.For C-RD,basal slip is also hard to operate but prismatic slip is highly preferred[3,7,10];the minimum stress required for acti-vating prismatic slip is calculated to be110MPa(an an-gle h of0°between the a-axis and the loading axis,and a critical resolved shear stress(CRSS)of55MPa[1,3]).As shown in Figure1a,however,the experimental results show that the material yielded at$66MPa for C-RD and$58MPa for T-ND.This clearly indicates that the material yield is not dominated by dislocation slips.Figure2shows the strain path dependence of the highest SF value that can be achievable for six{10À12} twin variants;in the analysis,the material was assumed to have a perfect basal texture with a randomly oriented a-axis in the RD–TD plane(where TD is the transverse direction)[6].For T-ND,all six twin variants had an equal SF value of0.499irrespective of the angle h.For C-RD, however,only the twin variant pair adjacent to the loadingaxis had the highest SF value,which increases from0.374to0.499as the angle h increases from0to30°;note that two twin variant pairs had the highest SF value of0.374for h=0°.If the{10À12}twinning controls the materialyield,the above SF analysis results predict yield strengths of60and69MPa for T-ND and C-RD,respectively;aCRSS of30MPa was assumed for{10À12}twinning[1,3]and the average highest SF value of0.437was usedfor C-RD due to the random distribution of the a-axis in the RD–TD plane.These predicted yield strengths matchthe experimental data exactly,indicating that the materialyield is dominated by twin nucleation,which is governed by the Schmid law.However,note that,even though thematerial yielded at a lower stress for T-ND due to thegreater value of the highest SF(Fig.2),theflow stress after yielding increased more rapidly for T-ND than for C-RDand this resulted in a greaterflow stress for T-ND abovea strain of$2.6%(Fig.1a).This is contrary to the expecta-tion based on the Schmid law.Figure1b shows the strain path dependence of thetwinned volume fraction evolution with stress.Althoughtwin nucleation is governed by the Schmid law,a much larger amount of the volume was twinned for C-RDthan for T-ND.It is well known that the strain accom-modated by twinning(i.e.twinning strain e twin)is pro-portional to the twinned volume fraction f twin[11]:e twin¼f twinÁmÁc twin where m and c twin represent the aver-age highest SF value and the characteristic twinning shear,respectively.Hence,the unexpectedflow andstrain hardening behaviors beyond yielding are thoughtto result from the difference in evolution characteristicof the twinned volume fraction.It is also noted that the operation of prismatic slip above a stress of >110MPa can partly contribute to the low strain hard-ening of C-RD.Figure3presents in situ EBSD observation resultsfor T-ND.As the material yield began(66MPa),threedifferent types of twins were generated(Fig.3a).Then, as deformation progressed,the twinning process was dominated by the nucleation of new twins rather than the growth of the existing twins.This is contrary to the generally accepted idea that twin growth occurs under lower stresses than those required for nucleation146S.-G.Hong et al./Scripta Materialia64(2011)145–148[9]so that twin growth would be preferred as a twinning process rather than twin nucleation.As described earlier,for T-ND,six twin variants have an equal probability to activate because of their equal SF value(Fig.3c).The simultaneous operation of all six twin variants and the unique crystallographic relationship between the six twin variants increase the possibility of twins intersecting,which would restrict the twin growth by making high misorientation inter-section boundaries(Fig.3d);misorientations of60°explanations correspond exactly with the experimental results(Figs.1and3).For C-RD,however,the twinning process after yield-ing was dominated by the growth of existing twins (Fig.4a).Based on the SF analysis results,only one twin variant pair,T2and T5,adjacent to the loading axis had the highest SF value of$0.5(Fig.4c)and was active during deformation.The operation of such specific twin variants would facilitate the twin growth mechanism be-cause the parallel geometry between identical twin vari-EBSD observation results:(a)inverse polefigure maps of the materials tensioned to66,82,99and140relationship between the parent grain and the twin bands;(c)crystallographic orientation of the parent grain corresponding SF values of the twin variants are indicated as digits;and(d)line profiles of the misorientation angle in(a).Here,P and T i(i=1,2,3,4,5,6)represent the parent grain and the six{10À12}twin1];T2=(À1102)[1À101];T3=(10À12)[À1011];T4=(0À112)[01À11];T5=(1À102)[ÀEBSD observation results:(a)inverse polefigure maps of the materials compressed to66,82,99and140relationship between the parent grain and the twin bands;(c)crystallographic orientation of the parent grain corresponding SF values of the twin variants are indicated as digits;and(d)line profile of the misorientation angle in(a).Here,P,T2and T5represent the parent grain and two different{10À12}twin variants,respectively.existing twins,causing a rapid increase in the twinned volume fraction with stress.It is noted that the opera-tion of prismatic slip in parent grain is also thought to promote the twin growth mechanism[13].The validity of the proposed twin growth control mechanisms can also be confirmed by examining the point-to-point misorientation angle distribution with stress,which reflects the intersecting characteristics be-tween twin variants[7].In summary,although the nucleation of{10À12} twins(i.e.the selection mechanism of active twin vari-ants)was governed by the Schmid law,their growth characteristics during further deformation were con-trolled by the intersection between twin variants.The activation of different twin variants depending on the strain path introduced a significant difference in the intersection characteristics between twin bands and consequently caused a totally different twinning activity in the deformation.For tension parallel to the c-axis,the simultaneous operation of all six twin variants restricted the twin growth by increasing the possibility for twins to intersect with a high misorientation angle of$60°,and thus the twin nucleation dominated the twinning process until the late stage of deformation,causing a reduction in the contribution of twinning to the deformation. For compression perpendicular to the c-axis,however, mostly one twin variant was active in a grain and this introduced a parallel geometry of twin bands.This parallel twin geometry facilitated the twin growth by prohibiting the intersection of twin bands and thus enhanced the twinning activity in the deformation.The authors are grateful for thefinancial sup-port from POSCO and the Korea Research Council of Fundamental Science and Technology(KRCF)through the project of“Development of Advanced Materials Metrology”.[1]X.Y.Lou,M.Li,R.K.Boger,S.R.Agnew,R.H.Wagoner,Int.J.Plasticity23(2007)44.[2]Y.N.Wang,J.C.Huang,Acta Mater.55(2007)897.[3]M.R.Barnett,Z.Keshavarz,X.Ma,Metall.Mater.Trans.A37(2006)2283.[4]L.Jiang,J.J.Jonas,A.A.Luo,A.K.Sachdev,S.Godet,Mater.Sci.Eng.A445–446(2007)302.[5]L.Jiang,J.J.Jonas,R.K.Mishra, A.A.Luo, A.K.Sachdev,S.Godet,Acta Mater.55(2007)3899.[6]S.H.Park,S.G.Hong,C.S.Lee,Scripta Mater.62(2010)202.[7]S.G.Hong,S.H.Park,C.S.Lee,Acta Mater.58(2010)5873.[8]R.E.Reed-Hill,R.Abbaschian,Physical MetallurgyPrinciples,third ed.,PWS-Kent Publishing Company, Boston,MA,1994.[9]P.G.Partridge,Metall.Rev.12(1967)169.[10]S.G.Hong,S.H.Park,Y.H.Huh,C.S.Lee,J.Mater.Res.25(2010)966.[11]C.S.Roberts,Magnesium and its Alloys,John Wiley&Sons,New York,1960.[12]M.D.Nave,M.R.Barnett,Scripta Mater.51(2004)881.[13]L.Capolungo,I.J.Beyerlein,G.C.Kaschner,C.N.Tome´,Mater.Sci.Eng.A513–514(2009)42.148S.-G.Hong et al./Scripta Materialia64(2011)145–148。