雅思A类Task1图表作文实例(上)
雅思图表作文TASK1精讲精练
雅思图表作文TASK1精讲精练A理论部分:雅思小作文概论1、文章结构:主要分三部分:i。
introductory sentence;ii。
body paragraph;iii.Concluding sentence具体讲:第一段introductory sentence只要写一句话,交待图形(如the line graph, pie chart等等),描述对象(如图表描述的是the number of tourists visiting England),地点(如the US, the UK等)以及时间(如between 1988 and 1997等等);另外要注意的就是第一段不能和图表上方已给的句子太过相似!否则,会失分的!第二部分一般写1~3段,这要视情况而定。
这部分主要就是对比不同的数据,如相似或相同的数据;某个数据是另一个数据的2倍;某个数据所占比例最大或最小等等。
最后一段concluding sentence也只要写一句话,主要是总结图表的整个趋势。
2。
文章的效果。
很多学生会发现小作文的例文特别简单(尤其是剑桥书里提供的)。
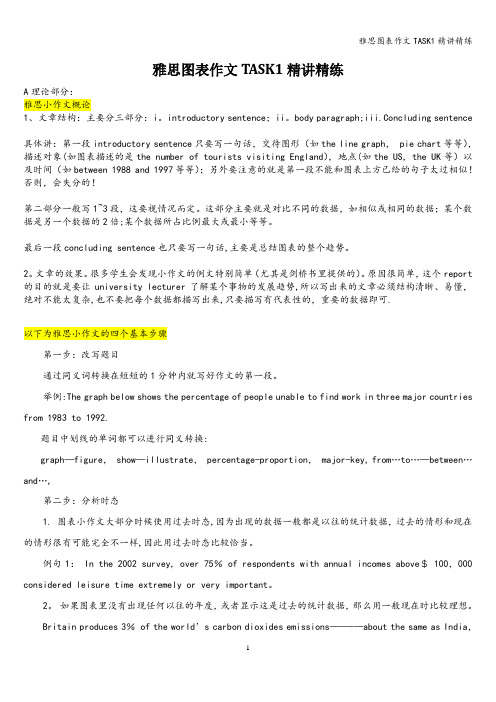
原因很简单,这个report 的目的就是要让university lecturer了解某个事物的发展趋势,所以写出来的文章必须结构清晰、易懂,绝对不能太复杂,也不要把每个数据都描写出来,只要描写有代表性的,重要的数据即可.以下为雅思小作文的四个基本步骤第一步:改写题目通过同义词转换在短短的1分钟内就写好作文的第一段。
举例:The graph below shows the percentage of people unable to find work in three major countries from 1983 to 1992.题目中划线的单词都可以进行同义转换:graph—figure, show—illustrate, percentage-proportion, major-key, from…to…—between…and…,第二步:分析时态1. 图表小作文大部分时候使用过去时态,因为出现的数据一般都是以往的统计数据,过去的情形和现在的情形很有可能完全不一样,因此用过去时态比较恰当。
【朗阁英语】雅思写作Task1数据类图表之第一段的写法分析(一)
【朗阁英语】雅思写作Task1数据类图表之第⼀段的写法分析(⼀)朗阁海外考试研究中⼼蒲玲⽟雅思写作考试中Task 1主要是考察考⽣对线形图、饼状图、表格和柱状图的客观概述能⼒,要求考⽣针对图表提供的信息写出⾄少150词。
具体来讲,要写出图表的主题、数据的变化趋势、最⼤值、交点等等重要特征,以及⼀些关键数据的具体值,并且在必要的时候将数据进⾏对⽐。
要写好这些内容的前提就是⼀个好的第⼀⾃然。
第⼀⾃然的写法主要有两种:改词和改句型。
⼀、改词改词是⼀种最基本最主要的⽅法。
具体的操作就是将题⽬中的名词、动词和时间类的词汇进⾏替换、删除。
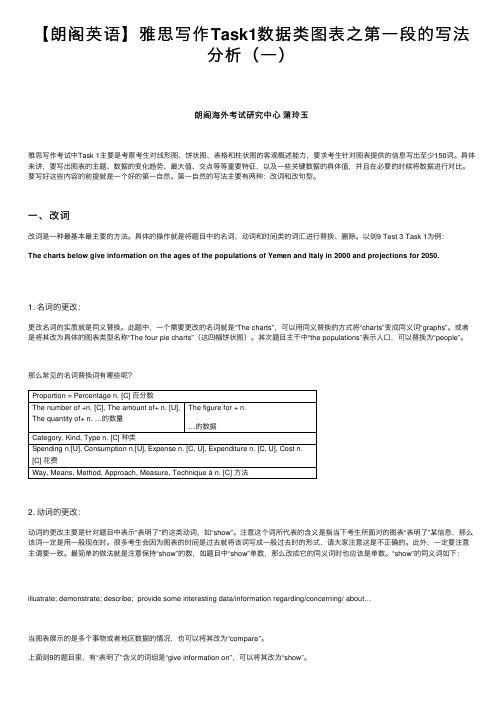
以剑9 Test 3 Task 1为例:The charts below give information on the ages of the populations of Yemen and Italy in 2000 and projections for 2050.1. 名词的更改:更改名词的实质就是同义替换。
此题中,⼀个需要更改的名词就是“The charts”,可以⽤同义替换的⽅式将“charts”变成同义词“graphs”。
或者是将其改为具体的图表类型名称“The four pie charts”(这四幅饼状图)。
其次题⽬主⼲中“the populations”表⽰⼈⼝,可以替换为“people”。
那么常见的名词替换词有哪些呢?Proportion = Percentage n. [C] 百分数The number of +n. [C], The amount of+ n. [U], The quantity of+ n. …的数量The figure for + n.…的数据Category, Kind, Type n. [C] 种类Spending n.[U], Consumption n.[U], Expense n. [C, U], Expenditure n. [C, U], Cost n.[C]花费Way, Means, Method, Approach, Measure, Technique à n. [C] ⽅法2. 动词的更改:动词的更改主要是针对题⽬中表⽰“表明了”的这类动词,如“show”。
雅思 图表作文写作技巧范文

声明:本讲义为GARY 呕心制作,GARY 享有独家版权,禁止转发、出售本讲义或将其用于其他商业用途!Task1 图表作文写作技巧(一)一、认识图表作文20 分钟 150 单词,占写作考试总分值的三分之一,描述一个或几个图表。
线性图(line graph/chart );柱状图(bargraph/chart );饼状图(pie graph/chart );表格( table );流程图(process diagram ) Table:Fig. 1 Pie chart and line graph: sales and share prices for Coca-ColaFig.2 Preferred leisure activities of Australian childrenFig. 3 Underground Railways Systems in Six Cities二、图表作文审题要素1. 描述对象整个图表的数据都是针对描述对象的。
图表的上方标题一般会指示描述对象。
弄清描述对象非常重要,因为在行文时,需要频繁地用到它。
如:sales of Coca Cola,share price of Coca Cola,the preferred leisure activities of Australian kids aged 5-14, wages growth rate。
2. 描述单位对于有 X 轴(horizontal axis)和 Y 轴(vertical axis)的图表,描述单位一般在 Y 轴以符号的形式标明。
弄清描述单位对于数据的准确描述非常关键,把握不准的话就容易被当做跑题。
一般要弄清数字 ( number )和百分比( percentage; proportion )的区别。
另外,记住几个常用的单位缩写符号:$:dollarbn:billionm: million 或 metrekm: kilometre%: percentage / proportion 区别: per cent,000s: thousand比如,第一页的描述单位: bottle / percentage (pie chart), dollar (line chart), percentage (bar chart) 三、图表作文标准结构Part 1 开头段,介绍写作目的,需包含四个要素:图表类型主要描述动词describe,show,present,depict,indicate,representcompare / make a comparison between …描述对象背景信息(地点 + 时间)例如:The line graph gives some detailed information about the wages growth rate of some country over adecade from 1993 to 2003.The pie charts below show the percentage of men and women who smoked in Australia during a 40-yearperiod, between 1960 and 2000.Part 2 主体段:1 + N 结构1: 一句话概括总趋势或总特征( general trend or feature )套句:… have shown striking changes/differences.N: N 段 ( N≥1 )细节描述( striking trends or features )Part 3 结尾段结尾段给出结论。
雅思表格图表题范文
雅思表格图表题范文雅思考试中,表格图表题是常见的题型之一。
这类题目要求考生根据给出的表格或图表,回答相关问题。
在这篇文章中,我们将提供一些雅思表格图表题的范文,帮助考生更好地理解和应对这类题目。
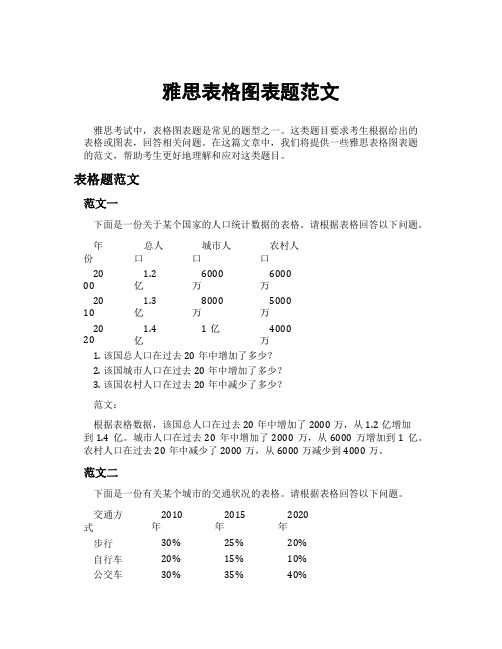
表格题范文范文一下面是一份关于某个国家的人口统计数据的表格。
请根据表格回答以下问题。
年份总人口城市人口农村人口20 001.2亿6000万6000万20 101.3亿8000万5000万20 201.4亿1亿4000万1.该国总人口在过去20年中增加了多少?2.该国城市人口在过去20年中增加了多少?3.该国农村人口在过去20年中减少了多少?范文:根据表格数据,该国总人口在过去20年中增加了2000万,从1.2亿增加到1.4亿。
城市人口在过去20年中增加了2000万,从6000万增加到1亿。
农村人口在过去20年中减少了2000万,从6000万减少到4000万。
范文二下面是一份有关某个城市的交通状况的表格。
请根据表格回答以下问题。
交通方式2010年2015年2020年步行30% 25% 20% 自行车20% 15% 10% 公交车30% 35% 40%交通方式2010年2015年2020年私家车20% 25% 30%1.该城市步行和自行车的使用率在过去10年中分别下降了多少?2.该城市公交车和私家车的使用率在过去10年中分别增加了多少?范文:根据表格数据,该城市步行的使用率在过去10年中下降了10%,从30%下降到20%。
自行车的使用率在过去10年中下降了10%,从20%下降到10%。
公交车的使用率在过去10年中增加了10%,从30%增加到40%。
私家车的使用率在过去10年中增加了10%,从20%增加到30%。
图表题范文范文一下面是一张有关某个城市空气质量的折线图。
请根据图表回答以下问题。
空气质量折线图空气质量折线图1.该城市哪个季节的空气质量最好?2.该城市空气质量在过去一年中有没有出现恶化的趋势?范文:根据折线图数据,该城市春季的空气质量最好,PM2.5浓度约为30。
雅思英语图表作文范文(必备3篇)

雅思英语图表作文范文第1篇A类雅思各类图表作文要点及范文一.曲线图解题关键1曲线图和柱状图都是动态图,解题的切入点在于描述趋势。
2在第二段的开头部分对整个曲线进行一个阶段式的总分类,使写作层次清晰,同时也方便考官阅卷。
接下来再分类描述每个阶段的specifictrend,同时导入数据作为分类的依据。
3趋势说明。
即,对曲线的连续变化进行说明,如上升、下降、波动、持平。
以时间为比较基础的应抓住“变化”:上升、下降、或是波动。
题中对两个或两个以上的变量进行描述时应在此基础上进行比较,如变量多于两个应进行分类或有侧重的比较。
4极点说明。
即对图表中最高的、最低的点单独进行说明。
不以时间为比较基础的应注意对极点的描述。
5交点说明。
即对图表当中多根曲线的交点进行对比说明。
6不要不做任何说明就机械地导入数据,这不符合雅思的考试目的。
曲线图常用词汇动词—九大运动趋势一:表示向上:increase,rise,improve,grow,ascend,mount,aggrandize,goup,climb, take off, jump,shoot up暴涨,soar,rocket, skyrocket雅思英语图表作文范文第2篇It is said that countries are becoming similar to each other because of the global spread of the same products, which are now available for purchase almost anywhere. I strongly believe that this modern development is largely detrimental to culture and traditions worldwide.A country’s history, language and ethos are all inextricably bound up in its manufactured artefacts. If the relentless advance of international brands into every corner of the world continues, these bland packages might one day completely oust the traditional objects of a nation, which would be a loss of richness and diversity in the world, as well as the sad disappearance of t he manifestations of a place’s character. What would a Japanese tea ceremony be without its specially crafted teapot, or a Fijian kava ritual without its bowl made from a certain type of tree bark?Let us not forget either that traditional products, whether these be medicines, cosmetics, toy, clothes, utensils or food, provide employment for local people. The spread of multinational products can often bring in its wake a loss of jobs, as people urn to buying the new brand,perhaps thinking it more glamorous than the one they are used to. This eventually puts old-school craftspeople out of work.Finally, tourism numbers may also be affected, as travelers become disillusioned with finding every place just the same as the one they visited previously. To see the same products in shops the world over is boring, and does not impel visitors to open their wallets in the same way that trinkets or souvenirs unique to the particular area too.Some may argue that all people are entitled to have access to the same products, but I say that local objects suit local conditions best, and that faceless uniformity worldwide is an unwelcome and dreary prospect.Heres my full answer:The line graphs show the average monthly amount that parents in Britain spent on their children’s s porting activities and the number of British children who took part in three different sports from 2008 to is clear that parents spent more money each year on their children’s participation in sports over the six-year period. In terms of the number of children taking part, football was significantly more popular than athletics and 2008, British parents spent an average of around £20 per month on their children’s sporting activities. Parents’ spending on children’s sports increased gradually over the followi ng six years, and by 2014 the average monthly amount had risen to just over £ at participation numbers, in 2008 approximately 8 million British children played football, while only 2 million children were enrolled in swimming clubs and less than 1 million practised athletics. The figures for football participation remained relatively stable over the following 6 years. By contrast, participation in swimming almost doubled, to nearly 4 million children, and there was a near fivefold increase in the number of children doing athletics.剑桥雅思6test1大作文范文,剑桥雅思6test1大作文task2高分范文+真题答案实感。
雅思A类Task1图表作文实例(上)

You should spend about 20 minutes on this task.The graph below compares the number of visits to two new music sites on the web.Write a report for a university lecturer describing the information shown below.You should write at least 150 words.model answer:The graph shows people using new music places on the Internet in fifteen days period of time namely personal choice and trendy pop music.The overall trend shows fluctuation with slight Increased towards the end of the period.Starting with Music Choice websites; 40,000 poeple went on this new site on first-day. Half of them backed out the next day. In Contrast to this Pop Parade net sites were visited by 120,000 music lovers on day one which decreased slightly on the next day thereafter regaining the same fame on 3rd day.After 3rd day the enthusiasm for both music lines on Internet dropped slowly- reaching maximum fall of 40,000 on 7th day. Whereas Music choice gained popularity, slightly Improoving to get the original strength of 30,000 viewers on screen, but was getting still less visiters than their opponent Pop group i.e. 40,000 on day 7.In the biegining of the next week both gained remarkable recovery after a few fluctuations for8th and 9th day having 40,000 and 50,000 visiters respectively, reaching to their peaks of one and a half thousand new viewers for Pop Parade on 11th day showing a contrast of very few people visiting Music choice for the same day. Thereafter Music choice gained popularity on 12th day for having more than 120,000 new visiters on web.In the end of the period Pop sites were visited by maximum viewers of 180,000 whereas sites located to Music choice were not explored by more than 80,000 explorers on the last day of the report.This is an answer written by a candidate who achieved a Band 6 score. Here is the examiner's comment:Well organized with some good linking devices and collocations (gain popularity, remarkable recovery, decrease slightly) and some valid comparison of the music sites. However, some sentences are long and confusing (paragraph 5), some collocations are inaccurate (slight increased, reaching to their peaks) and there is some repetition (7th day, 3rd day, 11 th day). Some words are spelt incorrectly (poeple, Improoving, visiters, biegining).You should spend about 20 minutes on this task.The table below shows the proportion of different categories of families living in poverty in Australia in 1999.Summarise the information by selecting and reporting the main features, and make comparisons where relevant.You should write at least 150 words.Give reasons for your answer and include any relevant examples from your own knowledge or experience.model answer:The table gives a breakdown of the different type of family who were living in poverty in Australia in 1999.On average, 11% of all households, comprising almost two million people, were in this position. However, those consisting of only one parent or a single adult had almost doubt this proportion of poor people, with 21% and 19% respectively.Couples generally tended to be better off, with lower poverty levels for couples without children (7%) than those with children (12%). It is noticeable that for both types of household with children, a higher than average proportion were living in poverty at this time.Older people were generally less likely to be poor, though once again the trend favoured eldery couples (only 4%) rather than single eldery people (6%).Overall the table suggests that households of single adults and those with children were more likely to be living in poverty than those consisting of couples.(154 words)You should spend about 20 minutes on this task.The charts below show the percentage of their food budget the average family spent on restaurant meals in different years. The graph shows the number of meals eaten in fast food restaurants and sit-down restaurants.You should write at least 150 words.Give reasons for your answer and include any relevant examples from your own knowledge or experience.model answer:Over the past 30 years, the average family has dramatically increased the number of meals that they eat at restaurants. The percentage of the family's food budget spent on restaurant meals steadily climbed. Just 10 percent of the food budget was spent on restaurant meals in 1970, and 15 percent in 1980. That percentage more than doubled in 1990, to 35 percent, and rose again in 2000 to 50 percent.Where families eat their restaurant meals also changed during that 30-year period. In 1970,families ate the same number of meals at fast food and sit-down restaurants. In 1980,fam¬ilies ate slightly more frequently at sit-down restaurants. However, since 1990, fast food restaurants serve more meals to the families than do the sit-down restaurants. Most of the restaurant meals from 2000 were eaten at fast food restaurants. If this pattern continues, eventually the number of meals that families eat at fast food restaurants could double the number of meals they eat at sit-down restaurants.(164 words)You should spend about 20 minutes on this task.The table below shows CO2 emissions for different forms of transport in the European Union.The Pie Chart shows the percentage of European Union funds being spent on different forms of transport.You should write at least 150 words.Give reasons for your answer and include any relevant examples from your own knowledge or experience.model answer:The chart shows CO2 emissions per passenger kilometre for variuos methods of transport in the European Union while the pie chart shows European Union spending on transport. Flying by air produces by far the greatest CO2 emissions, approximately three times as much as passenger cars which are the next largest producers. Very little is spent by the EU on air travel while roads make up more than half of the EU transport budget.Trains produce about three times less CO2 emissions per passenger kilometre than passenger cars and eight times less than air travel. Nearly a third of EU transport funds are spent on railways.Ships are a clean form of transport and produce about the same amount of CO2 per passenger kilometre as trains do. However, only 2 percent of EU funds are spent on ports. A further one percent is spent on inland waterways.Coaches are the cleanest form of transport. Emissions of CO2 per passenger kilometre from coaches are half those of buses. Buses emit less than half as much CO2 per passenger kilometre as cars. The European Union spends 10 percent of its transport budget on public transport, such as buses and coaches.(197 words)You should spend about 20 minutes on this task.The table below shows the sales at a small restaurant in a downtown business district.Summarize the information by selecting and reporting the main features, and make comparisons where relevant.You should write at least 150 words.Give reasons for your answer and include any relevant examples from your own knowledge or experience.Fulfilling the Work Experience RequirementCredits will be awarded when the final report is submitted.ApplicationChoose potential workplaces from approved list and arrangeinterviews. Submit applications to places of interest.ApprovalWhen acceptance letter is received, submit itto professor for approval.Arrange schedule to work a minimum of 10hours/ week over 20 weeks.ReportsComplete weekly Report Form and submit toprofessor every Friday.EvaluationDuring final workweek, participate in evaluation meeting with worksupervisor. Supervisor submits Evaluation Form.Submit Final Report before last week of spring term.model answer:Gaining work experience prior to graduation helps university students to succeed in getting their first job. For this reason, some universities insist that all students must complete a Work Experience Requirement. Completing the following six stages results in the requirements’ fulfillment.The process begins with the Application stage. A student reviews an approved list of workplaces and submits applications to places where he would like to work. Next is the Approval stage. When a student receives an acceptance letter, he gives it to the professor for approval. The third stage, Schedule, requires a student to arrange his work schedule. The student should work at least 10 hours/week over 20 weeks. Reports are next. The student must complete a Weekly Report Form and turn it in to the professor every Friday.The fifth stage, Evaluation, takes place during the final work week. A student participates in an evaluation meeting with his work supervisor, who submits an Evaluation Form. The last stage requires that a student submit a Final Report before the last week of spring semester.By following these stages and subsequently submitting the final report, the student receives credit from the university.(192 words)。
雅思英语图表作文模板

雅思英语图表作文模板Title: A Comprehensive IELTS Writing Task 1 Templatefor Graphs and Charts。
Introduction:The given graph/chart illustrates/depicts/presents... (briefly describe the main subject of the graph/chart). The data spans from [start date] to [end date] and represents [specific topic or theme].Overview:To provide a general perspective, it is evident that... (summarize the main trends or patterns observed in the data). Furthermore, it is noticeable that... (highlight any significant changes or noteworthy points).Detailed Analysis:1. Introduction of the graph/chart:Begin by stating what the graph/chart is about and what it represents.Example: The bar chart provides information about the annual revenue generated by different sectors in a certain country over a ten-year period.2. Overview of the data:Summarize the main trends or patterns observed in the data.Example: Overall, the data shows a steady increase in revenue for the manufacturing sector, while the service sector experienced fluctuating growth.3. Detailed Description:Provide specific details about the data presented in the graph/chart.Example: In 20XX, the manufacturing sector accounted for the highest revenue, surpassing the service sector by $X million. However, by 20XX, the service sector experienced a significant surge in revenue, outperforming the manufacturing sector by $Y million.4. Comparisons and Contrasts:Compare different elements or categories within the data.Example: The agricultural sector consistently lagged behind both manufacturing and services throughout theentire period. Additionally, while manufacturing showed steady growth, the technology sector experienced rapid fluctuations, reaching its peak in 20XX before sharply declining in subsequent years.5. Additional Insights:Offer any additional insights or observations basedon the data.Example: It is worth noting that government policies introduced in 20XX had a significant impact on the energy sector, leading to a notable increase in revenue from renewable sources.Conclusion:In conclusion, the data presented in the graph/chart highlights... (restate the main findings or observations). Overall, it provides valuable insights into... (summarize the significance of the data in relation to the topic).Word Count: XXX words。
雅思A类写作-图表写作模板

雅思A类写作-图表写作模板⼀.图表写作常⽤模板Para1. This is a table / chart / (line线状bar柱状pie饼状)graph which demonstrate / illustrate / reveal /depict /privide information about.............Para2. (1)Obvious /Apparent from the graph is that ...rank thefirst/highest,while/whereas ....turn out to be the lowest(2)It is exhibited/shown in the table that.....(3)It can be seen from the table that.....Para3.(1)饼.柱图A,which accounts for...%,ranks the first;then next is B with...%;followed by C,constituting...%;finally it comes D.E.F at...%...%and...%respectively(2)特殊变化(不变,增长或下降多的)①It is worth mentioning that....②It must be pointed out that....③More striking/surprising is that....Para4.To conclude /In conclusion/overall雅思写作图表作⽂标准化结构样本仅供参考Para 1, 两句话:第⼀句:This is a _____chart, which demonstrates the number of_____ from ____ to ____. 如果两个图,则:There are two charts below. The _____ chart describes the number of _____, and the _____ chart illustrates the figure of ____. 第⼆句:(所有题⽬适⽤),From the chart we can see that the number of ______ varies constantly/greatly in _____.Para 2, As we can see from the chart,/or It is clear from the chart that ____.如果有两个图:则:The _____ chart shows that ______./or As we can see from the first chart, _______Para 3, (如果两个图的话,) It is clear from the second chart that …Para 4 结尾:From the figures/statistics above, we can see/conclude/draw a conclusion that …⼆.应注意事项DON'T copy any part of the question in your answer. This is not your own work and therefore will be disregarded by the examiner and deducted from the word count. You can use individual words but be careful of using long "chunks" of the question text.Don't repeat yourself or the same ideas. This gives a bad impression and the examiner realises that it isn't adding to the content of your report.If you are weak at English grammar, try to use short sentences. This allows you to control the grammar and the meaning of your writing much more easily and contributes to a better cohesion and coherence mark. It's much easier to make things clear in a foreign language if you keep your sentences short!Think about the tenses of your verbs. If you're writing about something that happened in the past, your verbs will need to be in the past tenses. If you're describing the future, you will need to use the future tenses. If it's a habitual action, you'll need the present simple tense and so on. If you have time, a quick check of your verbs at the end of the exam can help you find errors. For describing graphs you will probably need past tenses whereas, for describing a process, you will probably need the present simple. Think about the verbs while practising and then it will become easier when you do the exam.As I just said, if you have finished the exam with time to spare, DON'T just sit there!! Check what you have done. If you have time after the check, check again. And so on……Don't be irrelevant. Although you can use your imagination to expand on your answer, if any part of your report is totally unrelated to the question and put in to just put up the word count, then the examiner will not take it into account and deduct it from the word count.If you want to improve, there's no secret. Practice. Practice. Practice. You won't get better sitting and doing nothing. Even good English users need practice for the IELTS exam. It could make all the difference between your getting the band that you need, and getting half a band less than you need and having to wait 3 months to do the exam again.三.写作范⽂雅思TASK1图表写作套句精选50句1.the table shows the changes in the number of...over the period from...to...该表格描述了在...年之...年间...数量的变化。
- 1、下载文档前请自行甄别文档内容的完整性,平台不提供额外的编辑、内容补充、找答案等附加服务。
- 2、"仅部分预览"的文档,不可在线预览部分如存在完整性等问题,可反馈申请退款(可完整预览的文档不适用该条件!)。
- 3、如文档侵犯您的权益,请联系客服反馈,我们会尽快为您处理(人工客服工作时间:9:00-18:30)。
You should spend about 20 minutes on this task.The graph below compares the number of visits to two new music sites on the web.Write a report for a university lecturer describing the information shown below.You should write at least 150 words.model answer:The graph shows people using new music places on the Internet in fifteen days period of time namely personal choice and trendy pop music.The overall trend shows fluctuation with slight Increased towards the end of the period.Starting with Music Choice websites; 40,000 poeple went on this new site on first-day. Half of them backed out the next day. In Contrast to this Pop Parade net sites were visited by 120,000 music lovers on day one which decreased slightly on the next day thereafter regaining the same fame on 3rd day.After 3rd day the enthusiasm for both music lines on Internet dropped slowly- reaching maximum fall of 40,000 on 7th day. Whereas Music choice gained popularity, slightly Improoving to get the original strength of 30,000 viewers on screen, but was getting still less visiters than their opponent Pop group i.e. 40,000 on day 7.In the biegining of the next week both gained remarkable recovery after a few fluctuations for8th and 9th day having 40,000 and 50,000 visiters respectively, reaching to their peaks of one and a half thousand new viewers for Pop Parade on 11th day showing a contrast of very few people visiting Music choice for the same day. Thereafter Music choice gained popularity on 12th day for having more than 120,000 new visiters on web.In the end of the period Pop sites were visited by maximum viewers of 180,000 whereas sites located to Music choice were not explored by more than 80,000 explorers on the last day of the report.This is an answer written by a candidate who achieved a Band 6 score. Here is the examiner's comment:Well organized with some good linking devices and collocations (gain popularity, remarkable recovery, decrease slightly) and some valid comparison of the music sites. However, some sentences are long and confusing (paragraph 5), some collocations are inaccurate (slight increased, reaching to their peaks) and there is some repetition (7th day, 3rd day, 11 th day). Some words are spelt incorrectly (poeple, Improoving, visiters, biegining).You should spend about 20 minutes on this task.The table below shows the proportion of different categories of families living in poverty in Australia in 1999.Summarise the information by selecting and reporting the main features, and make comparisons where relevant.You should write at least 150 words.Give reasons for your answer and include any relevant examples from your own knowledge or experience.model answer:The table gives a breakdown of the different type of family who were living in poverty in Australia in 1999.On average, 11% of all households, comprising almost two million people, were in this position. However, those consisting of only one parent or a single adult had almost doubt this proportion of poor people, with 21% and 19% respectively.Couples generally tended to be better off, with lower poverty levels for couples without children (7%) than those with children (12%). It is noticeable that for both types of household with children, a higher than average proportion were living in poverty at this time.Older people were generally less likely to be poor, though once again the trend favoured eldery couples (only 4%) rather than single eldery people (6%).Overall the table suggests that households of single adults and those with children were more likely to be living in poverty than those consisting of couples.(154 words)You should spend about 20 minutes on this task.The charts below show the percentage of their food budget the average family spent on restaurant meals in different years. The graph shows the number of meals eaten in fast food restaurants and sit-down restaurants.You should write at least 150 words.Give reasons for your answer and include any relevant examples from your own knowledge or experience.model answer:Over the past 30 years, the average family has dramatically increased the number of meals that they eat at restaurants. The percentage of the family's food budget spent on restaurant meals steadily climbed. Just 10 percent of the food budget was spent on restaurant meals in 1970, and 15 percent in 1980. That percentage more than doubled in 1990, to 35 percent, and rose again in 2000 to 50 percent.Where families eat their restaurant meals also changed during that 30-year period. In 1970,families ate the same number of meals at fast food and sit-down restaurants. In 1980,fam¬ilies ate slightly more frequently at sit-down restaurants. However, since 1990, fast food restaurants serve more meals to the families than do the sit-down restaurants. Most of the restaurant meals from 2000 were eaten at fast food restaurants. If this pattern continues, eventually the number of meals that families eat at fast food restaurants could double the number of meals they eat at sit-down restaurants.(164 words)You should spend about 20 minutes on this task.The table below shows CO2 emissions for different forms of transport in the European Union.The Pie Chart shows the percentage of European Union funds being spent on different forms of transport.You should write at least 150 words.Give reasons for your answer and include any relevant examples from your own knowledge or experience.model answer:The chart shows CO2 emissions per passenger kilometre for variuos methods of transport in the European Union while the pie chart shows European Union spending on transport. Flying by air produces by far the greatest CO2 emissions, approximately three times as much as passenger cars which are the next largest producers. Very little is spent by the EU on air travel while roads make up more than half of the EU transport budget.Trains produce about three times less CO2 emissions per passenger kilometre than passenger cars and eight times less than air travel. Nearly a third of EU transport funds are spent on railways.Ships are a clean form of transport and produce about the same amount of CO2 per passenger kilometre as trains do. However, only 2 percent of EU funds are spent on ports. A further one percent is spent on inland waterways.Coaches are the cleanest form of transport. Emissions of CO2 per passenger kilometre from coaches are half those of buses. Buses emit less than half as much CO2 per passenger kilometre as cars. The European Union spends 10 percent of its transport budget on public transport, such as buses and coaches.(197 words)You should spend about 20 minutes on this task.The table below shows the sales at a small restaurant in a downtown business district.Summarize the information by selecting and reporting the main features, and make comparisons where relevant.You should write at least 150 words.Give reasons for your answer and include any relevant examples from your own knowledge or experience.Fulfilling the Work Experience RequirementCredits will be awarded when the final report is submitted.ApplicationChoose potential workplaces from approved list and arrangeinterviews. Submit applications to places of interest.ApprovalWhen acceptance letter is received, submit itto professor for approval.Arrange schedule to work a minimum of 10hours/ week over 20 weeks.ReportsComplete weekly Report Form and submit toprofessor every Friday.EvaluationDuring final workweek, participate in evaluation meeting with worksupervisor. Supervisor submits Evaluation Form.Submit Final Report before last week of spring term.model answer:Gaining work experience prior to graduation helps university students to succeed in getting their first job. For this reason, some universities insist that all students must complete a Work Experience Requirement. Completing the following six stages results in the requirements’ fulfillment.The process begins with the Application stage. A student reviews an approved list of workplaces and submits applications to places where he would like to work. Next is the Approval stage. When a student receives an acceptance letter, he gives it to the professor for approval. The third stage, Schedule, requires a student to arrange his work schedule. The student should work at least 10 hours/week over 20 weeks. Reports are next. The student must complete a Weekly Report Form and turn it in to the professor every Friday.The fifth stage, Evaluation, takes place during the final work week. A student participates in an evaluation meeting with his work supervisor, who submits an Evaluation Form. The last stage requires that a student submit a Final Report before the last week of spring semester.By following these stages and subsequently submitting the final report, the student receives credit from the university.(192 words)。