考研英语二图表类作文常用描述词汇及表达
考研英语(二)图表作文核心单词速记
考研英语(二)图表作文核心单词速记
来源:文都图书
马上就要进行2016年硕士研究生考试了,考生们一定都非常期待自己将在这次考试上有多么完美的表现,而想要接近完美,大家还需在剩余的十几天好好练习考研英语写作题,因为它是考查范围最综合的题型,词汇短语、句型模板、语法思维等等都是其考查的内容,推荐大家看一看谭剑波老师的《考研英语(二)写作考前冲刺万用魔板》,先从速记核心词汇开始!
1.demonstrate v.证明;展示;示威
【单词记忆】de-下,词根monstr-“警告”,来自monster“怪物”;动物园有危险动物都会有警告,用怪物来创造警告也可以理解。
-ate 动词后缀。
人民在下面警告,就是示威。
【同义替换】prove,show
【写作例句】The picture demonstrates that...图画表明……
2.dramatically ad.戏剧性地;引人注目地
【单词记忆】drama“戏剧”,tic+al+ly是复合后缀,整个词表示“戏剧性地”。
【同义替换】remarkably,noticeably
【写作例句】The population in cities increased dramatically because of urbanization.由于城市化,城市人口数量急剧上涨。
这本书中针对考研英语(二)的图表作文展开了讲解:概述、题型讲解、万用模板、范文讲解和命题预测五大方面的内容,帮助考生快速拿下考研英语图表作文。
除此之外,100个核心词汇、低端词汇的高端替换、常用表达等等基本知识也都收录在书中,让大家全方位提高自己的写作能力。
预祝大家考研顺利哦!加油!。
考研英语图表作文考前词汇积累
考研英语图表作文考前词汇积累来源:智阅网图表作文是考研英语(二)大作文的唯一考查题型,其重要性考生们可想而知。
而想要在短时间内提升图表作文的写作能力,推荐大家看一看《考研英语写作高分攻略》,书中全方位的介绍了图表作文的情况,除此之外还有核心词汇100词、低端词汇的高端替换、常用表达等等基础知识的补充,今天先来看看常用词汇吧!1.Decline v.下降;衰退 n.下降;下滑【单词记忆】de-“下”,cline看作line“线”,一条线往下,就是下降,下跌,下滑。
【同义替换】decrease,drop【写作例句】The chart above shows the decline of consumption level.以上图表表明消费水平下滑。
The declining consumption level reveals the depression of economic level.下滑的消费水平意味着经济水平的衰退。
2.Decay v.衰退 n.衰退;衰减【单词记忆】de-“向下”,cay“落”(词根-cay,-cad,-cid都表示“落”,如occidental西方的,-oc加强,-cid落,-ent+-al为复合后缀,西方就是日落的地方,因此-cid表示“落”)。
整个词表示向下落,就是下降,衰退之意。
【同义替换】decline,depression【写作例句】The decay of economy is caused by several reasons.经济衰退是由多种原因造成的。
词汇是英语的基础,丰富的词汇量会让考生们的作文更加出彩,所以希望大家利用好这本书,提升自己的写作技能。
最后预祝考生们顺利拿下考研英语!加油!。
考研英语二图表类作文常用描述词汇及表达
考研英语二图表类作文常用描述词汇及表达本文汇总了考研英语二大作文图表类作文写作中描述词汇、词组及句型常用表达的相关内容,帮助大家在考研英语作文中拿到高分。
图表描述词汇、词组及句型常用表达基本要素类型:table, chart, diagram/graph, column chart, pie graph描述:show, describe, illustrate, reveal, represent, can be seen from, clear, apparent内容:figure, statistic, number, percentage, proportion表示数据变化的单词或者词组–动词(1) 起伏、波动rise and fall, fluctuate, wave, undulate, rebound, recover(2) 高、低点值peak, reach a (high) peak/point,reach the bottom, reach a low point(3) 增加、上升、提高increase, grow, rise, climb, expand, ascend, skyrocket, soar(4) 减少、下降decrease, decline, fall, drop, descend, diminish, slide, shrink, collapse 形容词或副词(1)变化巨大迅速的,飞快的,rapid/rapidly戏剧性的,生动的dramatic/dramatically有意义的,重大的significant/significantly锐利的,明显的sharp/sharply急剧升降的steep/steeply(2)变化平缓稳固的,坚定不移的steady/steadily渐进的,逐渐的gradual/gradually缓慢的,不活跃的slow/slowly轻微的、略微地slight/slightly稳定的stable/stably英语图表写作套句推荐图表的总体描述1.The table shows the changes in the number of……over the period from……to……2.The data/statistics/figures lead us to the conclusion that……3.As can be seen from the diagram, great changes have taken place in……/ the two curves show the fluctuation of……4.From the table/chart/diagram/figure, we can see clearly that……or it is clear/apparent from the chart that……5.This is a graph which illustrates……6.The graph, …presented in a pie chart, shows the general trend in……7.This is a column chart showing……时间段表达方式1.over the period from…to…the…remained level.2.in the year between……and……3.in the 3 years spanning from 1995 through 1998……4.from then on/from this time onwards……数据变化表达方式表示上升趋势的句型:1.the number sharply went up to……2.the figures peaked at……in(month/year)3.the situation reached a peak(a high point at) of[%].4.a increased by……5.a increased to……6.there is an upward trend in the number of……7. a considerable increase/decrease occurred from……to……8.……(year)witnessed/saw a sharp rise in……表示下降趋势的句型:1.the figures/situation bottomed out in……2.the figures reached the bottom/a low point/hit a trough.3.from……to……the rate of decrease slow down.4.from this year on,there was a gradual decline/ reduction in the……,reaching a figure of……表示平稳趋势的句型:1.the number of……remained steady/stable from (month/year) to (month/year).2.the percentage of…stayed the same between…and……3.the percentage remained steady at……表示比较的句型:1.the percentage of…is slightly larger/smaller than that of2.there is not a great deal of difference between……and……3.…decreased year by year while……increased steadily.4.there are a lot similarities/differences between……and……5.a has something in common with b6.the difference between a and b lies in……表示倍数的句型:1.the graphs show a threefold increase in the number of……2.a is ……times as much/many as b.。
英语图表类作文常用词汇及句型
英语图表类作文常用词汇及句型图表作文是考研英语作文考察的一大形式,店铺整理了图表作文的备考方法,希望对考研的同学有所帮助。
1、主章开头图表类型:table、chart、diagram、graph、column chart、pie graph描述:show、describe、illustrate、can be seen from、clear、apparent、reveal、represent内容:figure、statistic、number、percentage、proportion2、表示数据变化的单词或词组rapid/rapidly 迅速的,飞快的,险峻的dramatic/dramatically 戏剧性的,生动的 significant/significantly有意义的,重大的,重要的sharp/sharply 锐利的,明显的,急剧的steep/steeply 急剧升降的steady/steadily 稳固的,坚定不移的gradual/gradually 渐进的,逐渐的slow/slowly 缓慢的,不活跃的slight/slightly 轻微的、略微地stable/stably 稳定的3、图表中的数据(Data)具体表达法数据(Data)在某一个时间段固定不变:fixed in time 在一系列的时间段中转变:changes over time持续变化的'data在不同情况下:增加:increase / raise / rise / go up ……减少:decrease / grow down / drop / fall ……波动:fluctuate / rebound / undulate / wave ……稳定:remain stable / stabilize / level off ……最常用的两种表达法:动词+副词形式(Verb+Adverb form)形容词+名词形式(Adjective+Noun form)4、其它在描述中的常用到的词significant changes 图中一些较大变化noticeable trend 明显趋势during the same period 在同一时期grow/grew 增长distribute 分布,区别unequally 不相等地in the case of adv. 在……的情况下in terms of / in respect of / regarding 在……方面 in contrast 相反,大不相同government policy 政府政策market forces 市场规率measure n.尺寸,方法,措施v.估量,调节forecast n.先见,预见v.预测英语图表写作套句精选开始句1.the table shows the chang es in the number of……over the period from……to……该表格描述了在……年之……年间……数量的变化。
2020考研英语二:图表写作常识

2020考研英语二:图表写作常识考研英语有许多题目组成,方便大家及时了解,下面由小编为你精心准备了“2020考研英语二:图表写作常识”,持续关注本站将可以持续获取更多的考试资讯!2020考研英语二:图表写作常识图表作文(二)一、图表作文写作常识1、图形种类及概述法:泛指一份数据图表: a data graph/chart/diagram/illustration/table饼图:pie chart直方图或柱形图:bar chart/histogram趋势曲线图:line chart/curve diagram表格图:table流程图或过程图:flow chart/sequence diagram程序图:processing/procedures diagram2、常用的描述用法The table/chart diagram/graph shows(that)According to the table/chart diagram/graphAs(is)shown in the table/chart diagram/graphAs can be seen from the table/chart/diagram/graph/figures,figures/statistics shows(that)……It can be seen from the figures/statisticsWe can see from the figures/statisticsIt is clear from the figures/statisticsIt is apparent from the figures/statisticstable/chart/diagram/graph figures(that)……table/chart/diagram/graph shows/describes/illustrates how……3、图表中的数据(Data)具体表达法数据(Data)在某一个时间段固定不变:fixed in time在一系列的时间段中转变:changes over time持续变化的data在不同情况下:增加:increase/raise/rise/go up……减少:decrease/grow down/drop/fall……波动:fluctuate/rebound/undulate/wave……稳定:remain stable/stabilize/level off……最常用的两种表达法:动词+副词形式(Verb+Adverb form)形容词+名词形式(Adjective+Noun form)2020考研英语二:图表作文的写作要领写好图表作文,关键在于能否读懂图表中所提供的信息,把握各信息间的联系,用准确流畅的语言把这一信息表达出来,并就这一信息发表自己的看法。
最新全国考研英语二图表作文范文及核心词汇打印版.doc
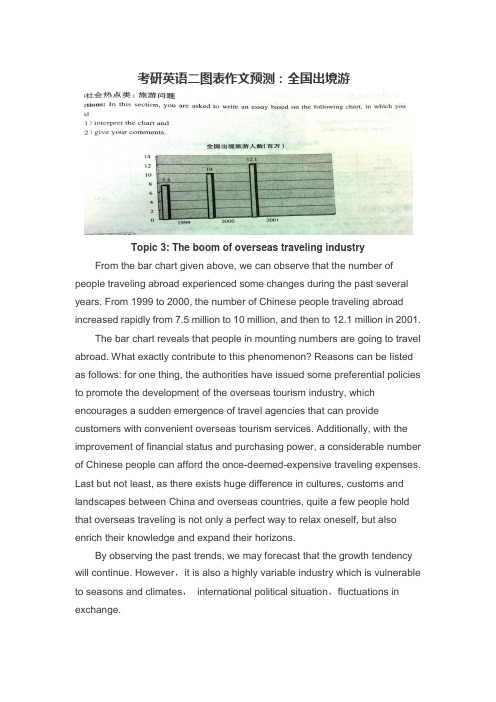
考研英语二图表作文预测:全国出境游Topic 3: The boom of overseas traveling industry From the bar chart given above, we can observe that the number of people traveling abroad experienced some changes during the past several years. From 1999 to 2000, the number of Chinese people traveling abroad increased rapidly from 7.5 million to 10 million, and then to 12.1 million in 2001.The bar chart reveals that people in mounting numbers are going to travel abroad. What exactly contribute to this phenomenon? Reasons can be listed as follows: for one thing, the authorities have issued some preferential policies to promote the development of the overseas tourism industry, which encourages a sudden emergence of travel agencies that can provide customers with convenient overseas tourism services. Additionally, with the improvement of financial status and purchasing power, a considerable number of Chinese people can afford the once-deemed-expensive traveling expenses. Last but not least, as there exists huge difference in cultures, customs and landscapes between China and overseas countries, quite a few people hold that overseas traveling is not only a perfect way to relax oneself, but also enrich their knowledge and expand their horizons.By observing the past trends, we may forecast that the growth tendency will continue. However,it is also a highly variable industry which is vulnerable to seasons and climates,international political situation,fluctuations in exchange.考研英语二图表作文预测:电子商务成交额Global E-commerce turnoverFrom the curve chart given above, we can observe that the turnover of global E-commerce experienced some change during the past several years. From 1997 to 2005, it rose dramatically from 20 billion to 900 billion.The curve chart reveals that the global E-commerce industry enjoys an explosive growth. Quite a few reasons can be listed to account for this phenomenon, and the followings might be the most critical ones: for one thing, the authorities of different countries have issued some preferential policies to protect and encourage the development of E-commerce, thus quite a few online-transaction websites emerge overnight. Moreover, theone-click-payment consumption mode has been widely accepted by the public thanks to the widespread availability of the Internet. Last but not least, people’s decision to purchase on-line can also be put down to the power of so-called “group-dynamics”: when our friends are shopping at network, we will be influenced by them and imitate their behaviors unconsciously.The rapid development of E-commerce signals that new business models contribute largely to the sustainable development of the global economy. However, when enjoying the fruits offered by modern technology, we should also keep an eye on the underlying threat of it. In a world features open boundary, deception and fraud sometime abound. (209 words )考研英语二图表作文预测:职业选择Different job inclination between boys and girls From the bar chart given above, we can find that it reflects the statistics of profession inclination between girls and boys. Most obviously, 40% of boys intend to be a manager, with only 15% of girls choosing this job. When it comes to the profession of teacher, we can observe that 45% of girls prefer to take this job, while the proportion of boys only account for 5%, 40% lower than that of girls.The bar chart informs us of the phenomenon that there exists some difference in profession inclination between boys and girls. What exactly contribute to this phenomenon ? reasons can be listed as follow: for one thing, quite a few boys regard being a manager as a symbol of success. As this profession stands for promising futures, fat pay and competence. Moreover, boys’ decision to be a manager can also be attributed to the power of so-called “group dynamics”: when members of their social network prefer to be a manager after graduation, they are easily influenced and imitate others’ behavior unconsciously or consciously. When it comes to girls, the are more inclined to be a teacher. As this profession features stability and respect. Takesocial and biological factors into account, we know that it is reasonable for girl to choose teacher as their ideal profession goals.Both girls and boys have rights to choose their profession. However, one thing we should bear in mind is that there exists no better or worse, superior or inferior jobs, but suitable and satisfactory ones. (254words)考研英语二作文范文:中国职业的变化The changes of Chinese professionsFrom the pie chart given above, we can observe that the professions structure of Chinese people experienced some changes during the past several years. From 1980 to 1999, the percentage of agricultural professions decreased by 30% from 68% to 38%. During the same period, however, service sectors increased rapidly from 5% to 22%. When it comes to the manufacturing professions, its percentage rose markedly from 27% in 1980 to 40% in 1999.The pie chart reveals the phenomenon that there exists some difference in the development tendency among different professions in China. What exactly contribute to this phenomenon ? reasons can be listed as follows: for one thing, with the rapid process of urbanization, people in mounting numbers, especially youngster, have left their village homes ,moved into big cities and thus been out of agricultural industries. Moreover, quite a few people, especially college graduates hold that it is comparatively easy for them to make more money inthe service industry. When it comes to the manufacturing industry, its transformation might be attributed to the adjustment of industrial structure: the authorities have issued some preferential policies to promote the rapid extension of manufacturing industry, thus, more workforces are required.By observing the change over the past several years, we may forecast that the proportion of professions of service and manufacture will continue to rise. However, a high value should be placed on the development of agricultural industry by the public and the authorities. Otherwise, with the number of people who are engaged in agriculture diminishing, we will one day have nothing to eat! (262words)考研英语二作文范文:快餐和坐下来餐厅发展趋势The development tendency of fast food and sit down restaurantFrom the curve chart given above, we can observe that the number meals of fast food and sitdown restaurant experienced some changes during the past several years. The number of meals of fast food increased slowly from 20 in 1970 to nearly 30 in 1980. From 1980 to 2000, it ascended rapidly from 30 to approximately 90. On the contrary, when observing the statistics of sitdown restaurant meals, we can find that it increased slowly from 20 in 1970 to roughly 50 in 2000.The curve chart informs us of the phenomenon that there exists some difference in the development tendency between fast food and sitdown restaurants. What exactly contribute to this phenomenon? Reasons can be listed as follows: for one thing, with the pace of modern life quickening, people barely have much time to waste in lining up for restaurant meals, on the contrary, fast food meals can do help busy people save a great deal of time. Additionally, the authorities have issued some preferential policies to protect and encourage the rapid extension of fast food industry , thus the public can buy fast food at shops scattering around the city. On the contrary , people in diminishing numbers are willing to eat at sitdown restaurant. They think that eating at restaurant is always time-consuming and inconvenient. Besides, food at restaurant is comparatively expensive than fast food.by observing the trend of the past, we may forecast that the number of fast food meals will continue to rise in the years to come. However, we should also take the detrimental impact of fast food into consideration. Do remember that fast food is one of the main causing factors of diseases such as heart attack, obesity and diabetes.英语二赠送以下资料考研英语作文模板(英语一)大作文考研英语大作文一般是看图写作,从一幅图分析含义及意义,所以只需要几个好的模板,根据题目套上去就行了。
考研英语(二)图表作文经典模板
考研英语(二)图表作文经典模板
来源:文都图书
考研英语(二)的大作文图表作文相对考研英语(一)来说是比较简单的,它有一些固定的用语和格式是考生们在考前可以进行速记和运用的。
在此给大家推荐全国知名考研英语辅导老师谭剑波的《考研英语(二)写作考前冲刺万用魔板》,相信会对大家有很大的帮助。
1.Crucial a.关键的;重要的
【单词记忆】词根cruc-来自cross(元音互换,c=s发音相同),-ial 形容词后缀。
Cross本意为“穿过”,也可表示“十字路口”,十字路口是一个很重要的转折点,因此用cross创造出crucial表示“重要”。
【同义替换】critical
【写作例句】doing sth. is crucial to doing sth.如Reading more books is crucial to accumulating knowledge.多读书对知识积累很重要。
2.Significant a.重要的
【单词记忆】sign“记号”,i无意,词根-fic“作”,-ant形容词后缀。
我们在读书的时候,总在重要的地方做记号,因此“做记号”表示“重要的”。
【同义替换】important
【写作例句】sth. is significant 或sth. is of great significance /importance某事想当重要
这本书针对图表作文进行了概述、题型讲解、万用魔板、范文点评和命题预测等五大方面的详细叙述,帮助考生一举拿下图表作文,除此之外,为了在短时间内提高大家的知识储备量,书中还附有图表作文高频核心100词、低端词汇的高端替换和图表作文的常用表达等,非常有用。
最后预祝大家考研顺利,加油!。
考研英语图表作文重点词汇
考研英语图表作文重点词汇
来源:文都图书
参加考研英语要考英语二的同学们应该知道,由于考研英语二的写作部分考查的有图表作文,所以考生们在备考时最好多多积累一些图标作文常用词汇,图表作文绝大部分比较重数据,所以表示趋势类的词汇是重点。
增加:increase,rise(可作名词),go up,climb,ascend rocket(暴增),grow up,jump up,surge,shoot up,keep an upward tendency 减少:decrease,drop,come down,slide,decline,plunge(暴减),go down,fall down,sink,dip,keep a downward tendency
变化,变动:fluctuate,change,shift
保持稳定:remain the same,stabilize,remain stable,remain constant
百分比:a small percentage of...(X%),a quarter of ...,the minority of...(X%)(小部分),half of...,the majority of...(X%),most of...(X%),one-fifth of...
记住这些单词利于大家在写作文时有更多的表达方式可以选择,分分钟让自己的作文更“亮眼”!推荐大家看看《考研英语写作高分攻略》,这是一本专门针对考研英语写作题编撰的参考书,可以全方位帮助考生们提高自己的应试技能。
先预祝大家考研顺利,在备考时期保持积极向上的心态,规律的饮食起居等,充满信心迎战考试!加油!。
- 1、下载文档前请自行甄别文档内容的完整性,平台不提供额外的编辑、内容补充、找答案等附加服务。
- 2、"仅部分预览"的文档,不可在线预览部分如存在完整性等问题,可反馈申请退款(可完整预览的文档不适用该条件!)。
- 3、如文档侵犯您的权益,请联系客服反馈,我们会尽快为您处理(人工客服工作时间:9:00-18:30)。
考研英语二图表类作文常用描述词汇及表达本文汇总了考研英语二大作文图表类作文写作中描述词汇、词组及句型常用表达的相关内容,帮助大家在考研英语作文中拿到高分。
图表描述词汇、词组及句型常用表达
基本要素
类型:
table, chart, diagram/graph, column chart, pie graph
描述:
show, describe, illustrate, reveal, represent, can be seen from, clear, apparent
内容:
figure, statistic, number, percentage, proportion
表示数据变化的单词或者词组–动词
(1) 起伏、波动
rise and fall, fluctuate, wave, undulate, rebound, recover
(2) 高、低点值
peak, reach a (high) peak/point,reach the bottom, reach a low point
(3) 增加、上升、提高
increase, grow, rise, climb, expand, ascend, skyrocket, soar
(4) 减少、下降
decrease, decline, fall, drop, descend, diminish, slide, shrink, collapse 形容词或副词
(1)变化巨大
迅速的,飞快的,rapid/rapidly
戏剧性的,生动的dramatic/dramatically
有意义的,重大的significant/significantly
锐利的,明显的sharp/sharply
急剧升降的steep/steeply
(2)变化平缓
稳固的,坚定不移的steady/steadily
渐进的,逐渐的gradual/gradually
缓慢的,不活跃的slow/slowly
轻微的、略微地slight/slightly
稳定的stable/stably
英语图表写作套句推荐
图表的总体描述
1.The table shows the changes in the number of……over the period from……to……
2.The data/statistics/figures lead us to the conclusion that……
3.As can be seen from the diagram, great changes have taken place in……/ the two curves show the fluctuation of……
4.From the table/chart/diagram/figure, we can see clearly that……or it is clear/apparent from the chart that……
5.This is a graph which illustrates……
6.The graph, …presented in a pie chart, shows the general trend in……
7.This is a column chart showing……
时间段表达方式
1.over the period from…to…the…remained level.
2.in the year between……and……
3.in the 3 years spanning from 1995 through 1998……
4.from then on/from this time onwards……
数据变化表达方式
表示上升趋势的句型:
1.the number sharply went up to……
2.the figures peaked at……in(month/year)
3.the situation reached a peak(a high point at) of[%].
4.a increased by……
5.a increased to……
6.there is an upward trend in the number of……
7. a considerable increase/decrease occurred from……to……
8.……(year)witnessed/saw a sharp rise in……
表示下降趋势的句型:
1.the figures/situation bottomed out in……
2.the figures reached the bottom/a low point/hit a trough.
3.from……to……the rate of decrease slow down.
4.from this year on,there was a gradual decline/ reduction in the……,reaching a figure of……
表示平稳趋势的句型:
1.the number of……remained steady/stable from (month/year) to (month/year).
2.the percentage of…stayed the same between…and……
3.the percentage remained steady at……
表示比较的句型:
1.the percentage of…is slightly larger/smaller than that of
2.there is not a great deal of difference between……and……
3.…decreased year by year while……increased steadily.
4.there are a lot similarities/differences between……and……
5.a has something in common with b
6.the difference between a and b lies in……
表示倍数的句型:
1.the graphs show a threefold increase in the number of……
2.a is ……times as much/many as b.。