Bulge Globular Clusters in Spiral Galaxies
8星系与宇宙的大尺度结构

~45x109太阳质量
•根据质光关系定M33中发光物质的质量 •太阳的绝对光度:4.8;M33绝对光度:-19.5
•光度差:2.51224.3=~5.2x10⁹
•M33中发光物质的质量: =~5.2x10⁹ 太阳质量, 只有动力学质量的1/10! •进一步的改正:不发光的气体和尘埃,恒星质光 关系的改正,银河系的质光关系:1.5
宽发射线区
Gas clouds moving at several thousand km/sec These appear to be orbital motions (gravity) Gas is photoionized by radiation from the accretion disk and its corona
z
0 0.158 0
活动星系核:高光度
在可见光波段,活动星系核比它的寄主星系要亮 几千倍!
活动星系核:宽的发射谱
Comparable power emitted across ~seven orders of magnitude in photon energy
发射区域:尺度小!
Reverberation Mapping
Measure the time lag in response of BLR clouds to changing ionizing flux from the accretion disk Implied sizes range from light weeks in low power AGN to light years in powerful ones Size plus velocity yield black hole mass
HST Imaging of the Globular Clusters in the Fornax Cluster NGC 1379
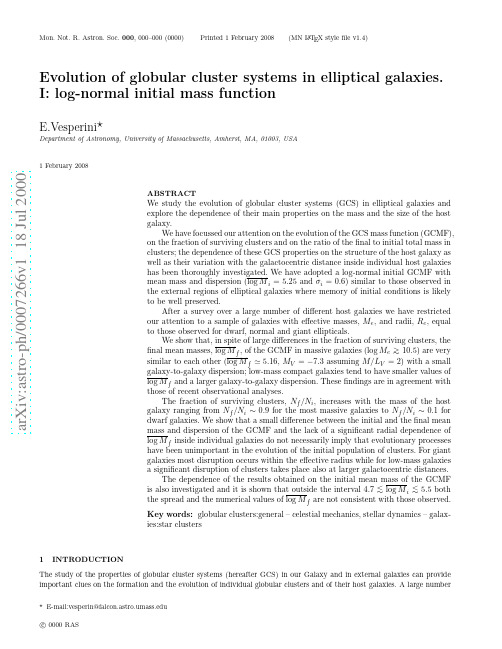
a r X i v :a s t r o -p h /9710041v 1 3 O c t 1997HST Imaging of the Globular Clusters in the Fornax Cluster:NGC 1379Rebecca A.W.ElsonInstitute of Astronomy,Madingley Road,Cambridge CB30HA,UKElectronic mail:elson@ Carl J.Grillmair Jet Propulsion Laboratory,4800Oak Grove Drive,Pasadena,CA 91109USA Electronic mail:carl@ Duncan A.Forbes School of Physics and Astronomy,University of Birmingham,Edgbaston,Birmingham B152TT,UK Electronic mail:forbes@ Mike Rabban Lick Observatory,University of California,Santa Cruz,CA 95064USA Electronic mail:mrabban@ Gerard.M.Williger Goddard Space Flight Center,Greenbelt,MD 20771USA Electronic mail:williger@Jean P.BrodieLick Observatory,University of California,Santa Cruz,CA 95064USAElectronic mail:brodie@ReceivedABSTRACTWe present B and I photometry for∼300globular cluster candidates in NGC1379,anE0galaxy in the Fornax Cluster.Our data are from both Hubble Space Telescope(HST)and ground-based observations.The HST photometry(B only)is essentially complete and free of foreground/background contamination to∼2mag fainter than the peak of the globular cluster luminosity function.Fitting a Gaussian to the luminosity function wefind B =24.95±0.30 andσB=1.55±0.21.We estimate the total number of globular clusters to be436±30.To a radius of70arcsec we derive a moderate specific frequency,S N=3.5±0.4.At radii r∼3−6 kpc the surface density profile of the globular cluster system is indistinguishable from that of the underlying galaxy light.At r∼<2.5kpc the profile of the globular cluster systemflattens, and at r∼<1kpc,the number density appears to decrease.The(B−I)colour distribution of the globular clusters(from ground-based data)is similar to that for Milky Way globulars,once corrected for background contamination.It shows no evidence for bimodality or for the presence of a population with[Fe/H]∼>−0.5.Unlike in the case of larger,centrally located cluster ellipticals,neither mergers nor a multiphase collapse are required to explain the formation of the NGC1379globular cluster system.We stress the importance of corrections for background contamination in ground-based samples of this kind:the area covered by a globular cluster system(with radius∼30kpc)at the distance of the Virgo or Fornax cluster contains∼>200background galaxies unresolved from the ground,with magnitudes comparable to brighter globular clusters at that distance.The colour distribution of these galaxies is strongly peaked slightly bluer than the peak of a typical globular cluster distribution.Such contamination can thus create the impression of skewed colour distributions,or even of bimodality,where none exists.Key words:galaxies:individual:NGC1379-globular clusters:general-galaxies:star clusters1.IntroductionAn accumulating body of observations suggests that the distribution of colours of globular clusters,and by inference of their metallicities,varies significantly from one galaxy to the next.Of particular interest is the colour bimodality which has now been observed in the globular cluster systems of several large elliptical galaxies,and suggests the presence of distinct metal rich and metal poor populations.The best example is the Virgo cD galaxy M87(NGC4486)(cf.Elson&Santiago1996).It has one population of globular clusters with colours similar to those of the Milky Way globulars,and one which is significantly redder,with inferred metallicities∼>solar.Other galaxies whose globular cluster systems show clear bimodality include M49(NGC4472),an E2galaxy in the Virgo Cluster with the same luminosity as M87(Geisler,Lee&Kim 1996),and NGC5846,a slightly less luminous E0galaxy at the centre of a small compact group(Forbes, Brodie&Huchra1997a).Two ideas have been invoked to explain the colour bimodalities.One is that elliptical galaxies are formed during mergers in which populations of metal rich(red)globulars are created and added to a‘native’population of metal poor(blue)clusters(cf.Ashman&Zepf1992).The other is that globular cluster populations with different mean metallicities form during a multiphase collapse of a single system(Forbes, Brodie&Grillmair1997b):metal poor globular clusters are formed early in the collapse,while metal rich ones form later,roughly contemporaneously with the stars.To understand fully the implications of the observed colour distributions for the origin of globular cluster systems,a much larger body of accurate data for systems surrounding galaxies of a variety of types and in a variety of environments is required.A question of particular importance,for example,is whether all elliptical galaxies have bimodal globular cluster systems,or whether such systems are restricted to large galaxies in rich environments.The data best suited to address this question are those acquired with the Hubble Space Telescope(HST).The resolution of HST allows even the crowded central regions of galaxies at the distance of Fornax and Virgo to be probed and allows most background galaxies to be eliminated. At these distances samples of globular clusters are complete and uncontaminated to well past the peak of the luminosity function.This paper and the others in this series are contributions to this growing database. Forbes et al.(1997a)and Grillmair et al.(1997)discuss the globular cluster systems of the Fornax cD galaxy NGC1399,its neighbour the E1galaxy NGC1404,and the peculiar galaxy NGC1316which may have undergone a recent merger.Here we present observations of the globular cluster system of NGC1379, a normal E0galaxy in the Fornax cluster.Hanes&Harris(1986)used photographic data to study the NGC1379globular cluster system toB=23.6(about a magnitude brighter than the peak of the luminosity function).They measured the profile of the outer part of the system(5<r<35kpc),and estimated the total population to number∼800. More recently the globular cluster systems offive galaxies in the Fornax cluster,including NGC1379,have been studied by Kohle et al.(1996)and Kissler-Patig et al.(1997a)using V and I−band photometry obtained with the100-inch telescope at Las Campanas.Their data are50%complete at B∼24,and cover a radial range∼3−10kpc.Our observations,obtained both from the ground at the Cerro Tololo Interamerican Observatory (CTIO),and from space using HST,are described in Section2.Section3presents the results,including a caveat concerning the need for accurate background corrections for ground-based data.Ourfindings are summarized in Section4.2.Observations and Data ReductionIn this section we describe the HST and CTIO images upon which our results are based,and the process for detecting,selecting,and determining magnitudes for the globular cluster candidates in each case.We also discuss completeness,and contamination from foreground stars and background galaxies.At an adopted distance of18.4Mpc(m−M=31.32;Madore et al.1996),1arcsec corresponds to89pc. Reddening in the direction of the Fornax cluster is assumed to be negligible(Bender,Burstein,&Faber 1992).2.1.HST ImagingFive images of NGC1379were obtained with HST on1996March11,using the F450W(∼B)filter. (Due to technical difficulties,the complementary I-band images were not acquired,and are anticipated in 1997.)Three images were taken at one pointing,and two more were offset by0.5arcsec.The total exposure time was5000seconds.The centre of NGC1379was positioned at the centre of the Planetary Camera (PC)chip to afford the greatest resolution in the most crowded regions.Details of the reductions are given by Grillmair et al.(1997).Briefly,the images were reduced using the standard pipeline procedure.TheVISTA routine SNUC was used tofit and subtract the underlying galaxy.We ran DAOPHOT II/ALLSTAR (Stetson1987)separately on the sum of thefirst three images and the last two images,requiring that detections appear in both lists to qualify as real objects.We adopted a detection threshold of3σand measured magnitudes byfitting a point-spread function(PSF).Extended objects were eliminated by visual inspection.Count rates were converted to B magnitudes using the gain ratios and zeropoints given by Holtzman et al.(1995;1997,private communication).Photometry is available on request from CJG.Figure1shows a mosaic of the four WFPC2chips,with the galaxy subtracted.The total area of the field,excluding two60pixel wide unexposed borders on each chip,is4.8arcmin2.The scale of the Wide Field Camera(WFC)is0.0996arcsec pixel−1,and of the PC,0.0455arcsec pixel−1.At the distance of NGC1379,one WFC pixel corresponds to∼9pc and one PC pixel to∼4pc.A globular cluster with size typical of those in the Milky Way(core radius∼2pc,half-mass radius∼10pc,and tidal radius∼50pc) will thus appear essentially unresolved in our images.A total of∼300objects were detected and measured in ourfield.To determine the completeness of this sample,3000artificial PSFs(100at each of30magnitude levels)were added to the images,and the images were then processed in a manner identical to that for the original data.The completeness of the sample as a function of magnitude is shown in Figure2.The sample is∼100%complete to B=26for the WFC chips(80%of the sample),and to B=25.5for the PC chip.At B>26the completeness begins to drop rapidly.Photometric errors areδB≈0.10mag at B∼<25,rising to0.15mag at B=26.Next we consider the extent to which our sample may be contaminated by foreground stars and background galaxies.Few foreground stars are expected in an area of only4.8arcmin2at this Galactic latitude,and most background galaxies are resolved and thus easily distinguished from globular clusters. The main source of contamination is compact,spherical background galaxies.To determine the expected level of contamination in our sample,we observed a backgroundfield located∼1.4degrees south of the center of the Fornax cluster.The exposure time was5200seconds,so the limit of detection is comparable to that for the NGC1379sample.The image was processed and the sample selected in the same way as for the NGC1379field(see Grillmair et al.1997).Figure3shows a colour-magnitude diagram(CMD)for the84unresolved objects detected in the backgroundfield.The sample becomes incomplete at B>26.5,but as we shall see,this is∼1.5magnitudes fainter than the peak of the luminosity function,and so will not affect our results.At B∼<26.5the objects have a wide range of colours,with the majority concentrated around(B−I)∼1.The B luminosityfunction for the background sample is plotted in Fig.4,which also shows the luminosity function for the ∼300candidate globular clusters.The background luminosity function is tabulated in Table1.Since these background number counts are applicable to HST studies of any unresolved population at high latitude, we also include in Table1the I-band luminosity function for the backgroundfield.This is plotted as the solid histogram in Fig. 5.As a check on the consistency of the sample,and to assess the amplitude of spatialfluctuations in the background on this scale,we compared the luminosity function in Fig.5with the Medium Deep Survey(MDS)star count data from17high latitudefields obtained with HST in the V and I bands(Santiago,Gilmore&Elson1996).The dotted histogram in Fig.5shows the I-band luminosity function for the MDS data,normalized to an area of4.8arcmin2.The two distributions are in excellent agreement to I≈23.5which is the limiting magitude of the MDS star count data.Fainter than this stars can no longer be reliably distinguished from compact galaxies.The MDS stellar luminosity function in V, normalized to the same area,is also included in Table1.Finally,Fig.5also shows a luminosity function for stars and galaxies from the Canada-France Redshift Survey(CFRS)(Lilly et al.1995;S.Lilly1997,private communication).The magnitudes were measured in an aperture of diameter3arcsec.The I-band data cover an effective area of∼425arcmin2,and have again been normalized to an area of4.8arcmin2.These data illustrate the much larger degree of background contamination to be expected in the extreme case where no galaxies(with I∼>21)can be distinguished morphologically from unresolved objects.Background contamination in typical ground-based samples of globular clusters in distant galaxies will fall somewhere between the CFRS and the HST histograms.2.2.Ground–based ImagingBroadband B and I images of NGC1379were taken with the CTIO1.5m telescope,using a Tek2048 x2048array with a pixel scale of0.44arcsec pixel−1.Total exposure times were9000and3900seconds for the B and I images respectively.Although the seeing was only∼1.5arcsec,conditions remained photometric throughout the night of1995December24.Reduction was carried out in the standard way(i.e. bias and dark subtraction,flat–fielding and sky subtraction).After combining,the images were calibrated using aperture photometry from the catalogs of of Longo&de Vaucouleurs(1983)and de Vaucouleurs& Longo(1988).This procedure gave an rms precision of better than0.05mag.For the selection of globular cluster candidates in the CTIO images,we employed an iterative procedure using DAOPHOT II.We measured the background noise in both images and set the threshold for singlepixel detection at5σ,i.e.five times the noise due to the background.The other important detection parameters,SHARPness and ROUNDness(designed to weed out extended objects and cosmic rays),were initially given a large range.For each detected object we measured a3pixel radius aperture magnitude and applied an aperture correction based on a curve-of-growth analysis for a dozen isolated globular clusters. The rms error in the aperture correction is∼0.05mag.We then compared our B-band candidate list with the positions and B magnitudes of globular clusters detected with HST’s WFC.Our candidate list was matched to the HST list with the condition that the HST globular cluster lie within3CTIO pixels of our object.With this condition,28objects were matched. The average magnitude difference between the CTIO and HST B magnitude is0.03mag.Such excellent agreement is gratifying from a photometric standpoint,and reassures us that we have matched the data sets correctly.The matched clusters have SHARPness parameters0.3to0.7and ROUNDness−0.4to0.4. Assuming that these globular clusters are representative of all globular clusters in the CTIO image,we re–ran DAOPHOT II with the new restricted range in SHARPness and ROUNDness parameters.This resulted in the exclusion of about half the objects in the original sample,which are presumably background galaxies.The same parameters were used for both the B and I images.Figure6shows a CMD for365 objects selected in this way.A comparison of the CTIO object list and the HST list,within the area in common,will also indicate how complete our detection is as a function of magnitude.The completeness function estimated this way is shown in Fig.7.Our sample is∼100%complete at B∼21and∼50%complete at B∼23.5.The photometric errors are<0.1mag for all magnitudes brighter than our50%completeness limit.At this point it is necessary to investigate the level of contamination of our ground-based sample by foreground stars and background galaxies.Since thefield is much larger than that observed with HST(211 arcmin2compared to4.8arcmin2),and since the resolution is not sufficient to distinguish many background galaxies from unresolved sources,contamination from both stars and galaxies will be significant.Since no background comparisonfield was obtained,we rely instead on the CFRS data in the B and I-bands, discussed above,to estimate a correction for contamination.Figure8shows histograms of(B−I)for the full NGC1379sample in Fig.6,and for the CFRS sample of objects with19<B<23.Since selection effects in the two samples are different,we do not normalize the CFRS sample directly using the known area of the survey.Rather,we normalize it to match the tail of objects with(B−I)>2.5in Fig.8,whose colours are too red to be globular clusters.From this wecan infer the relative number of contaminants with(B−I)<2.5.The CFRS sample is strongly peaked at (B−I)∼1.0,which is just∼0.4mag bluer than the peak of the NGC1379sample.The NGC1379sample is lacking many of the bluest objects in the CFRS sample;this is probably because fainter galaxies are on average bluer,and the CFRS sample is much more complete than the NGC1379sample at the faintest magnitudes.Also,our process of excluding galaxies from the CTIO sample on the basis of ROUNDness would preferentially eliminate edge-on spirals,which are systematically bluer than ellipticals.The most important point illustrated by Fig.8is that in the ground-based data,much more so than in the HST data,failure to properly correct for foreground/background contamination may lead to a significant error in the deduced colour of the peak of the globular cluster colour distribution,and possibly to the erroneous impression of a bimodal colour distribution.With ground-based data obtained with better seeing it would of course be possible to exclude a greater proportion of background galaxies,so that any skewing of the colour distribution would be less severe.3.Properties of the NGC1379globular cluster systemThe principal properties of a globular cluster system which any theory of its origin and evolution must account for are the luminosity function(in particular,the absolute magnitude of its peak,and the width of the distribution),the colour distribution(in particular,the colour of the peak and the presence or absence of any bimodality),the radial distribution,and the total number of clusters,N tot,and therefore the specific frequency,defined as S N=N tot100.4(M V+15),where M V is the absolute magnitude of the galaxy.With B tot=12.07(Tully1988)and(B−V)=0.89(Faber et al.1989)we infer an apparent magnitude for NGC 1379of V tot=11.18.With distance modulus31.32,this implies M V=−20.16.This is the integrated magnitude within a radius of∼70arcsec.3.1.Luminosity functionThe luminosity function for the NGC1379globular cluster candidates derived from the HST datais shown in Fig. 4.This sample includes∼300unresolved objects and is essentially complete and uncontaminated well past the peak.The background-corrected luminosity function,that is,the differencebetween the solid and dashed histograms in Fig.4,is shown in Fig.9.Fitting a Gaussian function to the luminosity function in Fig.4,using a maximum-likelihood technique which is independent of binning, and takes into account completeness,background contamination,and photometric errors(Secker&Harris 1993),we derive a peak magnitude of B =24.95±0.30,and a widthσB=1.55±0.21.This Gaussian is shown as the solid curve in Fig.9.We know of no other direct measurements of B for this system to compare with ours.However,our values are the same,to within the errors,as the values measured for the globular cluster systems of two other Fornax galaxies,NGC1399and NGC1404(Grillmair et al.1997).Also,for four elliptical galaxies in the Virgo cluster Harris et al.(1991)find an average value B =24.77±bining this with the value(m−M)F ornax−(m−M)V irgo=0.08±0.09(Kohle et al.1996)implies B =24.85±0.22for NGC 1379.This is in good agreement with our value.We may either use the measured peak magnitude to infer a distance modulus for NGC1379,assuming a‘universal’value for the absolute magnitude of the peak,or we may adopt a distance modulus and infer an absolute magnitude.While the value of M V has been measured for many globular cluster systems, there are fewer B−band studies.Sandage&Tamman(1995)quote M B =−6.93±0.08for the Milky Way and M31globular clusters,while Ashman,Conti&Zepf(1995)give M B =−6.50for the Milky Way clusters.Adopting the Cepheid distance for NGC1379and our measured peak magnitude,implies M B =−6.37±0.36,which is in good agreement with the Ashman et al.value and somewhat fainter than the Sandage&Tamman value.As we shall see below,the(B−I)distribution of NGC1379globular clusters appears very similar to that for the Milky Way globular clusters.It should therefore be safe to assume that the(B−V)distribution is also similar.Adopting B−V =0.7for the Milky Way globulars(Harris1996),we may convert our value for the peak magnitude of the luminosity function, B =24.95±0.30,to V =24.25±0.30.This value is somewhat fainter than the value found by Kohle et al.(1996)of V =23.68±0.28,but their data reach just to the peak of the luminosity function,and the errors in their faintest bin are large.The sense of the difference is consistent with our result above thatfitting only the brighter part of the luminosity function results in a peak magnitude which is too bright.With the Cepheid distance modulus of31.32,our V value implies M V =−7.07±0.36,which is typical for elliptical galaxies of this absolute magnitude (Harris1991).Our value ofσB=1.55±0.21for the NGC1379globular cluster system is larger than the valuesσB=1.07and0.89quoted by Sandage&Tamman for the Milky Way and M31respectively,but is consistent with the valuesσB=1.37±0.07andσB=1.39±0.12found by Grillmair et al.(1997)for the globular cluster systems of NGC1399and NGC1404respectively.It is also consistent with the value σB=1.46±0.07for four elliptical galaxies in the Virgo cluster(Harris et al.1991).3.2.Radial profileHarris&Hanes(1987)compared the radial profile of the NGC1379globular cluster system with the surface brightness profile of the galaxy itself from Schombert(1986),over the radial range5−35kpc. They detected no difference between the two,although their uncertainties were large.Kissler-Patig et al. (1997a)found the same result from their ground-based data over the range3−10kpc.Radial surface density profiles for our HST sample of NGC1379globulars are shown in Figs.10a and b.Corrections have been made to compensate for the fraction of each annulus which falls outside thefield of view of the WFPC2.In Figure10a profiles are plotted for both the complete,uncontaminated sample with B<25.5, and for the objects with B>26.5(with no correction for completeness),which are expected to be primarily background galaxies.Indeed,the fainter sample shows almost no radial gradient.The dashed line is the background level(∼9.0objects per arcmin2)measured from the backgroundfield for B>26.5.The agreement is excellent.The background level for the brighter sample,again measured from the background field,is2.7objects per arcmin2,and is shown as the solid line.The difference between the radial profile and the background level is probably due to small numbers,but may indicate a small amount of residual contamination:thefive outermost points represent an average of<4objects each,and the total number of objects in the backgroundfield with B<25.5is just13.The radial profile of the brighter sample decreases smoothly from∼10−80arcsec(∼1−7kpc),at which point the globular cluster system is lost in the background.Figure10b shows the radial profile for the sample with B<25.5,with a background of2.7objects per arcmin2subtracted.Superposed is a curve representing the surface brightness profile of the underlying galaxy from Kissler-Patig et al.(1997a),scaled arbitrarily to match the profile of the globular cluster system.The two profiles agree well at∼35−70 arcsec(3–6kpc).There is no evidence that the surface brightness profile of the globular cluster system is shallower than that of the underlying galaxy light out at least to the limit of our data at r∼7kpc.The logarithmic slope of the profile in Fig.10b is−2.4at r∼>35arcsec.Inwards of r∼30arcsec(∼2.5kpc)the profile of the globular cluster systemflattens out.This core structure seems to be a common feature of the globular cluster systems of elliptical galaxies,and the radius at which theflattening occurs correlates with the galaxy luminosity(Forbes et al.1996).The mean surface density within∼10arcsec of the centre of NGC1379is∼200±60clusters per arcmin2.The core radius, where the surface density has fallen to half its central value,is r c∼23±6arcsec(2.0±0.5kpc).This is consistent with values for other galaxies with absolute magnitude comparable to that of NGC1379.Such a core structure is not present in the underlying galaxy light,which,while it changes slope slightly at r∼50 arcsec,rises with constant slope inwards to at least10arcsec(Schombert1986).Inwards of∼10arcsec(∼1kpc),the surface density of globular clusters appears to decrease.This radius corresponds to220pixels on the PC,and as can be seen from Fig.1,crowding even in these inner regions is not severe.Extrapolating a smoothly rising profile to the center of the galaxy would require6 clusters instead of2in the innermost bin,and14instead of12in the second bin.If the radial distribution really were steadily rising,this would imply that our data are only∼70%complete in these combined bins. Closer analysis of our completeness tests reveals that we are in fact97%complete for B<25.5in the region r<220pixels(the slight reduction over the PC-averaged completeness value being a consequence of the increased noise due to the integrated stellar light of the central regions of the galaxy).We conclude that the central dip in the cluster surface density distribution is not an artifact of our analysis,and may indeed indicate a quite substantial drop in the volume density of clusters near the nucleus of the galaxy.Radii less than1kpc from the nucleus are where we expect tidal stresses to begin to take a toll on the numbers of globular clusters(Lauer&Kormendy1986,Grillmair,Pritchet,&van den Bergh1986),either during their formation or subsequently through tidal stripping(Grillmair et al.1995),particularly if the clusters are on box orbits.We now turn to the ground-based data which cover a much greater area than the HST data.The radial distribution for the full sample from Fig.6is shown in Fig.11.The surface density for the CTIO sample has been increased by0.74in log N to match the HST sample,which is shown as the solid curve.At r∼>100arcsec,the profile of the CTIO sample is essentiallyflat,suggesting that the sample is composed overwhelmingly of foreground/background objects at these radii.Even a colour selection is unlikely to help disentangle the background contamination since,as shown in Fig.8,background galaxies have a similar colour distribution to the full NGC1379sample.We therefore conclude that,despite the larger spatial coverage of the ground-based sample,in the absence of a suitable background calibrationfield it does not contribute much to our knowledge of the radial structure of the NGC1379globular cluster system notcovered by our HST data.It is also unable to probe the innermost regions of the cluster system,due to crowding.3.3.Colour distributionIn the absence of an I-band image from HST,we attempt to extract a sample of globular clusters from the ground-based data which is as uncontaminated as possible,to investigate the(B−I)colour distribution.One approach is to select only objects with r<100arcsec,since these show a radial gradient in surface density(Fig.11).This gives a sub-sample of35objects.The background level inferred from the radial distribution of the CTIO sample at r>100arcsec is1.6arcmin−2,implying that14of the35 globular cluster candidates at r<100arcsec,or40%of this sample,are background galaxies or foreground stars.The colour distribution for the35objects at r<100arcsec,along with those for the full CTIO sample and for the CFRS sample,is shown as the dashed histogram in Fig.8.The r<100arcsec sample clearly peaks at a redder colour than the full sample,underlining the fact that the colour distribution of the uncorrected sample is misleading.Figure12shows the same histogram for the r<100arcsec sample,along with the histogram of residuals obtained by subtracting the normalized CFRS histogram from the full CTIO histogram in Fig.8.A histogram for95globular clusters in the Milky Way(Harris1996)is also shown.The colour distributions of the NGC1379sample with r<100arcsec,and with the CFRS sample subtracted,have a very similar peak colour,(B−I)≈1.6,which is indistinguishable from that for the globular cluster system of the Milky Way.Using the relation between(B−I)colour and metallicity from(Couture et al.1990)we infer from the peak colour a metallicity of[Fe/H]∼−1.5.Forbes et al.(1997b)plot a relation between mean metallicity of globular clusters and parent galaxy magnitude for11galaxies with−21<M V<23,with bimodal globular cluster colour distributions.Theyfind that,while in the metal rich populations([Fe/H]>−0.5)there is a strong correlation between mean globular cluster metallicity and galaxy magnitude,for the metal poor populations the scatter is much greater and the correlation much weaker.There is,however,a trend for less luminous galaxies to have globular clusters with a lower mean metallicity,and our results for NGC1379are consistent with this trend.There is a tail of bluer objects in the NGC1379samples which is probably comprised of residual。
Evolution of globular cluster systems in elliptical galaxies. I. Log-normal initial mass fu
ห้องสมุดไป่ตู้
1 INTRODUCTION The study of the properties of globular cluster systems (hereafter GCS) in our Galaxy and in external galaxies can provide important clues on the formation and the evolution of individual globular clusters and of their host galaxies. A large number
Mon. Not. R. Astron. Soc. 000, 000–000 (0000)
Printed 1 February 2008 (MN LATEX style file v1.4)
arXiv:astro-ph/0007266v1 18 Jul 2000
Evolution of globular cluster systems in elliptical galaxies. I: log-normal initial mass function
We have focussed our attention on the evolution of the GCS mass function (GCMF), on the fraction of surviving clusters and on the ratio of the final to initial total mass in clusters; the dependence of these GCS properties on the structure of the host galaxy as well as their variation with the galactocentric distance inside individual host galaxies has been thoroughly investigated. We have adopted a log-normal initial GCMF with mean mass and dispersion (log M i = 5.25 and σi = 0.6) similar to those observed in the external regions of elliptical galaxies where memory of initial conditions is likely to be well preserved.
剑桥商务英语听说 星系
剑桥商务英语听说星系The Milky Way GalaxyThe Milky Way is the galaxy that contains our Solar System, with the Earth and Sun. This galaxy is a vast, spinning collection of stars, planets, dust and gas, held together by gravity. It is just one of hundreds of billions of galaxies in the observable universe.The Milky Way galaxy is estimated to contain 100-400 billion stars and have a diameter between 100,000 and 180,000 light-years. It is the second-largest galaxy in the Local Group, with the Andromeda Galaxy being larger. As with other spiral galaxies, the Milky Way has a central bulge surrounded by a rotating disk of gas, dust and stars. This disk is approximately 13 billion years old and contains population I and population II stars.The solar system is located about 25,000 to 28,000 light-years from the galactic center, on the inner edge of one of the spiral-shaped concentrations of gas and dust called the Orion Arm. The stars in the Milky Way appear to form several distinct components including the bulge, the disk, and the halo. These components are made of different types of stars, and differ in their ages and their chemicalabundances.The Milky Way galaxy is part of the Local Group, a group of more than 50 galaxies, including the Andromeda Galaxy and several dwarf galaxies. The Local Group in turn is part of the Virgo Supercluster, a giant structure of thousands of galaxies. The Milky Way and Andromeda Galaxy are moving towards each other and are expected to collide in about 4.5 billion years, although the likelihood of any actual collisions between the stars themselves is negligible.The Milky Way has several major arms that spiral from the galactic bulge, as well as minor spurs. The best known are the Perseus Arm and the Sagittarius Arm. The Sun and its solar system are located between two of these spiral arms, known as the Local Bubble. There are believed to be four major spiral arms, as well as several smaller segments of spiral arms.The nature of the Milky Way's bar and spiral structure is still a matter of active research, with the latest research contradicting the previous theories. The Milky Way may have a prominent central bar structure, and its shape may be best described as a barred spiral galaxy. The disk of the Milky Way has a diameter of about 100,000 light-years. The galactic halo is a spherical component of the galaxy that extends outward from the galactic disk, as far as 200,000 light-years from the galactic center.The disk of the Milky Way Galaxy is marked by the presence of a supermassive black hole known as Sagittarius A*, which is located at the very center of the Galaxy. This black hole has a mass four million times greater than the mass of the Sun. The Milky Way's bar is thought to be about 27,000 light-years long and may be made up of older red stars.The Milky Way is moving with respect to the cosmic microwave background radiation in the direction of the constellation Hydra with a speed of 552 ± 6 km/s. The Milky Way is a spiral galaxy that has undergone major mergers with several smaller galaxies in its distant past. This is evidenced by studies of the stellar halo, which contains globular clusters and streams of stars that were torn from those smaller galaxies.The Milky Way is estimated to contain 100–400 billion stars. Most stars are within the disk and bulge, while the galactic halo is sparsely populated with stars and globular clusters. A 2016 study by the Sloan Digital Sky Survey suggested that the number is likely to be close to the lower end of that estimate, at 100–140 billion stars.The Milky Way has several components: a disk, in which the Sun and its planetary system are located; a central bulge; and a halo of stars, globular clusters, and diffuse gas. The disk is the brightest part of theMilky Way, as seen from Earth. It has a spiral structure with dusty arms. The disk is about 100,000 light-years in diameter and about 13 billion years old. It contains the young and relatively bright population I stars, as well as intermediate-age and old stars of population II.The galactic bulge is a tightly packed group of mostly old stars in the center of the Milky Way. It is estimated to contain tens of billions of stars and has a diameter of about 10,000 light-years. The Milky Way's central bulge is shaped like a box or peanut. The galactic center, which lies within this bulge, is an extremely active region, with intense radio source known as Sagittarius A*, which is likely to be a supermassive black hole.The Milky Way's halo is a spherical component of the galaxy that extends outward from the galactic disk, as far as 200,000 light-years from the galactic center. It is relatively sparse, with only about one star per cubic parsec on average. The halo contains old population II stars, as well as extremely old globular clusters.The Milky Way's spiral structure is uncertain, and there is currently no consensus on the nature of the Milky Way's spiral arms. Different studies have led to different results, and it is unclear whether the Milky Way has two, four, or more spiral arms. The Milky Way's spiral structure is thought to be a major feature of its disk, and it may berelated to the generation of interstellar matter and star formation.The Milky Way's spiral arms are regions of the disk in which the density of stars, interstellar gas, and dust is slightly higher than average. The arms are thought to be density waves that spiral around the galactic center. As material enters an arm, the increased density causes the material to accumulate, thus causing star formation. As the material leaves the arm, star formation decreases.The Milky Way's spiral arms were first identified in the 1950s, when radio astronomers mapped the distribution of gas in the Milky Way and found that it was concentrated in spiral patterns. Since then, astronomers have used a variety of techniques to study the Milky Way's spiral structure, including observations of the distribution of young stars, star-forming regions, and interstellar gas and dust.One of the key challenges in studying the Milky Way's spiral structure is that we are located within the disk of the galaxy, which makes it difficult to get a clear view of the overall structure. Astronomers have had to rely on indirect methods, such as measuring the distances and motions of stars and gas clouds, to infer the shape and structure of the galaxy.Despite these challenges, our understanding of the Milky Way's spiral structure has advanced significantly in recent years, thanks tonew observations and more sophisticated modeling techniques. Ongoing research is continuing to shed light on the nature and evolution of the Milky Way's spiral arms, and the role they play in the overall structure and dynamics of the galaxy.。
TheMilkyWay“MilkyWay”-SFSUPhysics…

The Milky WayMilky Way probably looks likeAndromeda.The band of light we see is really 100 billion starsMilky WayBefore the 1920’s, astronomers used a “__________model” for the galaxyTried to estimate our location in the galaxy by counting stars in different __________Because some stars are _______ by dust, the true shape of this group of stars was unclear.A Globular ClusterFinding the Centerthe Solar System.The Milky WayParts of OurGalaxyDisk: The ____ Resides in theNuclear Bulge: The dense_______ regionHalo: Spherical regionsurrounding the disk where the_______ ________ live.Questions:How big is the Milky Way?Where are stars forming (or not forming)?How much mass is in the Milky Way?What’s going on at the center?so stars are still forming Car Headlights are standard candles:We use them to determine the car’s distanceHenrietta Leavitt Cepheid stars change in brightness. They pulsate in a very regular way. Large, bright Cepheids pulsate_____, while small, dim Cepheids pulsate _______.Milky Way Galaxy, we map out its structureA modern map of the Milky WayMeasuring the Mass of the Milky WayWe use the Sun’s ______around the center of the MilkyWayThe greater the mass insidethe orbit, the ______ the Sunhas move around the center.This way we can measure themass of the Milky Way.Total mass: about ___ _______ MThe Center of the Milky Wayat the center of the galaxy!Chapter 13Galaxies____)M 100NGC 300Less gas and dustAre generally ______ than spirals and ellipticals_______ Galaxies (E): Classified according to shape (E0-E9)_______ GalaxiesA Barred Spiral Galaxy with only 2 arms.Candles••Supernova in galaxy NGC4526 (HST Image)Hubble’s Original DataHubble Law/ Hd = vrClassifying Galaxies Lecture Tutorial: Page 127•Work with a partner or two•Read directions and answer all questions carefully. Take time to understand it now!•Discuss each question and come to a consensus answer you all agree on before moving on to the next question.•If you get stuck, ask another group for help.•If you get really stuck, raise your hand and I will come around.。
The Globular Cluster System of NGC4374

a r X i v :a s t r o -p h /0311188v 1 7 N o v 2003Astronomy &Astrophysics manuscript no.h4350February 2,2008(DOI:will be inserted by hand later)The Globular Cluster System of NGC 4374M.G´o mez 1and T.Richtler 21Depto.Astronom´ıa y Astrof´ısica,P.Universidad Cat´o lica de Chile,Casilla 306,Santiago 22,Chilee-mail:mgomez@astro.puc.cl 2Grupo de Astronom´ıa,Departamento de F´ısica,Universidad de Concepci´o n,Casilla 160-C,Concepci´o n,Chile e-mail:tom@coma.cfm.udec.clReceived /AcceptedAbstract.We study the globular cluster system (GCS)of the giant elliptical NGC 4374(M84)in the Virgo cluster using Band R photometry.The colour distribution is bimodal with peaks at B-R =1.11and B-R =1.36,fitting well to those found in other early-type galaxies.The radial profile of the cluster number density is flatter than the galaxy ing the luminosity function we derive a distance modulus of µ=31.61±0.2,which within the uncertainty agrees with the distance from surface brightness fluctuations.Blue and red clusters show similar radial concentrations and azimuthal distributions.The total number of clusters is N =1775±150,which together with our distance modulus leads to a specific frequency of S N =1.6±0.3.This value is surprisingly low for a giant elliptical,but resembles the case of merger remnants like NGC 1316,where the low specific frequency is probably caused by the luminosity contribution of an intermediate-age population.A further common property is the high rate of type Ia supernovae which also may indicate the existence of a younger population.However,unlike in the case of NGC 1316,one cannot find any further evidence that NGC 4374indeed hosts younger populations.The low specific frequency would also fit to a S0galaxy seen face-on.Key words.galaxies:distances and redshifts –galaxies:elliptical and lenticular,cD –galaxies:individual:NGC 4374–galax-ies:interactions –galaxies:star clusters1.IntroductionThe study of globular clusters in early type galaxies has reached a state,where surprises have become rare when only individual galaxies are studied.Progress in understanding the relation be-tween the morphology (i.e.the specific frequency of clusters,their spatial as well as their colour distribution)of a GCS and the host galaxy properties normally emerges from analyzing larger galaxy samples (e.g.Kundu &Whitmore 2001;Larsen et al.2001)However,from time to time,one encounters galax-ies which exhibit some peculiarity in their GCS,which one would like to understand in a more general framework.For example,it is well known that “normal”elliptical galaxies have specific frequencies higher than about 3(see Sect.3.6for the definition and Elmegreen 1999for a review of specific frequencies).NGC 1316,the brightest galaxy in the Fornax cluster,has nevertheless a low specific frequency of only ∼0.9(Grillmair et al.1999;G´o mez et al.2001).Since it is known as a merger remnant,it is tempting to seek an ex-planation not in the low number of globular clusters,but in the high luminosity due to the presence of an intermediate-age stellar population which formed in the merger a few Gyrs ago.Indeed,Goudfrooij et al.(2001),by means of spectroscopy of the brightest clusters,identified several intermediate-ageglob-2M.G´o mez and T.Richtler:The Globular Cluster System of NGC 4374NEFig.1.The observedfields in the three nights.NGC4374is at the center.The bright elliptical at the left is NGC4406(M86). Table1.The details of the observations.See Fig.1for the ori-entation of thefields.nightfield B R2.Observations,reductions and photometry2.1.ObservationsThe observations were carried out at the 3.5m telescope at Calar Alto,Spain,run by the Max-Planck Institute for Astronomy,Heidelberg.The observation period was19to21 March,1999.The instrument was the focal reducer MOSCA (www.caha.es/CAHA/Instruments/MOSCA/index.html) equipped with a Loral2K x2K CCD.The pixel scale was0.513”/pix and the usable unvignettedfield of view∼13′x13′(1.5K x1.5K).Thefilters in use were Johnson B and R.In thefirst night several frames,centered on NGC4374,were acquired,as well as the Landoltfields SA98,SA101and SA107at different airmasses.The observation log is given in Table1.Two additionalfields were also observed during the second and third night,with an offset of∼8′to the north and south, respectively,as shown in Fig.1.Bias subtraction andflat-fielding were performed using standard IRAF procedures,resulting in aflat-field accuracy of about1%.The images were aligned using the centers of many bright stars as reference points.Bad pixels were replaced by the average of4neighboring pixels.After this,we combined typically5frames with exposure times ranging from400to 600seconds in both B and R.Cosmics were removed by aσ-clipping algorithm.The combined frames show a seeing of1.7”in B and1.5”in R.A medianfilter was then applied to the combined frames to model and subtract the galaxy light.For the photometry,we used DAOPHOT under IRAF. Daofind was run on each of these frames with a detection threshold of3times theσof the sky level.We then performed PSF photometry with allstar.The output lists were matched to leave only objects detected in bothfilters.For these objects we used the stellarity index of SExtractor (Bertin&Arnouts1996)for distinguishing star-like objects from galaxies.The stellarity index ranges between1.0(star-like)and0.0(extended).This classification,however,becomes progressively more uncertain for fainter objects.As we do not resolve globular clusters at the Virgo distance, no light loss due to a different shape of clusters and stars is ob-servable.An aperture correction was applied in the usual way to calibrate our PSF-photometry with that of the standard stars, which were measured using a much larger aperture.2.2.The calibration of the photometryOnly thefirst of3nights was photometric.About40Landolt (1992)standard stars were observed at airmasses from1.0to 1.8,giving a total of∼100datapoints.Their colour range ex-ceeds that of the globular clusters.We then performed aperture photometry with radii from4to30pixels.A curve-of-growth was constructed for each standard,and only stars whose instru-mental magnitudes converged with increasing aperture radius were selected for the calibration.The resulting transformation equations are:b=B+0.874(±0.026)+0.223(±0.021)·X−0.176(±0.021)·(B−R)(1) r=R+0.027(±0.022)+0.096(±0.016)·X+0.046(±0.020)·(B−R)(2) with b,r,B,R the instrumental and standard magnitudes in the B and Rfilter.X is the airmass.The rms of thefit was0.029 and0.027for B and R,respectively.The calibration has been compared with photoelectric aper-ture photometry of NGC4374published by Poulain(1988),us-ingfive aperture sizes.The mean difference was∼0.02mag for each band,without any systematic trend.Local standard stars were then defined in thefield to calibrate the non-photometric nights.We also compared the R magnitudes of the cluster can-didates with about100clusters in common with Ajhar et al. (1994).The mean difference is0.006,with aσof0.085.No trend with magnitude is apparent(Fig.2).Regarding colours, no straightforward comparison is possible.However,we can plot V-I colours of Ajhar et al.versus our B-R colours and ask whether this relation matches the(B-R)-(V-I)relation for galac-tic globular clusters.This is done in Fig.3.The agreement isM.G´o mez and T.Richtler:The Globular Cluster System of NGC 43743202122R−0.4−0.20.20.4∆Rparison of common objects in the photometry of Ajhar et al.(1994)and the present work in the R-band.∆R means the magnitudes quoted by Ajhar et al.minus ours.The mean di fference is 0.006mag with a σof 0.085mag.0.40.60.81 1.2 1.4(V−I)00.811.21.41.61.8(B −R )0Fig.3.Colour comparison of common objects in the VRI pho-tometry of Ajhar et al.(1994)and our BR photometry (filled symbols).We chose the V-I colour because of its widespread use in the photometry of globular cluster systems.Overplotted are galactic globular clusters,where the dereddened colours are taken from the compilation of Harris (1996).There is no obvi-ous o ffset between the clusters of NGC 4374and galactic glob-ular clusters,demonstrating the quality of our B-R colours.quite satisfactory.A few outliers may be caused by photometric errors.2.3.Selection of cluster candidates886objects have simultaneously been detected in the B and R bands.However,a fraction of them might be foreground stars and background galaxies.To statistically select globular clus-ters among them,we have used the following set of criteria:i)B >20.5ii)0.7<B −R <1.8iii)uncertainty(B),uncertainty(B-R)<0.3iv)stellarity index >0.35These criteria arise from the assumption that clus-ters around NGC 4374should resemble the Galactic ones.Regarding the color range,we have used the McMaster data (Harris 1996)and chosen galactic clusters with reddening smaller than E B −V =1.0,resulting in the above colour limits.The colours were de-reddened and the magnitudes extinction-corrected using the maps of Schlegel et al.(1998).We adopt E B −V =0.04,A B =0.173and A R =0.107.In the following,only reddening corrected values appear.pleteness correctionFor the later determination of the globular cluster luminosity function (GCLF)we need to know what fraction of globular clusters is found in each magnitude interval.A common way to evaluate the completeness is to perform artificial star ex-periments.Many artificial “star-like”objects are added to the frames and the detection,photometry and selection procedures are performed in exactly the same way as with the real cluster candidates.The number of recovered and selected objects per magnitude bin,divided by the initial number of artifical clusters gives an estimation of the completeness correction.To get su fficiently good statistics,one needs a large number of artificial objects,but care must be taken not to increase the crowding.Therefore,consecutive tests with a small number of artificial objects are preferred.Using the known PSFs,we added 200artificial clusters in steps of 0.1mag,starting from B =20.0down to B =26.0,and applied the same photometric treatment and selection criteria as we did for the cluster candidates.We expect the completeness to vary with galactocentric distance because of the radially dependent galaxy light back-ground.However,a decrease in the completeness was only noticed for clusters located between radii of 50and 150pix-els (25.′′65and 76.′′95).At larger radii,the completeness cor-rections stays constant with increasing distance.Fig.4(upper panel)gives the resulting completeness in dependence on B-magnitude for a colour of B-R =1.2.We estimated the dependence of the completeness on colour using clusters of colours B-R =0.9,B-R =1.2and B-R =1.5.In all,140000clusters were added for each colour.Fig.4(lower panel)shows that the completeness for red clus-ters is about 0.3mag fainter than for blue ones.This di fference must be taken into account for the calculation of the radial pro-file of red and blue cluster candidates (Sect.3.3).2.5.Background correctionDespite the applied selection criteria,there remain point sources,which may be foreground stars or unresolved back-ground galaxies.The surface density profile levels out at a ra-dial distance of about 500′′(see Fig.11).We therefore have used the outermost parts of the two fields observed during the second and third nights (see Fig.1).That is,two rectangular ar-eas of 12.′8x 4.′3at the top of the upper field and at the bottom4M.G´o mez and T.Richtler:The Globular Cluster System of NGC 437420222426B0.20.40.60.81c o m p l e t e n e s s20222426B0.20.40.60.81c o m p l e t e n e s sFig.4.Top :The completeness for three annuli centred on NGC 4374,as function of the B magnitude,for clusters hav-ing B-R =1.2.The annuli are described by the following inner and outer radii (in pixels):50<r <150,150<r <300and r >300.Only the inner annulus has a noticeable lower completeness.Bottom :The mean completeness (averaged over the three an-nuli),for clusters having colours of B-R =0.9,1.2and 1.5.These are represented by the three solid lines from the left to the right.The shift with colour is evident.The two dashed lines indicate the magnitude at which the mean completeness falls to 0.5for blue (left)and red (right)clusters.The di fference is ∼0.3mag.of the lower field are our background fields.The photometry for these fields was done in the same way as for the central field and it was calibrated using the local standards defined in the overlapping regions.Completeness tests were also run on these two fields.The two background populations were averaged concerning colour distributions,luminosity function and surface density.3.ResultsWe first present the colour-magnitude diagram and the colour distribution of those cluster candidates identified simultane-ously in B and R.After that we study the morphological prop-erties of blue and red candidates separately.In these subsec-0.511.5(B−R)020212223B 020212223Bbackground populationFig.5.The B-R colour-magnitude diagram of cluster candi-dates around NGC 4374(top)and for the background popu-lation (bottom).tions we consider only sources brighter than B =23.8,where the mean completeness is ∼60%(see Fig.4).For deriving the GCLF (Sect.3.5)and the specific fre-quency (S N ),we used only the R frame.The reason for doing so is that we reach more than half a magnitude deeper using the R frames alone,which might be crucial for the detection of the turn-over magnitude (hereafter TOM).We keep the crite-ria regarding magnitude range,photometric error and stellarity index.Completeness and background corrections for the R frames have been performed in the same way as for the combined sam-ple.3.1.The colour-magnitude diagramThe B-R colour-magnitude diagram is shown in Fig.5.In the upper panel,cluster candidates brighter than B =23.8and hav-ing a radial distance less than 500′′are plotted.The lower panel shows the same diagram for the background population in an area which is smaller by a factor 1.3than that for the upper panel.It is apparent that objects bluer than B-R =0.9are mainly foreground /background objects.This is in good agreement with the fact that B-R =0.9is also a limit for the galactic clusters,as can be seen from Fig.3.3.2.Colour distributionThe colour histogram is given in Fig.6.The upper panel shows the colour distribution of all sources having a radial distance less than 500′′(bold line).The dotted line is the backgroundM.G´o mez and T.Richtler:The Globular Cluster System of NGC 43745normalised to the same area.The lower panel shows the colourdistribution for the background corrected sample (solid line).For comparison the B-R distribution of the galactic clusters is shown as well (dashed line),showing those clusters,for which B-R photometry is available and which havereddenings less than 1.0(81clusters from the compilation of Harris 1996).The little peak at B-R =0.85can be a residual from an inappropri-ate background subtraction.Without having further clues,we do not regard these objects to be globular clusters.The galac-tic distribution has the peak at B-R =1.1,qualitatively agree-ing with the blue peak of the NGC 4374clusters.Although the comparison in the red regime is made di fficult by the fact that many metal-rich galactic clusters with higher reddenings are omitted,it seems that the distribution of NGC 4374clusters is more extended to the red and hence presumably to more metal-rich clusters.The appearance of the histogram does not depend much on the bin center which is demonstrated by the dotted curve.This is the sum of the contributions from all clusters,where each one is represented by a Gaussian at the correspond-ing colour.The only parameter is the σof the Gaussian which we choose to be 0.05to match the bin size.There are not many B-R photometries of GCSs available,so a comparison only with 3galaxies,NGC 1380(Kissler-Patig et al.1997),NGC 1199and NGC 6868(da Rocha et al.2002)is principally possible.Unfortunately,in all three cases the colour distribution was not background corrected,which may hamper the comparison.However,the blue peak in these colour distri-bution was found at B-R =1.1in all cases,resembling the galac-tic system and,as we will see,that of NGC 4374.Ajhar et al.(1994)and Gebhardt &Kissler-Patig (1999)re-port V-I photometry for GCs in NGC 4374.Ajhar et al.pointed out a strikingly narrow V-I colour distribution in comparison with other Virgo and Leo ellipticals,but again a more detailed comparison is made di fficult by their small number statistics (moreover,no background subtraction has been attempted).Gebhardt &Kissler-Patig analyse the first 4moments in the V-I colour distribution of a sample of 50GCSs.NGC 4374shows one of the highest skewness parameters in their sample,i.e.its colour distribution is strongly weighted to the red.The general appearance of the colour distribution looks bi-modal.A bimodal colour distribution has been found for many GCSs (e.g.Ashman &Zepf 1992;Larsen et al.2001;Kundu &Whitmore 2001),often interpreted as a signature of two episodes of cluster formation,sometimes in the context of a merger scenario.However,see Dirsch et al.(2003)for the ef-fects of a non-linear colour-metallicity relation.Following a common statistical approach,we performed a KMM-test (Ashman,Bird &Zepf 1994)on the colour distri-bution.This test is applied to the distribution uncorrected for the background population,in both homoscedastic and het-eroscedastic versions.It returns that the colour distribution is best represented by two Gaussians with positions at B-R =1.11(the blue peak)and B-R =1.36(the red peak),and with σ-values of 0.08and 0.13,respectively (heteroscedastic mode).In the homoscedastic case,the peaks are at 1.14and 1.42with σ=0.10.The P-value,which gives the probability of hav-ing a unimodal distribution,is practically zero in both ver-sions,i.e.a unimodal distribution is excluded.Fig.7shows the0.51 1.5(B−R)0204060N 0204060N Fig.6.Top :the B-R colour distribution of cluster candidates around NGC 4374.The bin size is 0.05mag.The thick solid line represents the colours before subtraction of the background population,whose distribution is shown with the dotted line.Bottom :the B-R colour histogram after subtraction of the background population,together with a so-called “generalised histogram”(solid line).This is constructed by placing a gaus-sian in the abscissa at each B-R colour,and then adding the contribution from all gaussians together.The latter is indepen-dent of the bin center,and in our case agrees with the “nor-mal”histogram.The dashed line shows the comparison with the galactic clusters.colour distribution together with the returned Gaussians in the heteroscedastic fit.In all GCSs investigated so far,the peaks exhibit approximately constant colours.Weak dependence on galaxy luminosity has been found for the blue and red peaks by Larsen et al.(2001),while Forbes &Forte (2001)see only a dependence in case of the read peak.As mentioned,also NGC 4374fits to this notion compared with GCSs,for which B-R photometry is available.However,most work has been done in V-I (rsen et al.2001;Kundu &Whitmore 2001)where the peaks are located at V-I =0.95and V-I =1.15.As can be seen from Fig.3,these values fit well to the B-R peak colours quoted above.Is there a colour gradient?Fig.8plots the B-R colour ver-sus the projected distance from the galaxy centre (in logarith-mic scale).The scatter is large,but a slight trend that the clus-ters become bluer at larger radii,may be recognizable.6M.G´o mez and T.Richtler:The Globular Cluster System of NGC 437420406080N 0.51 1.5(B−R)Fig.7.This plot shows the colour distribution of the GCS of NGC 4374(not background corrected)together with the two Gaussians,which best represent the distribution in the sense of a KMM-test.Only clusters redder than 0.925have been in-cluded in the test.110radius (arcmin)0.511.5(B −R )00.511.5(B −R )Fig.8.The colour gradient for cluster candidates brighter thanB =23.8.The upper panel shows the B-R colour of individual clusters vs.the projected distance to the optical center.The B-R colour of the galaxy is shown for comparison (triangles).In the lower panel the mean color in concentric anuli (each 51.′′3wide)is plotted.The error bars are the σin the colour for each bin.The solid lines are the least-square fits.3.3.Blue and Red clustersWe divided the clusters in two subpopulations at B-R =1.25in order to search for possible morphological di fferences between the blue and the red clusters.The resulting counts are given in Table 2,and the radial pro-files of red and blue clusters are shown in Fig.9after the sub-traction of the corresponding red and blue background levels.Red and blue clusters do not significantly di ffer in their radial distributions.They are well represented by:ρ(r )red ∝r −1.22±0.12and ρ(r )blue ∝r −1.00±0.15.100radius (arcsec)110G C /a r e a (a r c m i n−2)500Fig.9.Radial profile of red (open circles)and blue clusters (filled circles),for objects brighter than B =23.8.They are not clearly distinguishable in their concentration.The solid lines are least-square fits.Table 2.The counts for the radial profile of blue and red sub-samples,using both B and R frames.The counts have been corrected for completeness and background contamination.r [′′]area [⊓⊔′]N blue N redTo investigate possible di fferences regarding the azimuthal distribution,we counted the cluster candidates in 12equally-sized sectors,each spanning an angle of 30degrees.The re-gion inside the radius r =51.′′3(or,equivalently,∼5kpc)was left out as the completeness is significantly lower.Clusters out-side r =350′′were not considered because the sectors become geometrically incomplete.The results (Fig.10)show that,on average,red and blue clusters are spherically distributed around NGC 4374.The galaxy’s position angle of the major axis is in-dicated by the arrows at 135and 315degrees.There are some cases where blue and red clusters show sig-nificant di fferences in their azimuthal distributions,for example NGC 1316(G´o mez &Richtler 2001),NGC 3115(Kavelaars 1998),and NGC 1380(Kissler-Patig et al.1997).In these galaxies,the red clusters resemble the shape of their host galax-ies,while the blue clusters are more spherical.The interpreta-tion as di fferences between halo and bulge /disk populations is suggestive.The elongations of the above galaxies,if caused by inclined disks,are strong enough to make a disk population of clusters easily distinguishable from a spherical halo popula-tion.This is not the case for NGC 4374with its low ellipticity.M.G´o mez and T.Richtler:The Globular Cluster System of NGC 4374790180270360PA (deg)0102030405060N Fig.10.The azimuthal distribution of the clusters.The posi-tion angle is counted north over east.The histogram at the top (solid line)represents the number of cluster candidates on each sector.The binning angle is 30degrees.The dashed and dot-ted lines are the angular distribution of blue and red clusters,respectively.No systematic di fference exists and both red and blue clusters show a circular distribution.The galaxy’s posi-tion angle of the major axis is indicated by the arrows at 135and 315degrees.Clearly,we cannot draw conclusions about halo and bulge /disk cluster subpopulations from their azimuthal distribution.3.4.Radial ProfileWe calculated the cluster radial profile by counting the clus-ter candidates in several annuli centered on NGC 4374,each 25.′′65wide,starting from a radius of r =89.′′8up to r =346.′′4,and 102.′′6wide thereafter.The innermost ring (r =77.′′0)was given a width of 51.′′3because of the low statistics.The results are listed in Table 3.The bin center and size are the first two columns.The area of the annuli is given in the third column.The fourth column shows the number of candidates up to the 60%detection limit,before correcting for the completeness.The corrected number of clusters and its density are given in columns five and six.The remaining columns are used in the derivation of the specific frequency S N (see Sect.3.6).The radial profile in R is shown in Fig.11.The upper panel plots the GC number surface density and it is apparent that the cluster population extends at least out to r =350”.At larger radii the background dominates the profile.The background level is well determined and its value of 8.36±0.60arcmin −2has been subtracted from the tabulated densities,to derive the true radial profile,which is shown in the lower panel.The galaxy light in the R-band,arbitrarily shifted,is also plotted.The solid lines are:ρ(r )gcs ∝r −1.09±0.12and ρ(r )gal ∝r −1.67±0.02,with ρ(r )gcs being the cluster surface den-sity (in units of arcmin −2)and ρ(r )gal the surface brightness of the galaxy light.It is also apparent that the radial profile of the cluster den-sity around NGC 4374is flatter than the galaxy light.100radius (arcsec)110100G C /a r e a (a r c m i n −2)0510********G C /a r e a (a r c m i n −2)Fig.11.The radial profile of the clusters’surface density for candidates brighter than R =23.5.Top :the number of candi-dates per square arcmin vs.the mean projected distance to the optical center.Bottom :the radial profile,after the correction for background objects.The galaxy light,arbitrarily shifted (crosses)and the least-squares fits (solid lines)are also plot-ted.3.5.The Luminosity FunctionThe GCLF has been widely used as a distance indicator (seeHarris 2001and Richtler 2003for recent reviews).GCLFs of a broad range of galaxy types are well characterised by log-normal or t 5functions,the latter being of the form:t 5(m )=85πσt1+(m −m 0)28M.G´o mez and T.Richtler:The Globular Cluster System of NGC4374Table3.This table shows the result of the radial profile for the surface density of cluster candidates.Thefirst three columns list the center of each annulus(in arcsecs),its size and its area,in square arcmin.The observed number of cluster candidates brighter than R=23.5on the corresponding annuli is given in column4.After correcting for completeness,the actual number is shown in column5.Column6lists this number divided by the area of the annulus,or the surface density of clusters.The next three columns are used for the derivation of the specific frequency S N.They are the number of candidates up to the observed TOM before and after the completeness correction(columns7and8),and the total number of clusters in each annulus,assuming the LF to be symmetric around the TOM(column9).The background level has been subtracted for these latter counts.For radii larger than333.′′5,the annuli contain only background sources,so these four last rows are left blank.r[′′]size[′′]area[⊓⊔′]N(R)obs N(R)corr GC/area[1/⊓⊔′]N(R)TOMN(R)TOM,corrN ringTable4.The counts for the GCLF in the R band.Thefirst column is the bin center.The second column gives the observed number of candidates.The completeness factors(in column3)lead to the completeness-corrected number of candidates in column4.The observed background population and background completeness are listed in columns6and7.The completeness correction for the backgroundfield is slightly smaller than for the centralfield due to better seeing.Finally,after subtraction of the background population(scaled to the area of the clusters),the total number of clusters is given in column8.R N obs ffield N corr N bkgobsf bkg N bkg corr N terror bars account for poisson error in the binning process and for the completeness correction.According to thisfit,the TOM in the R band is23.56±0.15.Leavingσt a free parameter,we get for the TOM(R)= 23.84±0.35andσt=1.22±0.11.We take the absolute TOM(R) from Della Valle et al.(1998)who quote M R=−8.14±0.07for the galactic system.Another absolute calibration comes from the Andromeda nebula.Barmby et al.(2001)give R=16.40±0.14for the apparent TOM of M31.Together with a distance modulus ofµ=24.38±0.07(Freedman et al.2001), one gets M R=−7.98±0.15.We average these two values and adopt M R=−8.06±0.15.This leads to distance moduli of31.61±0.20(keepingσt= 1.1)and31.90±0.38(leavingσt free)for NGC4374.In the following,we consider only the TOM withσt=1.1.。
星河的英文带翻译
星河的英文带翻译The Milky Way: Our Home in the Universe。
The Milky Way is a barred spiral galaxy that contains our solar system and is home to billions of stars, planets, and other celestial objects. It is one of the most studied galaxies in the universe and has captivated the imaginations of astronomers, scientists, and stargazers for centuries.Structure and Composition。
The Milky Way has a diameter of about 100,000 light-years and is composed of a central bulge, a disk, and a halo. The central bulge is a dense, spherical region that contains mostly old stars and a supermassive black hole at its center. The disk is a flattened region that contains most of the galaxy's stars, gas, and dust, and is where most star formation occurs. The halo is a roughly spherical region that surrounds the disk and contains mostly oldstars and globular clusters.The Milky Way is made up of various types of celestial objects, including stars, planets, gas clouds, and dust. It is estimated to contain between 100 billion and 400 billion stars, including our own sun. The galaxy also contains a significant amount of dark matter, which is a mysterious substance that cannot be directly observed but is thought to make up about 85% of the galaxy's total mass.Observing the Milky Way。
星系介绍英文作文

星系介绍英文作文1. The Milky Way。
The Milky Way is a barred spiral galaxy that contains our solar system. It is estimated to have between 100 and 400 billion stars, and spans a diameter of approximately 100,000 light-years. The center of the Milky Way is home to a supermassive black hole, which has a mass of approximately 4 million times that of our sun. The Milky Way is also home to numerous other celestial objects, including gas clouds, star clusters, and nebulae.2. Andromeda。
Andromeda, also known as M31, is a spiral galaxy that is located approximately 2.5 million light-years away from the Milky Way. It is the closest galaxy to our own and is visible to the naked eye in the night sky. Andromeda is estimated to have between 1 and 2 trillion stars, making it the most massive galaxy in our local group. It also has asupermassive black hole at its center, which has a mass of approximately 140 million times that of our sun.3. The Large Magellanic Cloud。
- 1、下载文档前请自行甄别文档内容的完整性,平台不提供额外的编辑、内容补充、找答案等附加服务。
- 2、"仅部分预览"的文档,不可在线预览部分如存在完整性等问题,可反馈申请退款(可完整预览的文档不适用该条件!)。
- 3、如文档侵犯您的权益,请联系客服反馈,我们会尽快为您处理(人工客服工作时间:9:00-18:30)。
a r X i v :a s t r o -p h /0106459v 1 26 J u n 2001Draft version February 1,2008Preprint typeset using L A T E X style emulateapj v.14/09/00BULGE GLOBULAR CLUSTERS IN SPIRAL GALAXIESDuncan A.ForbesAstrophysics &Supercomputing,Swinburne University,Hawthorn,VIC 3122,Australiadforbes@.auJean P.Brodie and Søren rsenLick Observatory,University of California,Santa Cruz,CA 95064,USAbrodie,soeren@ Draft version February 1,2008ABSTRACTThere is now strong evidence that the metal-rich globular clusters (GC)near the center of our Galaxy are associated with the Galactic bulge rather than the disk as previously thought.Here we extend the concept of bulge GCs to the GC systems of nearby spiral galaxies.In particular,the kinematic and metallicity properties of the GC systems favor a bulge rather than a disk origin.The number of metal-rich GCs normalized by the bulge luminosity is roughly constant (i.e.bulge S N ∼1)in nearby spirals,and this value is similar to that for field ellipticals when only the red (metal–rich)GCs are considered.We argue that the metallicity distributions of GCs in spiral and elliptical galaxies are remarkably similar,and that they obey the same correlation of mean GC metallicity with host galaxy mass.We further suggest that the metal-rich GCs in spirals are the direct analogs of the red GCs seen in ellipticals.The formation of a bulge/spheroidal stellar system is accompanied by the formation of metal-rich GCs.The similarities between GC systems in spiral and elliptical galaxies appear to be greater than the differences.Subject headings:galaxies:formation —galaxies:individual (M31,M81,M104)—galaxies:starclusters.1.introductionGlobular clusters (GCs)in our Galaxy can be broadly divided into two classes on the basis of their metallicity and/or kinematics (e.g.Zinn 1985).The metal-poor,non-rotating subpopulation has long been associated with the Galaxy halo.The metal-rich GC system reveals signif-icant rotation and has historically been associated with the disk.Following early suggestions by Harris (1976),a view is now emerging that metal-rich GCs within ∼5kpc of the Milky Way galactic center are associated with the bulge rather than the disk (Frenk &White 1982;Minniti 1995;Cote 1999).Specifically,the central metal-rich GCs are spherically distributed about the galaxy center and overlap in metallicity with the bulge field stars.In terms of kinematics,the GCs have a similar velocity dispersion and reveal solid body rotation matching that of the bulge stars.Beyond ∼5kpc the metal-rich GCs have proper-ties consistent with the thick disk component.The GCs also appear to be coeval with the bulge stars (Ortolani et al.1995).Cote et al.(2000)has sucessfully modelled the Galactic GC system based on hierarchical build-up around a protobulge and its metal-rich GCs.Here we extend this view of ‘bulge GCs’to other spiral galaxies.In particular,we suggest that the inner metal-rich GCs in M31,M81and M104spiral galaxies are as-sociated with their bulges.We further suggest that the red (metal-rich)GC subpopulations in giant ellipticals are their analogs,in agreement with the view advocated by Cote et al.(2000).Thus the bulges of spirals,S0s and the entire stellar component of ellipticals (which we col-lectively refer to as the ‘bulge’)may all have associated metal-rich GCs.We briefly discuss the implications for GC and galaxy formation.2.bulge globular cluster kinematics2.1.M31The Andromeda galaxy (M31;Sb)reveals a bimodal GC metallicity distribution with the metal-rich GCs pre-ferrentially close to the galaxy center (e.g.Huchra,Kent &Brodie 1991).Based on their kinematics,Huchra et al.concluded that interior to ∼2kpc the metal-rich GCs were rapidly rotating.Recently Perrett et al.(2001)have obtained velocities for over 200GCs in the M31system.They find a velocity dispersion of 146±12km/s.This is consistent with the central stellar velocity dispersion of 150km/s (van den Bergh 1999).Furthermore the metal-rich GCs reveal solid-body-like rotation within 5kpc with an amplitude similar to that of the stellar rotation curve which is dominated by the bulge at these small radii (e.g.Rubin &Ford 1970).They also find that the metal-rich GC system is spherically distributed about the galaxy cen-ter.Thus,the inner metal-rich GCs in M31reveal the same features that have lead previous workers to associate equivalent GCs in our Galaxy with the bulge.2.2.M81The GC system of M81(Sa/Sb)is less well studied than M31but both photometric (Perelmuter &Racine 1995)and kinematic studies (Perelmuter,Brodie &Huchra 1995;Schroder et al.2001)have noted similarities to the Milky Way’s GC system.Schroder et al.(2001)give the kine-matics for the metal-rich GCs within 2kpc of the galaxy center from Keck spectra.They derive a velocity disper-sion of 152±36km/s and rotation velocity of 96±56km/s.Measurements of the stellar central velocity disper-sion vary from 150to 180km/s with a median value of 167km/s.The stellar rotation curve for M81peaks at around12Forbes,Brodie&Larsen0.5kpc radius with a value of∼110km/s(Heraudeau& Simien1998).The stellar values are slightly higher than those inferred for the GC system,but are well within the errors.Although the evidence is less strong,the inner metal-rich GCs of M81have kinematic properties that are consistent with the bulge.3.globular cluster metallicities Individual metallicities are now available for over250 GCs in M31(Barmby et al.2000).For M81,the pho-tometry of Perelmuter&Racine(1995)was insufficient to clearly differentiate the metal-poor and metal-rich sub-populations but they did note that the inner GC sample was dominated by red(metal-rich)objects.Perhaps the best photometrically-studied GC system in a spiral galaxy beyond the Local Group is that of the Sombrero galaxy (M104;Sa).The recent HST imaging study of Larsen, Forbes&Brodie(2001)showed that the GC system has two distinct subpopulations.After Galactic extinction cor-rection and color transformation using Kissler–Patig et al. (1998),we show in Fig.1the metallicity distribution of GCs in M104compared to that of M31,the Milky Way and M33(data from Forbes et al.2000).If we consider a cut at say[Fe/H]=–1,then it is clear that the ratio of metal-rich to metal-poor GCs is significantly higher in M104than the other spirals.Since M104has a tiny disk and a dominant bulge it is tempting to associate the metal-rich GCs with the bulge rather than the disk component (see also Section4).If the samples are restricted to the GCs to within5kpc of the galaxy center then the situation is even more pronounced.M33(Sc)at the opposite extreme has very few GCs with[Fe/H]>–1.Its‘bulge’has a luminosity of M V∼–15(Bothun1992).Local Group dwarf galaxies of this lu-minosity,typically have less than half a dozen GCs.Thus if the M33bulge is analogous to a small galaxy few as-sociated GCs are expected.We note that the LMC(an-other bulgeless galaxy)also lacks metal-rich GCs.For M31 (Sb)and the Milky Way(Sbc)the number of metal-rich GCs(relative to metal-poor ones)is intermediate between M104(Sa)and M33(Sc).We note that Kissler-Patig et al.(1997)associate the red GCs in the S0galaxy NGC 1380with that galaxy’s bulge.It seems likely that the rela-tive number of metal-rich GCs is related to the host galaxy Hubble type and hence the relative importance of a galaxy’s bulge.How are the metal-rich and metal-poor subpopulations in spiral galaxies related to those seen in early type galax-ies?Historically,one difference between the GC metal-licity distributions in spirals and ellipticals were thought to be the mean metallicity of the two peaks.M104,M31 and the Milky Way all have GC subpopulations with mean metallicities of[Fe/H]∼–1.5and–0.5(see Fig.1)while ellipticals were thought to have GC mean values of[Fe/H]∼–1.0and0.0(Harris1991).Recently,two developments have caused us to reassess the mean GC metallicity in ellipticals towards lower metallicities.Thefirst effect is the use of more accurate transformations from optical col-ors to[Fe/H].For example,the new transformation of Kissler–Patig et al.(1998)converts a typical V–I=1.05to [Fe/H]=–1.07,where the old Galactic–based transforma-tion would give[Fe/H]∼–0.5(Couture et al.1990).The second effect is that the more accurate Galactic extinction values of Schlegel et al.(1998)tend to be larger on average by up to A V∼0.1,than the traditionally-used Burstein &Heiles(1984)values.Thus extinction-corrected GC col-ors are now bluer than before,and more metal-poor when transformed.If these two effects are taken into account, the two GC subpopulations in ellipticals have mean metal-licities of[Fe/H]∼–1.5and–0.5which is similar to those in spirals.Tofirst order there appears to be very little difference between the mean metallicity of the two subpop-ulations in late and early-typegalaxies.Fig. 1.—Metallicity distributions of GCs in M104,M31, Milky Way and M33.The y axis has been scaled arbitrarily. Open histograms show the total GC population observed,and hashed histograms show GCs with5kpc of the galactic center (except for M33).M104has more metal-rich(e.g.[Fe/H]>–1)to metal-poor GCs than the later type spirals.When GC metallicities are examined in still more detail, it is found that the mean GC color(metallicity)corre-lates with galaxy velocity dispersion for early-type galax-ies(Forbes&Forte2001;Larsen et al.2001).Do the bulge GCs of spirals follow the same relation as early-type galaxies?We have collected a sample of37early-type galaxies from the literature with bimodal GC color distributions. The mean color of the metal-rich subpopulation has been corrected to a common V–I color(Forbes&Forte2001) and corrected for extinction using Schlegel et al.(1998).Bulge Globular Clusters3To this sample we add M104,M31and the Milky Way GC systems (the combined sample data are available at .au/staff/dforbes/glob.html).The V–I color of the M31and Milky Way metal-rich GCs have been calculated using the transformations of Barmby et al.(2000).Central velocity dispersions come from Gebhardt et al.(2000)and Kent (1992).The uncer-tainty in the mean color is rarely quoted in the original works.We have decided to adopt relatively conservative error estimates (i.e ±0.03m for HST data with definite bimodality,±0.05for probable bimodality and ±0.08for ground-based data to reflect the higher photometric errors and contamination rates).They may be smaller than we assume since the scatter in the data points is generally less than the errors.This means that we will tend to underestimate the significance of any slope compared to the error on the slope from a least-squaresfit.Fig.2.—Mean color of the red (metal-rich)globular clustersubpopulations versus log galaxy velocity dispersion.Early-type galaxies are shown by filled circles and spirals by trian-gles.A typical velocity dispersion error is shown in the lower left.The solid line shows the best fit to the early-type galaxies (slope =0.26±0.06,intercept =0.56±0.14).The correlation is significant at the 4σlevel.The three spiral galaxies (MW,M31,M104)are consistent with the overall early-type galaxy relation.The data are shown in Fig.2.For the early-type galax-ies,the Spearman rank correlation indicates that the red GCs are correlated with galaxy velocity dispersion with a probability of 99.9%.A least squares fit gives a positiveslope (similar to that found by Forbes &Forte (2001)and Larsen et al.(2001)for smaller samples)at the 4σlevel.The mean colors of the metal-rich GC subpopulations in the three spirals are also plotted in Fig.2.The red GCs in spirals are consistent with the metallicity –velocity dis-persion relation for early-type galaxies.If we use only the high quality sample (i.e.HST data with definite bimodality)then the Spearman test gives 99.5%and a slope of 4σ.An unweighted fit to the high quality sample gives a similar slope,with slightly increased significance of 5σ.4.bulge specific frequencyTraditionally GC specific frequency S N refers to the to-tal number of GCs per galaxy luminosity,normalised to M V =–15.Harris (1981)was the first to compare total GC numbers in spirals with the the luminosity of the bulge component.Recently,Cote et al.(2000)pointed out that S N defined in this manner was indistinguishable for spirals and ellipticals in similar environments.Here we focus on the metal-rich/red Gcs in spirals/ellipticals,compared to the bulge luminosity (we assume that ellipticals are bulge dominated systems).We refer to this as the bulge S N .The total number of GCs and the number of metal-rich GCs are given by Larsen,Forbes &Brodie (2000)for M104,and in the compilation of Forbes et al.(2000)for M31and the Milky Way.These numbers and the host galaxy magnitudes discussed below are summarized in Ta-ble 1.From the galaxy total magnitudes,we calculate the bulge and disk magnitudes using the following method.The bulge-to-total (B/T)luminosity for M104has been given by Kent (1988)as 0.85and by Baggett et al.(1998)as 0.73.Here we use 0.8.For M31(Sb)and the MW (Sbc)we use the B/T variations with Hubble type of Simien &de Vaucouleurs (1986),i.e.B/T =0.25and B/T =0.19re-spectively with a dispersion of about ±0.05within a given Hubble type.For the disk contribution we assume that the halo light is negligible and hence all of the remaining light comes from the disk.In Section 2we argued,mostly from the kinematic data,that the bulk of metal-rich GCs in spirals are not associ-ated with the disk but rather the bulge component.Fur-ther support for this idea comes from examining the num-ber of metal-rich GCs per unit starlight.The GC system of M104provides a key data point.For M104the total number of red GCs and the disk magnitude combine to give a disk S N of 4.4±5.2Assuming that the disks in M31and the Milky Way have similar stellar populations (i.e.M/L),the disk S N of M104is about 20times that of these other spirals.This large variation in disk S N suggests that that the bulk of metal-rich GCs in spirals are not in fact disk objects.From the bulge magnitudes and number of metal-rich GCs given above,we derive bulge S N values of 1.1±0.8(M104),0.6±0.3(M31)and 0.8±0.9(MW).Unlike the disk S N values,bulge S N values are fairly consistent be-tween the three spirals.In the case of the Milky Way only GCs within ∼5kpc show bulge characteristics while those further out have been associated with the thick disk (Minniti 1995;Cote 1999).In terms of the bulge effective radius,5kpc is 2R eff (van den Bergh 1999).The bulge effective radii4Forbes,Brodie&Larsenfor M104and M31are8kpc(Bender,Burstein&Faber 1992)and2.5kpc(van den Bergh1999)respectively.If the metal-rich GC samples in M104and M31are restricted to within2R eff,then we estimate about378metal-rich GCs in M104(from Larsen,Forbes&Brodie2001)and61 in M31(from Barmby et al.2000).The Milky Way has about35known metal-rich GCs within2R eff.Thus the bulge S N values within2R eff are0.6±0.5,0.4±0.2and 0.6±0.6for M104,M31and the Milky Way respectively. Within the errors,the bulge S N values for M104,M31and the Milky Way are consistent.So although the three spi-rals span a range of Hubble types from Sa to Sbc,the bulge S N appears to be nearly constant for spiral galaxies.In each case,there is a tendency to miss some metal-rich GCs as they are harder to detect near galaxy centers. For example,about a dozen GCs are thought to be hidden from our view in the Milky Way(van den Bergh1999). Recently the2MASS survey has detected two more metal-rich bulge GCs(Hurt et al.2000).Barmby et al.(2000) give photometry for about2/3of the total GC popula-tion in M31which has an estimated total population of 400±55.Again many of the missing GCs will be associ-ated with the bulge.The derived bulge S N values may be underestimated by up to30%.How do the bulge S N values for spirals compare to ellip-ticals?Field ellipticals have total S N values of1–3(Harris 1991).The fraction of red GCs in ellipticals is typically about half(e.g.Forbes,Brodie&Grillmair1997).For example,wide area studies of thefield/group ellipticals NGC1052and NGC1700found red fractions and total S N values of0.50,1.7and0.56,1.3respectively(Forbes, Georgakakis&Brodie2001;Brown et al.2000).This im-plies thatfield ellipticals typically have bulge S N values of 0.5–1.5.Thusfield ellipticals have similar bulge S N val-ues tofield spirals.This provides further support for our claim that the metal-rich GCs in spirals and those in el-lipticals have the same origin,i.e.they formed along with the bulge stars.We note that cluster ellipticals may have similar S N values when the mass of hot gas is taken into account(McLaughlin1999).Little is known about the GC systems of cluster spirals.5.concluding remarksFrom globular cluster(GC)kinematic information we have argued that the inner,metal-rich GCs in the nearby spirals M31and M81have a bulge origin.On the basis of GC numbers and specific frequency,we showed that the metal-rich GCs in the Sa spiral M104are most likely as-sociated with the dominant bulge rather than the small disk component.The derived bulge specific frequency for the GCs in M104,M31and the Milky Way are consis-tent with a constant value of∼1.This is similar to the value forfield ellipticals(when only the metal-rich GCs are considered)but is less than that for cluster ellipticals. The metallicity distributions of GCs in late and early-type galaxies are similar tofirst order,and obey the same cor-relation of mean GC metallicity with host galaxy velocity dispsersion.This relation,indicates a common chemical enrichment history for the metal-rich GCs and the host galaxy(Forbes&Forte2001).We conclude that the majority of the metal-rich GCs in spirals are associated with the galaxy bulge,and that these GCs are the analogs of the red(metal-rich)GCs in giant ellipticals.Thus GC systems provide another exam-ple of the similarity between ellipticals and spiral bulges (e.g.Wyse,Gilmore&Franx1997).By extension this would suggest that bulges and ellipticals formed by a sim-ilar mechanism.In the case of the Milky Way bulge,van den Bergh(1996)concluded that it was formed by a rapid but clumpy collapse.In the multi–phase collapse model for GC formation pro-posed by Forbes,Brodie&Grillmair(1997)the‘bulge’of a giant elliptical galaxy occurred in the second or galactic phase.The red GCs formed during this phase.In that paper,we associated the metal-rich GCs of spirals with disks and speculated that they were a third phase of GC formation.It now seems likely that the bulk of metal-rich GCs in spirals were formed along with the bulge stars and it is these that are directly analogous to red GCs in giant ellipticals.6.acknowledgmentsWe thank M.Beasley,J.Huchra and L.Schroder for their comments.We also thank the referee,P.Cote,for suggesting several improvements to the paper.Part of this research was funded by the Ian Potter Foundation and NSF grant AST9900732.REFERENCESBaggett,W.E.,Baggett,S.M.,Anderson,K.S.J.,1998,AJ,116, 1626Barmby,P.,Huchra,J.,Brodie,J.,Forbes,D.,Schroder,L., Grillmair,C.,2000,AJ,119,727Bothun,G.,1992,AJ,103,104Bender,R.,Burtsein,D.,Faber,S.,1992,ApJ,399,462Brown,R.J.N.,Forbes D.A.,Kissler-Patig M.,Brodie J.,2000, MNRAS,317,406Burstein,D.,Heiles,C.,1984,ApJS,54,33Cote,P.,1999,AJ,118,406Cote,P.,Marzke,R.O.,West,M.J.,Minniti,D.,2000,ApJ,533, 869Couture,J.,Harris,W.E.,Allwright,J.W.B.,1990,ApJS,73,671 Forbes D.,Masters,K.,Minniti,D.,Barmby,P.,2000,A&A,358, 471Forbes,D.,Georgakakis,A.,Brodie,J.,2001,MNRAS,in press Forbes,D.,Brodie,J.,Grillmair,C.,1997,AJ,113,1652 Forbes,D.,Forte,J.,2001,MNRAS,322,257Frenk,C.,White,S.D.M.,1982,MNRAS,198,173Gebhardt,K.,et al.2000,ApJ,539,L13Harris,W.E.,1976,AJ,81,1095Harris,W.E.,1981,ApJ,251,497Harris,W.E.,1991,ARA&A,29,543Heraudeau,Ph.,&Simien,F.,1998,A&AS,133,317Huchra,J.P.,Kent,S.,Brodie,J.P.,1991,ApJ,370,495Hurt,R.,et al.2000,astro-ph/0006262Kent,S.,1988,AJ,96,514Kent,S.,1992,ApJ,387,181Kissler-Patig,M.,Richtler,T.,Storm,J.,della Valle,M.,1997, A&A,327,503Kissler-Patig,M.,Brodie,J.,Schroder,L.,Forbes,D.,Grillmair, C.,Huchra,J.,1998,AJ,115,105Larsen,S.,Forbes,D.,Brodie,J.,2001,MNRAS,submitted Larsen,S.,Brodie,J.,Huchra,J.,Forbes,D.,Grillmair,C.,2001, AJ,in pressMcLaughlin,D.,1999,AJ,117,2398Minniti,D.,1995,AJ,109,1663Ortolani,S.,et al.1995,Nature,377,701Perelmuter,J-M.,Brodie,J.P.,Huchra,J.P.,1995,AJ,110,620 Perelmuter,J-M.,Racine,R.,1995,AJ,109,1055Bulge Globular Clusters5Perrett,K.,et al.2001,in preparationRubin,V.,Ford,W.,1970,ApJ,159,379Schlegel,D.J.,Finkbeiner,D.P.,Davis,M.,1998,ApJ,500,525 Simien,F.,de Vaucouleurs,G.,1986,ApJ,302,564Schroder,L.,Brodie,J.,Kissler-Patig,M.,Huchra,J.,Phillips,A.,2001,AJ,in pressvan den Bergh,S.,1999,A&AR,9,273Wyse,R.,Gilmore,G.,Franx,M.,1997,ARAA,35,637Zinn,R.,1985,ApJ,293,424TABLE1GLOBULAR CLUSTER BULGE SPECIFIC FREQUENCYM104M31Milky Waya The table lists the total number of globular clusters,the metal-rich subpopulation and those within twice the bulge Reff .The bulge and disk specificfrequencies,S N,use bulge and disk luminosities respectively.。