百川资讯-2010 Deep Research Report on China Wind Turbine Industry
The impact of growth and inequality on rural poverty in China

Journal of Comparative Economics 34(2006)694–712/locate/jceThe impact of growth and inequalityon rural poverty in ChinaYin Zhang a ,∗,Guanghua Wan ba Department of Economic Studies,University of Dundee,3Perth Road,Dundee,DD14HN,UKb UNU-WIDER,Helsinki,Fin-00160,FinlandReceived 8August 2006Available online 26September 2006Zhang,Yin,and Wan,Guanghua —The impact of growth and inequality on rural poverty in ChinaThis paper analyzes the evolution of poverty in China from the late 1980s to the late 1990s,employing a version of Shapley decomposition tailored to unit-record household survey data.The changes in poverty trends are attributed to two proximate causes—income growth and shifts in income distribution.Different data sets,poverty lines,poverty measures,and equivalence scales are used to examine the robustness of the results.Potential biases arising from ignoring differential regional prices and inflation are also investigated.Notwithstanding some ambiguities in the results,it is consistently found that rural poverty increased in the second half of the 1990s and adverse distributional changes are the main cause.Journal of Comparative Economics 34(4)(2006)694–712.Department of Economic Studies,University of Dundee,3Perth Road,Dundee,DD14HN,UK;UNU-WIDER,Helsinki,Fin-00160,Finland.©2006Association for Comparative Economic Studies.Published by Elsevier Inc.All rights reserved.JEL classification:O15;O53Keywords:Rural poverty;Shapley decomposition;China1.IntroductionEast Asia is the first,and remains the only,region where the first target of the Millennium Development Goals (MDGs)—halving extreme poverty between 1990and 2015—has been met (UN Millennium Project,2005).While the dramatic poverty reductions in China are essential *Corresponding author.Fax:+441382384691.E-mail address:y.x.zhang@ (Y .Zhang).0147-5967/$–see front matter ©2006Association for Comparative Economic Studies.Published by Elsevier Inc.All rights reserved.doi:10.1016/j.jce.2006.08.008Y.Zhang,G.Wan/Journal of Comparative Economics34(2006)694–712695 to that attainment,as of2001around onefifth of the world’s poor still reside there(Chen and Ravallion,2004).Within China,rural poverty dominates the scene.The overall reduction of rural poverty since the initiation of market-oriented reform has been nothing but impressive. Notwithstanding,some recent research suggests that the process slowed down significantly in the1990s and has even shown signs of reversal(Chen and Ravallion,2004).Success in battling rural poverty clearly holds the key to further progress toward poverty alleviation in China and the achievement of the MDG poverty target on a global scale.It is thus important to understand what drives the latest poverty trend in rural China.The agricultural sector is where China’s remarkable growth story started.By simply de-collectivizing production and allowing farmers to sell their surplus produce on the market,China propelled the annual growth rate of agriculture from an average of2.5percent in1952–1977 to7.4percent in1978–1984.As a result,rural per capita income rose by a stunning270per-cent.However,the agricultural sector moved down the government’s priority list around the mid-1980s when the focus of reform was shifted to the urban area and industrial sector.Not only were government procurement prices of farm produce set below market prices,but they also failed to keep up with price increases in other sectors during1989–1993(Fig.1).Agricul-tural growth slowed down,and the growth of grain output suffered particularly severely.In1993, a combination offloods and drought led to food shortage.Attempts to raise grain procurement prices to market levels in1994triggered a sharp increase in grain prices.Concerned about in-flation pressures and grain self-sufficiency,the government responded by increasing investment in rural infrastructure and reasserting control over the production and marketing of several ba-sic commodities.In addition,a governor’s grain bag responsibility system was implemented in 1995,which made provincial governors personally responsible for ensuring adequate supply ofFig.1.Changes in rural CPI and procurement price index of farm produce.696Y.Zhang,G.Wan/Journal of Comparative Economics34(2006)694–712domestic grain within their jurisdictions.These policies succeeded in stabilizing food prices and increasing grain reserves.In the late1990s,government controls over the imports of agricultural products were gradually eased as China prepared for entry into the WTO.Increased imports along with consecutive years of good harvest boosted food supply.The demand for food,how-ever,did not rise as fast,partly due to a declining share of food in household expenditure induced by higher income.Food prices slumped and rural income stagnated.The above agricultural policies have implications for rural income growth as well as for its paring the trajectories of poverty reduction and GDP growth after the late 1980s with those in the earlier years,a number of studies have emphasized the role of rising in-come inequality in slowing down poverty reduction.These include,among others,Khan(1999), Gustafsson and Wei(2000),Yao(2000),Chen and Wang(2001),and Ravallion and Chen(2004). Given a poverty line,any poverty trend can always be attributed to income growth and shifts in the distribution of income.The decision facing policy makers is often one of allocating limited resources between growth promotion and redistribution toward the poor.This paper seeks to analyze the contributions to China’s rural poverty trend attributable to income growth and distri-bution.Three features set this paper apart from previous studies on China’s poverty.Firstly,most studies rely on household survey data from the National Bureau of Statistics(NBS).The NBS data from published sources are in grouped format.Estimating poverty measures from grouped data necessarily involves interpolation in order to generate data between group boundaries.1This entails errors unless the interpolation method happens to agree with the underlying income distri-bution.2Besides,the NBS data have been criticized for their exclusion of such important income items as imputed rents of owner-occupied housing,subsidies,income in kind,and so on(Khan, 1999).Exploring alternative data sources can therefore serve the useful purpose of checking the robustness of results based on the NBS data.The two data sets employed in this paper are such examples,both of which provide household-level income data and are from sources distinct from the NBS household survey.3The second departure of this paper lies in our method of quantifying the relative impor-tance of growth and distributional changes in forming poverty trend.Because income growth and distributional changes are interrelated,their unconditional correlation with poverty changes is uninformative of their marginal impact on poverty.Some studies regress the logarithms of a poverty index on those of the average income and an aggregate inequality measure,typically the Gini index,to obtain the marginal impacts of growth and redistribution(e.g.,Khan,1999; Yao,2000;Ravallion and Chen,2004).Implicitly,this assumes that the relationship among the three variables is approximately log-linear.The accuracy of this approximation aside,4a major problem with this approach is that the Gini index uniquely determines the Lorenz curve only 1In the rare case of the poverty line coinciding with one of the income group boundaries,grouped data lend themselves readily to the calculation of poverty measures such as thefirst three indices of the Foster–Greer–Thorbecke(FGT)family. 2Some researchers gained access to household-level NBS data,but these are typically for isolated provinces and of limited years(e.g.,Yao,2000).The exception is a recent World Bank study(Ravallion and Chen,2004),which has meticulously assembled from household-level NBS data the1981–2001series of three FGT indices both at the national level and separately for urban and rural areas.3Another data set featuring unit-record income data is the China Household Income Project(CHIP)data set.It contains information from two household surveys conducted by the Chinese Academy of Social Sciences(CASS)in selected provinces in1988,1995,and2002.4If the regression has a poorfit,much of the changes in poverty will be assigned to the residual term and thus go unaccounted for.Y.Zhang,G.Wan/Journal of Comparative Economics34(2006)694–712697 under restricted conditions.5A given change in the Gini index may be caused by redistribution among the nonpoor,among the poor,or between the poor and the nonpoor.In thefirst case, poverty will not be affected at all.Poverty changes in the latter two cases will also differ.Hence, the regression coefficient on the Gini index does not identify the effects of distributional changes on poverty as it is purported to.Another,and also more appropriate in our review,approach to pinning down the relative contribution of growth and distributional changes is that proposed by Datt and Ravallion(1992)to decompose a change in a poverty measure into growth and redis-tribution components.6This paper adopts the Datt–Ravallion decomposition methodology with two extensions.First,we draw on the Shapley value decomposition framework propounded by Shorrocks(1999)to make the decomposition symmetric and exact.Second,in the Datt–Ravallion decomposition distributional changes are identified with changes in the estimates of Lorenz curve parameters.We shall show that,with microlevel data,decomposition can be conducted without resorting to parametric Lorenz functions.Finally,measurement issues loom large in poverty research,especially for studies about tran-sition and developing economies.Apart from the problems with the availability and quality of household survey data,there are often ambiguities about the appropriate poverty line,equiv-alence scale,poverty measure,and price index to use.As some arbitrariness is inevitable in making the choice,we examine the sensitivity of poverty trend and decomposition to alternative measurement assumptions rather than focusing exclusively on a particular one of them.The remainder of the paper is organized as follows.The next section explains the decom-position methodology and discusses various uncertainties involved in assessing poverty trend and decomposition.Section3introduces the data and presents the time profiles of three poverty measures of the Foster–Greer–Thorbecke(FGT)family.In Section4,we discuss the decompo-sition results.Particular attention is given to results that are consistent across different data sets and poverty measures and under alternative assumptions about the poverty line and equivalence scale.Some concluding comments are offered in Section5.2.Growth–redistribution decomposition and the robustness of poverty measurementA poverty measure P is a function of the income distribution Y and poverty line z,i.e.,P t= P(Y t,z t).If the poverty line is held constant over time,a change in poverty between period0 and period T can be written asP=P(Y t)−P(Y0),(1) where the letter z representing the poverty line is dropped for simplicity.7The basic idea behind the growth–redistribution decomposition is that,at any point of time t,the income distribution Y t can always be fully described by its mean incomeμt and Lorenz curve L t,the latter of which is uniquely determined by the probability density function(PDF)of relative income.8Thus,5If the size distribution of income is log-normal,for example,then there is a one-to-one relationship between the Gini index and the Lorenz curve.However,empirical evidence shows that the log-normal distribution does not describe real income data well(McDonald,1984).6For applications of the Datt–Ravallion decomposition to the Chinese context,see Fang et al.(2002)and Chen and Wang(2001).7Changes in the poverty line can be easily accommodated in the framework described below.8We use the term‘relative income’to refer to income values normalized by the mean income.698Y.Zhang,G.Wan /Journal of Comparative Economics 34(2006)694–712P stems from changes in either of the two determinants of Y .If income growth is distribu-tion neutral,or the income of every individual grows by the same proportion,then the Lorenz curve (or,equivalently,the PDF of relative income)will stay unchanged and P is due en-tirely to changes in the mean income.Conversely,when the mean income neither grows nor contracts,a change in poverty will occur if and only if the Lorenz curve shifts,i.e.,there is income redistribution among some individuals.Applied to the general case with both income growth and distributional changes,the preceding reasoning implies that P can be separated into two components measuring respectively the growth and distributional effects.To express the two components mathematically,let Y (μi ,L j )be a hypothetical income distribution with mean income μi and Lorenz curve L j taken from different distributions,i.e.,i =0or T ,j =0or T ,and i =j .And let P (μi ,L j )represent the poverty level corresponding to Y (μi ,L j ).The growth component of P can be defined as(2)growth component ≡P (μT ,L 0)−P (Y 0),or,alternatively,as(2A)growth component ≡P (Y T )−P (μ0,L T ).Similarly,the redistribution component can either be defined as(3)redistribution component ≡P (μ0,L T )−P (Y 0),or as(3A)redistribution component ≡P (Y T )−P (μT ,L 0).Four decompositions of P can be formed by combining the alternative definitions of the growth and redistribution components differently.If definitions (2)and (3)are used,period 0is the ref-erence period;if,instead,definitions (2A)and (3A)are chosen,the reference period is period T .The results from the two decompositions need not agree,and both are inexact in that the growth and redistribution components do not add up to P .If the combination (2)and (3A)or (2A)and(3)is used,the decomposition will be exact sinceP (Y T )−P (Y 0)=growth component +redistribution component (4)= P (μT ,L 0)−P (Y 0) + P (Y T )−P (μT ,L 0) (5)= P (Y T )−P (μ0,L T ) + P (μ0,L T )−P (Y 0) .However,the growth and redistribution components in expressions (4)and (5)are measured against different reference periods.Again,the two decompositions produce different results in general,and thus are equally arbitrary or equally justified.The decomposition methods used in previous studies,such as those of Datt and Ravallion (1992),Kakwani and Subbarao (1990),and Jain and Tendulkar (1990),essentially comprise one or two of the above decompositions.Hence,they are sensitive to the choice of the reference period,and are inexact or have a nonvanishing residual term whenever growth and distributional changes are both present.A solution to these problems created by the reference point is to take the average of expressions (4)and (5)to arrive atP =0.5 P (μT ,L 0)−P (Y 0) + P (Y T )−P (μ0,L T ) (6)+0.5 P (Y T )−P (μT ,L 0) + P (μ0,L T )−P (Y 0) .Y.Zhang,G.Wan /Journal of Comparative Economics 34(2006)694–712699As argued in Shorrocks (1999)and Kolenikov and Shorrocks (2005),the decomposition in ex-pression (6)is not an arithmetic gimmick,but has its theoretical roots in the cooperative game theory.Apart from notational difference,expression (6)is identical to what Shorrocks (1999)derived using the Shapley value.The growth component G and the redistribution component R of the Shapley value decomposition of P are thus (7)G ≡0.5 P (μT ,L 0)−P (Y 0) + P (Y T )−P (μ0,L T ) ,(8)R ≡0.5 P (Y T )−P (μT ,L 0) + P (μ0,L T )−P (Y 0) .It can be easily seen that the Shapley decomposition is symmetric and exact.There remains the question of how to obtain the poverty indices P (μT ,L 0)and P (μ0,L T )of the hypothetical distributions.The method used in previous studies is to assume a parametric Lorenz curve or PDF.Then,the formula for the poverty measure as a function of the mean income and parameters of the Lorenz curve or PDF is derived.The parameters are estimated economet-rically for both periods 0and T .Plugging into the derived formula the parameter estimates for period 0and mean income of period T give P (μT ,L 0).P (μ0,L T )is obtained similarly.The weakness of this parametric procedure is that the specification and estimation of the Lorenz curve or PDF can give rise to errors that bias subsequent estimates of the poverty measure.When grouped data are all that is available,the Lorenz curve (and the PDF)will have to be estimated and the parametric procedure is at least a good place to start with.However,if unit-record data are available,which is the case of this study,a simpler solution exists.To keep the Lorenz curve of an income distribution intact but give it a new mean,one can simply scale every observation by the new mean divided by the old mean.In other words,the two hypothetical distributions can be constructed as Y (μ0,L T )=Y T ×(μ0/μT )and Y (μT ,L 0)=Y 0×(μT /μ0).The poverty indices P (μ0,L T )and P (μT ,L 0)can then be calculated directly from the constructed distributions.Even with unit-record data,assessing poverty trend is still subject to a host of uncertainties,which in turn affect poverty decomposition.We consider three such uncertainties here:poverty measures,poverty lines,and equivalence scales.The most widely used poverty measures are the first three FGT (Foster et al.,1984)poverty indices that can be generically expressed as (9)P α=1N Y i zz −Y i z α,α 0.P 0,the head-count ratio,gives the proportion of the population whose incomes fall below the poverty line z .The poverty gap index P 1measures the average income shortfall in meeting the poverty line,where the shortfall is expressed as a proportion of the poverty line and the poverty gap of the nonpoor is assigned zero.The squared poverty gap index P 2is the sum of the proportionate poverty gaps weighted by themselves,and is thus more sensitive to the income changes of poorer individuals.The three indices reflect different aspects of the same poverty experience,measuring respectively the incidence,depth,and severity of poverty.Therefore,the magnitude and direction of their changes need not always concur.This will then lead to different assessments of the relative role played by income growth and redistribution in affecting poverty.99To take a simple example,suppose that an income distribution has changed from (1,2,3,4)to (2,2,2,4)and the poverty line is set at 2.5.The head-count ratio would indicate an increase in poverty (from 0.5to 0.75)whereas the poverty gap index would show a decrease (from 0.2to 0.15).Decomposing the change in the head-count ratio according to definitions (7)and (8)would put the contribution of growth at zero and the contribution of redistribution as poverty worsening (R >0).The same decomposition applied to the change in the poverty gap index would give a negative redistribution component.700Y.Zhang,G.Wan/Journal of Comparative Economics34(2006)694–712 The evaluation of poverty trend may also be sensitive to where the poverty line is drawn.For example,if the poverty line happens to be near a local mode of the income distribution,an im-material shift of the poverty line might cause a large swing of measured poverty,especially for poverty measures such as P0and P1,which are not continuous at the poverty line.Given the inevitable arbitrariness in defining the poverty line,an assessment of the poverty trend that can be easily reversed by a slight change to the poverty line will hardly inspire much confidence.In this paper,we consider six national and international poverty lines.10These include the US$1.08 and US$2.15per capita per day poverty lines in1993PPP,the US$1and US$2per capita per day poverty lines in1985PPP,the rural poverty line proposed in Ravallion and Chen(2004) (850yuan in2002prices),and the official rural poverty line of530yuan in1995prices.An-other concern about the poverty line is whether a poverty line should be applied uniformly to all regions under examination.The costs of living vary across Chinese provinces sometimes by wide margins.Official CPIs published by the NBS,available at the provincial level,allow one to trace changes in the costs of living within a province,but not the differences across provinces. Using official CPIs and price data for1990,Brandt and Holz(2004)constructed several panels of provincial price levels.One of these is adopted in this paper to convert national poverty lines to their provincial counterparts or,equivalently,to convert nominal incomefigures to real incomes measured in national prices of the base year.11In most poverty studies on China,the indicator of individual welfare is on a per capita basis—total household income(or consumption)divided by the number of people in the household. This practice assumes away the possibility that the per capita cost of semipublic goods such as housing,utilities,transportation,and so on is negatively related to household size.Even for ri-val goods such as food,the unit price paid by large households may be lower than that paid by small households because the former are more likely to make bulk purchases.It is also possi-ble that the costs for reaching a given welfare level are different for demographically different but otherwise identical households.Studies on other developing countries show that the scope for economies of scale in household consumption can be considerably large by some measures but negligible by others,and that the effects of demographic compositions on household con-sumption are insignificant(Lanjouw and Ravallion,1995).In a study of urban residents in12 Chinese cities,Gustafsson et al.(2004)find that the size and age composition of households have a modest impact on households’perception of minimum living expenditure.Whether their finding also applies in rural areas is an open question,since rural households tend to be larger and have different consumption pattern than urban households.The average household sizes of both our data sets exhibit a decline trend over the period of1988to1999,one from4.71to4.13persons,and the other from4.33to3.74.If there ex-ist significant economies of scale and poor households are getting smaller on average,then a poverty trend based on per capita income will understate the increase(or overstate the reduction) in poverty.12To examine how allowing for economies of scale would affect the assessment of 10Poverty lines are sometimes defined relative to the mean income.We will confine ourselves to absolute poverty lines. 11The rural price levels by provinces were obtained by applying to a1990rural consumption basket the official rural CPIs adjusted for consumption of self-produced products.Note that Brandt and Holz(2004)used the same composition of the consumption basket for all provinces throughout1984–2000.As a result,regional differences in and changes over time of consumption patterns are ignored.In addition,the consumption basket used for deriving CPIs is meant to be representative of the consumption pattern of all rural residents,and hence may well differ from the consumption pattern of the rural poor.12We do not have sufficient information to investigate the existence of economies of scale in the data sets.Y.Zhang,G.Wan/Journal of Comparative Economics34(2006)694–712701 poverty trend and its decomposition,we employ three constant-elasticity equivalence scales to normalize household sizes.More specifically,if n i represents the number of people in house-hold i,the normalized household size is given by k i=nθi,whereθis alternatively set to1,0.8, and0.5.3.Data and poverty trendIn this section,we will examine poverty trend in rural China from the late1980s to the end of1990s,using household-level income data from two different surveys.13Thefirst survey was administered annually by the Research Centre for Rural Economy(RCRE)of the Ministry of Agriculture of China in eight provinces between1987and1999except1992and1994.The number of households covered by the survey was exceptionally small in1990and1991.For the other years,it varied between6200and6900households.14Our second data source is the China Health and Nutrition Survey(CHNS).15Five rounds of CHNS were conducted in1989, 1991,1993,1997,and2000.Each round covered around15,000individuals from about4000 households spread over nine provinces.Of these,about two thirds of the households and70 percent of the individuals are classified as rural.The incomefigures reported in each round appertain to the year immediately prior to the survey year.Observations in both data sets are checked for completeness and internal consistency.To retain as many data points as possible,only those with missing or dubious entries for household size or total income are dropped.We select from each survey4years of data to make the sample periods of the two data sets comparable.For CHNS,the four rounds chosen contain data for1988,1992, 1996,and1999;for RCRE survey,the sample years are1988,1993,1996,and1999.That the RCRE survey and the CHNS each cover only eight or nine provinces might raise con-cerns about how representative they are of the30odd Chinese provinces in total.The provinces included in the two data sets are given in Table1.These provinces are diverse in economic struc-ture,level of development,and growth performance during the sample period.A good few of them are among the most populous provinces.According to the end-of-year population statistics for2003(National Bureau of Statistics,2004),the combined population of the eight provinces in the RCRE survey is about40percent of the national total,while the population share of the nine provinces in the CHNS exceeds43percent.The share of total rural population of the sampled provinces may be even higher.In our view,the surveyed provinces in each data set constitute a fairly balanced representation of China’s economic geography.The poverty trend inTable1Provinces included in the data setsRCRE Anhui,Gansu,Guangdong,Henan,Jiangsu,Jilin,Shanxi,SichuanCHNS1988,1992:Guangxi,Guizhou,Henan,Hubei,Hunan,Jiangsu,Liaoning,Shandong1996:Guangxi,Guizhou,Heilongjiang,Henan,Hubei,Hunan,Jiangsu,Shandong1999:Guangxi,Guizhou,Heilongjiang,Henan,Hubei,Hunan,Jiangsu,Liaoning,Shandong13Since we are interested in poverty among individuals,individual-level income data would be ideal.The data sets do contain some information on individual earnings.However,household members usually pool their earnings,and little is known about intrahousehold redistribution.Following standard practice,we assume perfect income equality among individuals of the same household.14A brief description of the history of the RCRE survey can be found in Wan and Zhou(2005).15The data can be downloaded from /projects/china.702Y.Zhang,G.Wan/Journal of Comparative Economics34(2006)694–712these provinces should also be able to convey the varied poverty reduction experience across the country.That said,it is necessary to stress that this section is not about establishing the exact val-ues of certain poverty measures in the rural areas of China,though we do present estimates of the three FGT indices based on the two data sets.To undertake that task requires surveys with a much more expansive sampling frame both in geographical coverage and preferably in the number of participating households.At present,the NBS urban and rural household surveys are probably the only ones that are sufficiently comprehensive for such a ing the NBS survey data, Ravallion and Chen(2004)have done a meticulous job assembling long series of the FGT indices both at the national level and separately for the rural and urban areas.Rather than trying to better their estimates,the objective here is to assess the trend of income poverty in a broad spectrum of provinces.The results derived herein are indicative of whether the poverty trend observed in the NBS data is sensitive to geographical coverage and,since our data are not culled from the NBS surveys,whether the trend is survey specific.That the two data sets themselves come from different sources serves an analogous purpose—a sensitivity check on the poverty trend present in each data set.Table2provides the estimates of the head-count ratio,poverty gap,and squared poverty gap indices for the two data sets under different combinations of alternative assumptions about poverty measurement.The left half of the table shows the results for the RCRE data,and the right half for the CHNS data.Horizontally,the table is divided into two panels,each containing results based on a different equivalence scale.16Hence,in the upper-left block wefind the values of P0,P1,and P2for the RCRE data when per capita income(θ=1)is the welfare indicator. Every poverty index is measured against the six poverty lines stated earlier.To explore the sen-sitivity of the results to interprovincial differences in the costs of living,nominal income values are alternately adjusted for provincial deflators constructed by Brandt and Holz(2004)and the rural CPI.It can be seen from the estimated head-count ratios(P0)that the six poverty lines represent roughly three different classes of poverty.The lowest poverty line z1(530yuan in1995prices) cuts the income distribution at the bottom5to15percent of the population,thus can be viewed as the threshold for extreme poverty in this ing the second,third,or fourth poverty line,around20to30percent of the sampled rural residents would be classified as poor,an assessment in agreement with the general perception of rural poverty in China.The other two lines,US$2.15in1993PPP and US$2in1985PPP per person per day,designate60to70 percent of the population as poor.They seem rather too high at the present stage to serve as poverty thresholds for policy purpose.17Poverty trends appear to differ when measured against the three classes of thresholds.For example,in thefirst four columns of the upper-left block where interprovincial price differences are factored in,the prevalence(P0)of extreme poverty(measured against z1)started rising as early as1993.The downward trend in the second poverty class(measured against z2–z4)did not reverse until1996,whereas the decline in the third poverty class(measured against z5–z6)was sustained throughout this period.The choice of a poverty index can also affect the assessment of poverty trend.Judging by the head-count ratio,for instance,a sizable reduction in poverty can 16Settingθto0.5does not change our major conclusion about the evolution of poverty trend in this period.However, given the current income level and expenditure pattern in rural China,the scope for scale economies is probably not large enough to justifyθ=0.5.A value of0.8is arguably more appropriate.The results withθ=0.5are available upon request.17We thank an anonymous referee for highlighting this point.。
深赛格B:2010年第一季度报告全文(英文版) 2010-04-29
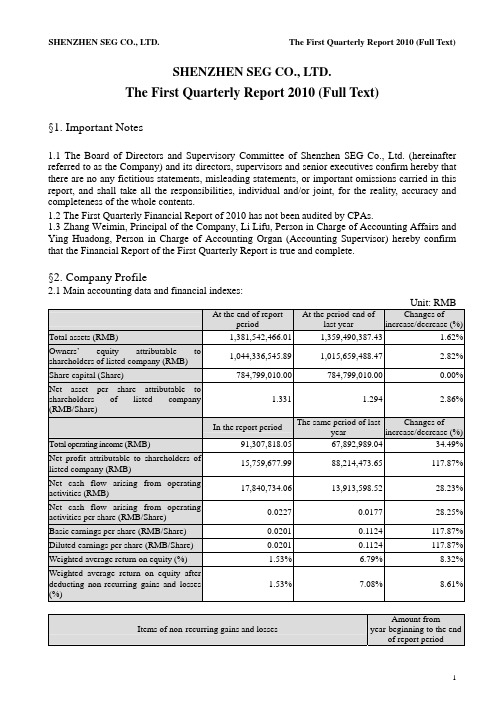
SHENZHEN SEG CO., LTD.The First Quarterly Report 2010 (Full Text)§1. Important Notes1.1 The Board of Directors and Supervisory Committee of Shenzhen SEG Co., Ltd. (hereinafter referred to as the Company) and its directors, supervisors and senior executives confirm hereby that there are no any fictitious statements, misleading statements, or important omissions carried in this report, and shall take all the responsibilities, individual and/or joint, for the reality, accuracy and completeness of the whole contents.1.2 The First Quarterly Financial Report of 2010 has not been audited by CPAs.1.3 Zhang Weimin, Principal of the Company, Li Lifu, Person in Charge of Accounting Affairs and Ying Huadong, Person in Charge of Accounting Organ (Accounting Supervisor) hereby confirm that the Financial Report of the First Quarterly Report is true and complete.§2. Company Profile2.1 Main accounting data and financial indexes:Unit: RMBAt the end of reportperiod At the period-end oflast yearChanges ofincrease/decrease (%)Total assets (RMB) 1,381,542,466.011,359,490,387.43 1.62% Owners’ equity attributable toshareholders of listed company (RMB)1,044,336,545.891,015,659,488.47 2.82% Share capital (Share) 784,799,010.00784,799,010.00 0.00% Net asset per share attributable toshareholders of listed company(RMB/Share)1.331 1.2942.86%In the report period The same period of lastyearChanges ofincrease/decrease (%)Total operating income (RMB) 91,307,818.0567,892,989.04 34.49% Net profit attributable to shareholders oflisted company (RMB)15,759,677.99-88,214,473.65 -117.87% Net cash flow arising from operatingactivities (RMB)17,840,734.0613,913,598.52 28.23% Net cash flow arising from operatingactivities per share (RMB/Share)0.02270.0177 28.25% Basic earnings per share (RMB/Share) 0.0201-0.1124 -117.87% Diluted earnings per share (RMB/Share) 0.0201-0.1124 -117.87% Weighted average return on equity (%) 1.53%-6.79% 8.32% Weighted average return on equity afterdeducting non-recurring gains and losses(%)1.53%-7.08% 8.61%Items of non-recurring gains and lossesAmount from year-beginning to the end of report periodOther non-operating income and expenditure except for the aforementioned items 97,850.12 Influenced amount of income tax -21,527.03Influenced amount of minority shareholders’ equity -31,864.37Total 44,458.72 Explanations of items of significant non-recurring gains and losses1. Other non-operating income and expenditure except for the aforementioned items:mainly the damages for breach of contract received by the Company;2. Influenced amount of income tax: the influenced amount of deductible income tax increased due to the profit increase because of the aforementioned item;;3. Influenced amount of minority shareholders’ equity: this item increased due to the increase of the aforementioned No.1 item of controlling subsidiary of the Company.2.2 Total number of shareholders at the end of the report period and shares held by the top ten shareholders without restricted conditionsUnit: Share Total number of shareholdersat the end of report period59,152Particulars about the shares held by the top ten tradable shareholders without restricted conditionsFull name of shareholder Amount of tradable shares withoutrestricted conditions held at the endof report periodType of sharesSHENZHEN SEG GROUP CO., LTD. 237,359,666 RMB ordinary shares GUANGZHOU FODAK ENTERPRISEGROUP CO., LTD.18,880,334 RMB ordinary shares Yang Zhihui 12,582,734 RMB ordinary shares Taifook Securities CompanyLimited-Account Client5,758,103 Domestically listed foreign shares Gong Qianhua 5,560,967 Domestically listed foreign shares Zeng Ying 4,280,048 Domestically listed foreign shares Zhu Wei 4,066,739 RMB ordinary shares Tang Lizhu 3,796,200 RMB ordinary shares SHANGHAI QILE ECONOMIC ANDTRADE CO., LTD.2,754,330 RMB ordinary shares Cao Xianhua 2,702,000RMB ordinary shares§3. Significant Events3.1 Particulars about material changes in items of main accounting statement and financial index, and explanations of reasons√Applicable □InapplicableI. Balance sheet itemItem Mar. 31, 2010 Dec. 31, 2009 Balance Proportion ofchanges % Inventory 1,919,437.27 5,886,392.39 -3,966,955.12 -67.39% Construction in progress 9,776,526.68 26,192,075.55 -16,415,548.87 -62.67% Staff salaries payable 1,172,559.95 4,261,476.99 -3,088,917.04 -72.48% 1. Inventory: decreased by RMB 3.97 million with a fall of 67.39% over the end of last year, which was mainly because the inventories of the Company decreased in the report period.2. Construction in progress: decreased by RMB 16.42 million with a fall of 62.67% over the end of last year. Its reason was that the construction in progress of the subsidiary Changsha SEG Development Co., Ltd. (hereinafter referred to as Changsha SEG) was completed and thentransferred into fixed assets in the report period.3. Staff salaries payable: decreased by RMB 3.09 million with a fall of 72.48% over the end of last year. Its reason was that the Company paid the staff for salaries in the report period.II. Income statement itemItem Amount in thisperiodAmount in thesame period oflast yearBalanceProportion ofchanges %Operating income 91,307,818.0567,892,989.0423,414,829.01 34.49% Operating cost 56,496,489.2231,746,485.6924,750,003.53 77.96% Operating tax and extras 3,724,614.303,012,887.52711,726.78 23.62% Sales expense 1,370,260.25906,378.64463,881.61 51.18% Losses from devaluation ofassets--1,500,000.001,500,000.00 -100.00% Investment gains -3,029,152.47-115,823,698.14112,794,545.67 -97.38% Operating profit 23,529,850.53-85,166,016.78108,695,867.31 -127.63% Non-operating income 139,079.301,620,912.10-1,481,832.80 -91.42% Non-operating expenditure 41,229.18100,985.93-59,756.75 -59.17% Total profits 23,627,700.65-83,646,090.61107,273,791.26 -128.25% Income tax expense 5,951,587.042,313,487.223,638,099.82 157.26% Net profit 17,676,113.61-85,959,577.83103,635,691.44 -120.56% Net profit attributable toowners of parent company15,759,677.99-88,214,473.65103,974,151.64 -117.87% Basic earnings per share 0.0201-0.11240.1325 -117.87% Diluted earnings per share 0.0201-0.11240.1325 -117.87% Other consolidated income 12,964,835.24-574,782.6813,539,617.92 -2355.61% Total consolidated income 30,640,948.85-86,534,360.52117,175,309.37 -135.41% Total consolidated incomeattributable to owners ofparent company28,677,057.42-88,896,727.63117,573,785.05 -132.26% 1. Operating income: increased by RMB 23.41 million with an increase of 34.49% over the same period of last year. The main reasons were i. In the report period, Changsha SEG and Changsha Hotel of Shenzhen Mellow Orange Business Hotel Management Co., Ltd. (hereinafter referred to as Mellow Orange Hotel) started operation which increased the operating income of the Company; ii. Income from Buy-it Store increased compared with the same period of last year.2. Operating cost: increased by RMB 24.75 million with an increase of 77.96% over the same period of last year. The main reason was the increase of operating income caused the increase of operating cost accordingly.3. Operating tax and extras: increased by RMB 710,000 with an increase of 23.62% over the same period of last year. The main reason was the increase of operating income caused the increase ofoperating tax and extras accordingly.4. Sales expense: increased by RMB 460,000 with an increase of 51.18% over the same period of last year. The main reason was the increase of operating income caused the increase of sales expense accordingly.5. Losses from devaluation of assets: no losses from devaluation of assets occurred in the report period, whereas that was RMB -1.5 million in the same period of last year. The main reasons was part of account receivable which had been withdrawn losses of bad debts in the same period of last year was taken back through lawsuit.6. Investment gains: increased by RMB 112.79 million over the same period of last year. The main reason was the losses of Shenzhen SEG Samsung Co., Ltd. (hereinafter referred to as SEG Samsung) in which the Company holds 22.45% of its equity decreased in the report period over the same period of last year.7. Operating profit: increased largely over the same period of last year. The main reasons were the losses of SEG Samsung in which the Company holds 22.45% of its equity decreased in the report period over the same period of last year causing a large decrease in investment losses.8. Non-operating income: decreased by RMB 1.48 million with a decrease of 91.42% over the same period of last year. The main reasons were the Company switched back the account payable which it did not need to pay in the same period of last year, but no such switch-back occurred in the report period.9. Total profits: increased largely over the same period of last year. The main reason was the same as that of Item 7.10. Income tax expense: increased by RMB 3.64 million with an increase of 157.26% over the same period of last year. The main reason was the profit payable of this report year went up and income tax rate of this report year in Shenzhen also grew.11. Net profit: increased largely over the same period of last year. The main reason was the same as that of Item 7.12. Net profit attributable to owners of parent company: increased largely over the same period of last year. The main reason was the same as that of Item 7.13. Basic earnings per share: increased largely over the same period of last year. The main reasons were the same with Item 7.14. Diluted earnings per share: increased largely over the same period of last year. The main reason was the same as that of Item 7.15. Other consolidated income: increased by RMB 13.54 million largely over the same period of last year. The main reason was in the report period, SEG Samsung in which the Company holds 22.45% of its equity received the financial support funds amounting to RMB 56 million from its shareholder Samsung Corning Investment Co., Ltd., thus RMB 12.57 million was added into other consolidated income of the Company.16. Total consolidated income: increased largely over the same period of last year. The main reasons were the same as that of Items 7 and 15.17. Total consolidated income attributable to owners of parent company: increased largely over the same period of last year. The main reason was the same as that of Items 7 and 15.III. Cash flow statement itemItem Amount in thisperiodAmount in thesame period oflast yearBalanceProportion ofchanges %Other cash receivedrelating to operating activities64,583,939.9735,621,486.0928,962,453.88 81.31% Cash paid to/for staff andworkers11,883,672.359,605,770.002,277,902.35 23.71%Other cash paid relating to53,590,151.5031,135,749.7322,454,401.77 72.12% operating activitiesCash received from0.002,198,720.24-2,198,720.24 -100.00% recovering investmentNet cash received from15,444.00141,500.00-126,056.00 -89.09% disposal of fixed, intangible andother long-term assetsNet cash received from disposal0.0034,229,363.41-34,229,363.41 -100.00% of subsidiaries and other unitsCash paid for purchasing fixed,4,591,584.05701,547.003,890,037.05 554.49% intangible and other long-termassetsCash paid for investment 0.0053,030,000.00-53,030,000.00 -100.00% 1. Other cash received relating to operating activities: increased by RMB 28.96 million with an increase of 81.31% over the same period of last year. The main reasons were i. items of newly-opened Changsha SEG and Mellow Orange Hotel in the report period and newly-increased Buy-it Store in last May increased; ii. The general cashing business was developed in the electronic market, so the goods payment received on behalf of merchants increased.2. Cash paid to/for staff and workers: increased by RMB 2.28 million with an increase of 23.71% over the same period of last year. The main reasons were in the report period, Changsha SEG and Mellow Orange Hotel started operations, and the staff in Buy-it Store added increasing the salaries payable to the staff of the three companies.3. Other cash paid relating to operating activities: increased by RMB 22.45 million with an increase of 72.12% over the same period of last year. The main reasons were i. items of Changsha SEG and Mellow Orange Hotel newly-opened in the report period and Buy-it Store newly-increased last year increased; ii. The general cashing business was developed in the electronic market, the goods payment returning to merchants increased.4. Cash received from recovering investment: decreased by RMB 2.2million over the same period of last year. The main reason was in the same period of last year, the Company reduced the shares of Shenzhen Zero-Seven Co., Ltd. held by the Company amounting to 530,000, but no such sales occurred in the report period.5. Net cash received from disposal of fixed, intangible and other long-term assets: decreased by RMB 130,000 with a decrease of 89.09% over the same period of last year. The main reasons was the amount of fixed assets disposal in the same period of last year was bigger.6. Net cash received from disposal of subsidiaries and other units: decreased by RMB 34.23 million over the same period of last year. The main reasons was in the same period of last year, the Company received the equity account on selling former subsidiaries Shenzhen SEG Communications Co., Ltd, but no such sales of subsidiary occurred in the report period.7. Cash paid for purchasing fixed, intangible and other long-term assets: increased by RMB 3.89 million with an increase of 554.49% over the same period of last year. The main reasons were: the newly-opened Changsha SEG and Mellow Orange Hotel purchased fixed assets in the report period, thus the item increased.8. Cash paid for investment: decreased by RMB 55.03 million over the same period of last year. The main reason was in the same period of last year, the Company purchased 46 percent of the equity of Changsha SEG, but no such expenditure of equity acquisition occurred in the report period.3.2 Analysis and explanation of significant events and their influence and solutions□Applicable √Inapplicable3.3 Implementations of commitments by the Company, shareholders and actual controller√Applicable □InapplicableItem of CommitmentsPromiseeContent of commitmentsImplementationCommitments on Share Merger ReformInapplicable ----Commitments on share restricted tradeInapplicable ----Commitments made in Acquisition Report or Reports on Change in EquityInapplicable ----Commitments made in MaterialAssets ReorganizationInapplicable----Commitments made in issuanceShenzhen SEG Group Co., Ltd. Article 5 of the Equity Transfer Agreement which the Company had signed with SEG Group at the time of the Company’s listing stipulated: SEG Group permits the Company, as well as its subsidiaries of theCompany and affiliated companies to use the 8 registered trademarks that SEG Group has presently registered at the StateTrademark Office; italso permits theCompany to take the aforesaid trademarks and symbols that are similar to these marks as the symbol of the Company, as well as to use the aforesaid symbols or symbols that are similar to these symbols during the operation process; the Company doesn’t have to pay SEG Group any fee for the use of the aforesaidtrademarks or symbols.In the report period, this commitmentwas still executed according to thecommitment.Other commitments (includingadditional commitments)Shenzhen SEG Group Co., Ltd. According to the problem of “Yourcompany’s existing same industry competition in theelectronic market business with SEGIn the report period, controllingshareholder abided by the above commitment.Group” pointed outby Shenzhen Securities Regulatory Bureau in 2007 at the spot investigation of the Company, the Company received written Commitment Letter from SEG Group on Sep.14, 2007 and the content was as follows: our Group has similar business in Shenzhen electronic market with Shenzhen SEG Co., Ltd. (Shenzhen SEG), and the business was resulted by history and it has objective market developmentbackground. The Group made commitment: For the future, we do not operate on the market which is similar to Shenzhen SEG singly in the same city. The aforesaid matters have been disclosed in Securities Times ,China Securities Journal and Hong Kong Wen Wei Po and Juchao Website dated Sep. 18, 2007. In the report period, the holding company observed the above commitment.3.4 Estimation of accumulative net profit from the beginning of the year to the end of next report period to be a loss probably or the warning of its material change compared with the same period of last year and explanation of its reason √Applicable □InapplicableFore-notice of performances Carry-back of lossesYear-beginning to the end of next report period The same period oflast yearChange of increase/decrease (%)Estimated amount ofaccumulative net profit(RMB’0000)Approximately 1,600.00to2,700.00-14,608.35 -- -- Basic earnings per share(RMB/Share)Approximately 0.0204 to -0.1861 -- --0.0344Explanations onfore-notice ofperformances(1) SEG Samsung in which the Company holds its equity is predicted to suffer aloss accumulatively from RMB 30 million to RMB 50 million from year-beginning toend of next report period;(2) The performance prediction has not been pre-audited by CPAs.3.5 Other significant events which need explanations3.5.1 Particulars about securities investment □Applicable √Inapplicable3.5.2 Registration form of receiving research, communication and interview in the report periodDate Place Way ObjectsDiscussed main contents andsupplied materials Jan. 6, 2010 Office of the Company Telephone communication Investors Basic information of theCompany Feb. 12, 2010 Office of the Company Telephone communication Holder of B share Basic information of theCompany Mar. 26, 2010 Office of the Company Telephone communication Holder of B share Basic information of theCompany Apr. 7, 2010Office of the CompanyEnquire in written formSecurities DailyGot to know relevant public information of the Company3.5.3 Explanations of other significant events √Applicable □InapplicableThe net profit attributable to owners of parent company disclosed in the 1st quarterly report 2009 was RMB 2.85 million, but that of the same period of last year disclosed in the report was RMB -88.21 million, with the change amount of RMB -91.06 million. The reason for such change was the net profit attributable to owners of parent company of SEG Samsung in which the Company holds 22.45% of its equity disclosed in the 1st quarterly report 2009 was RMB-122 million, whereas that of the same period of last year disclosed in 1st quarterly report 2010 was RMB -504 million. The Company calculated the investment gains from SEG Samsung based on equity method, which caused the investment losses of the same period of last year disclosed in this report of the Company increased by RMB 91.06 million over that disclosed in the 1st quarterly report of 2009.3.6 Particulars about derivatives investment □Applicable √Inapplicable3.6.1 Particulars about derivatives investment held at the end of report period □Applicable √Inapplicable§4. Appendix4.1 Balance sheetPrepared by Shenzhen SEG Co., Ltd. March 31, 2010 Unit: RMBBalance at period-end Balance at year-beginning Items Consolidation Parent Company Consolidation Parent Company Current assets:Monetary funds 498,955,096.86372,852,381.52485,135,270.94 375,350,393.53 SettlementprovisionslentCapitalTransactionassetfinancereceivableNotesAccounts receivable 17,234,225.88400,000.0018,130,631.40 1,134,357.47 Accounts paid in advance 20,037,842.341,081,095.0018,404,268.08 8,035,295.00 receivableInsurancereceivablesReinsuranceContract reserve ofreinsurance receivableInterest receivable 2,460,821.922,460,821.922,460,821.92 2,460,821.92Dividend receivableOther receivables 12,042,162.4945,095,461.3911,971,998.74 45,306,466.00 Purchase restituted financeassetInventories 1,919,437.275,886,392.39 Non-current asset duewithin one yearassetsOthercurrentTotal current assets 552,649,586.76421,889,759.83541,989,383.47 432,287,333.92 Non-current assets:Granted loans and advancesFinance asset available for4,229,970.093,548,500.003,843,571.87 3,304,100.00 salesHeld-to-maturityinvestmentLong-term accountreceivableLong-term equity129,274,947.39310,372,446.43119,732,099.86 300,829,598.90 investmentInvestment property 438,740,452.42345,143,558.87442,502,999.44 347,797,315.91 Fixed assets 210,589,972.7523,031,843.38189,516,718.30 23,314,450.93 Construction in progress 9,776,526.6826,192,075.55materialEngineeringDisposal of fixed assetassetbiologicalProductiveOil and gas assetIntangible assets 4,681,177.38610,581.394,756,432.31 651,865.38 Expense on Research andDevelopmentGoodwill 10,328,927.8210,328,927.82Long-term expenses to be 13,684,505.73961,414.0213,041,779.82 1,165,451.06apportionedDeferred income tax asset 7,586,398.995,994,015.937,586,398.99 5,994,015.93 assetnon-currentOtherTotal non-current asset 828,892,879.25689,662,360.02817,501,003.96 683,056,798.11 Total assets 1,381,542,466.011,111,552,119.851,359,490,387.43 1,115,344,132.03 Current liabilities:Short-termloansLoan from central bankAbsorbing deposit andinter-bank depositborrowedCapitalTransaction financialliabilitiespayableNotesAccounts payable 7,716,840.382,149,017.128,225,509.02 2,178,169.12Accounts received in90,214,246.1242,701,579.41105,563,890.39 65,801,272.52 advanceSelling financial asset ofrepurchaseCommission charge andcommission payableWage payable 1,172,559.9524,450.874,261,476.99 2,065,724.98 Taxes payable 26,095,556.9526,470,386.0424,421,758.66 24,773,634.49 payableInterestDividend payable 921,420.73153,403.29921,420.73 153,403.29 Other accounts payable 95,328,850.9637,415,008.7786,454,289.91 41,932,495.62 payablesReinsuranceInsurance contract reserveagencySecurity trading ofSecurity sales of agencyNon-current liabilities duewithin 1 yearliabilitiescurrentOtherTotal current liabilities 221,449,475.09108,913,845.50229,848,345.70 136,904,700.02 Non-current liabilities:loansLong-termpayableBondspayableLong-termaccountSpecial accounts payableliabilitiesProjectedDeferred income tax liabilities 22,970,034.63547,125.7123,160,034.29 547,125.71 non-currentliabilitiesOtherTotal non-current liabilities 22,970,034.63547,125.7123,160,034.29 547,125.71 Total liabilities 244,419,509.72109,460,971.21253,008,379.99 137,451,825.73 Owner’s equity (or shareholders’equity):Paid-in capital (or sharecapital)784,799,010.00784,799,010.00784,799,010.00 784,799,010.00 Capital public reserve 409,833,425.36407,164,608.41396,922,482.95 394,348,208.41 Less: Treasury stocksReasonable reserveSurplus public reserve 102,912,835.67102,912,835.67102,912,835.67 102,912,835.67 Provision of general riskRetained profit -252,672,245.53-292,785,305.44-268,431,923.52 -304,167,747.78 Balance difference offoreign currency translation-536,479.61-542,916.63Total owner’s equity attributableto parent company1,044,336,545.891,002,091,148.641,015,659,488.47 977,892,306.30 Minority shareholders’ interests 92,786,410.4090,822,518.97Total owner’s equity 1,137,122,956.291,002,091,148.641,106,482,007.44 977,892,306.30 Total liabilities and owner’sequity1,381,542,466.011,111,552,119.851,359,490,387.43 1,115,344,132.03 4.2 Profit statementPrepared by Shenzhen SEG Co., Ltd. Jan.-Mar. 2010 Unit: RMBAmount in this period Amount in last period ItemsConsolidation Parent Company Consolidation Parent Company I. Total operating income 91,307,818.0528,545,784.8967,892,989.04 28,312,781.50 Including: Operating income 91,307,818.0528,545,784.8967,892,989.04 28,312,781.50 InterestincomeInsurancegainedCommission charge andcommission incomeII. Total operating cost 64,748,815.0510,069,765.9037,235,307.68 6,271,611.87 Including: Operating cost 56,496,489.228,821,226.1931,746,485.69 6,224,508.93 InterestexpenseCommission charge andcommission expenseCash surrender valueNet amount of expense ofcompensationNet amount of withdrawalof insurance contract reserveBonus expense of guaranteeslipReinsuranceexpenseOperating tax and extras 3,724,614.301,652,232.843,012,887.52 1,426,154.86 Sales expenses 1,370,260.25906,378.64Administration expenses 6,914,893.783,749,113.976,753,654.36 3,527,096.41 Financial expenses -3,757,442.50-4,152,807.10-3,684,098.53 -3,406,148.33Losses of devaluation of asset -1,500,000.00-1,500,000.00Add: Changing income offair value (Loss is listed with“-”)Investment income (Loss is-3,029,152.47-3,029,152.47-115,823,698.14 -115,823,699.14 listed with “-”)Including: Investmentincome on affiliated companyand joint ventureExchange income (Loss islisted with “-”)III. Operating profit (Loss is23,529,850.5315,446,866.52-85,166,016.78 -93,782,529.51 listed with “-”)Add: Non-operating income 139,079.30300.001,620,912.10 1,486,477.57Less: Non-operating41,229.18100,985.93expenseIncluding: Disposal loss ofnon-current assetIV. Total Profit (Loss is listed23,627,700.6515,447,166.52-83,646,090.61 -92,296,051.94 with “-”)Less: Income tax 5,951,587.044,064,724.182,313,487.22 450,000.00V. Net profit (Net loss is listed17,676,113.6111,382,442.34-85,959,577.83 -92,746,051.94 with “-”)Net profit attributable to15,759,677.9911,382,442.34-88,214,473.65 -92,746,051.94 owner’s equity of parentcompanyMinority shareholders’ gains1,916,435.622,254,895.82and lossesVI. Earnings per sharei. Basic earnings per share 0.02010.0145-0.1124 -0.1182 ii. Diluted earnings per share 0.02010.0145-0.1124 -0.1182 VII. Other consolidated income 12,964,835.2412,816,400.00-574,782.68 -682,253.97 VIII. Total consolidated income 30,640,948.8524,198,842.34-86,534,360.51 -93,428,305.91 Total consolidated income28,677,057.4224,198,842.34-88,896,727.62 -93,428,305.91 attributable to owners of parentcompanyTotal consolidated income1,963,891.432,362,367.11attributable to minorityshareholders4.3 Cash flow statementPrepared by Shenzhen SEG Co., Ltd. Jan.-Mar. 2010 Unit: RMBAmount in this period Amount in last period ItemsConsolidation Parent Company Consolidation Parent Company I. Cash flows arising fromoperating activities:Cash received from selling76,838,162.928,489,484.2877,509,335.13 16,793,838.47 commodities and providinglabor servicesNet increase of customerdeposit and inter-bank depositNet increase of loan fromcentral bankNet increase of capitalborrowed from other financialinstitutionCash received fromoriginal insurance contract feeNet cash received fromreinsurance businessNet increase of insuredsavings and investmentNet increase of disposal oftransaction financial assetCash received from interest,commission charge andcommissionNet increase of capitalborrowedNet increase of returnedbusiness capitalWrite-back of tax receivedOther cash receivedrelating to operating activities64,583,939.9735,796,951.0335,621,486.09 34,108,393.77 Subtotal of cash inflowarising from operating activities141,422,102.8944,286,435.31113,130,821.22 50,902,232.24 Cash paid for purchasingcommodities and receivinglabor service34,506,524.285,428,566.4833,515,780.98 4,689,090.60Net increase of customerloans and advancesNet increase of deposits incentral bank and inter-bankCash paid for originalinsurance contractcompensationCash paid for interest,commission charge andcommissionCash paid for bonus ofguarantee slipCash paid to/for staff andworkers11,883,672.355,234,585.349,605,770.00 4,602,269.51 Taxes paid 23,601,020.7018,545,462.2824,959,921.99 18,464,019.40 Other cash paid relating tooperating activities53,590,151.5017,876,799.3431,135,749.73 14,893,005.25Subtotal of cash outflowarising from operating activities123,581,368.8347,085,413.4499,217,222.70 42,648,384.76Net cash flows arisingfrom operating activities17,840,734.06-2,798,978.1313,913,598.52 8,253,847.48II. Cash flows arising frominvesting activities:Cash received from recovering investment 2,198,720.242,198,720.24Cash received frominvestment income5,270,590.49 Net cash received from 15,444.00141,500.00。
中国对双酚A实施反倾销存在的问题及改进措施

中国对双酚A实施反倾销存在的问题及改进措施作者:宋飞翔宋庆丽来源:《对外经贸实务》 2013年第12期宋飞翔宋庆丽河北经贸大学双酚A是采用苯酚和丙酮为原料,在催化剂作用下反应生成的一种有机化工产品,主要用于生产环氧树脂、聚碳酸酯、阻燃剂。
长期以来,中国国内市场双酚A主要靠进口满足需求,进口量占比一直在50%以上。
2001年,国内双酚A表观消费量10.6万吨,其中净进口9.4万吨,进口量占88.7%。
我国双酚A首次大规模出口是在2004年3月,蓝星新材料无锡树脂厂向韩国出口2000吨双酚A,是国内双酚A产业达到国际水平的一个标志,当时国内双酚A生产厂家只有蓝星新材料公司和天津双孚精细化工有限公司两家企业,产能5.1万吨/年。
随着国内环氧树脂快速发展及聚碳酸酯装置的陆续投产,国内双酚A需求不断增加,进口量不断攀升:2012年,国内双酚A产能62万吨/年,产量34.1万吨,进口53.9万吨;出口334吨;消费量88万吨,进口量占61.3%。
一、国内双酚A企业提起反倾销的过程国内双酚A产业起步较晚,规模较小,技术落后,部分国外企业为占领中国市场以倾销方式进入国内市场,对国内双酚A产业造成实质损害,使国内企业蒙受巨大损失。
2004年3月12日,蓝星化工新材料股份有限公司代表中国双酚A产业依法向反倾销调查机关提起对原产于日本、俄罗斯、新加坡、韩国和台湾地区的进口双酚A产品进行反倾销调查,天津双孚精细化工有限公司作为支持企业提供相关证据。
2004年5月12日,商务部决定对从日本、俄罗斯、新加坡、韩国和台湾地区进口的双酚A进行反倾销调查。
2005年9月28日,申请人蓝星化工新材料股份有限公司向商务部提出撤消其双酚A反倾销调查申请,并请求终止双酚A反倾销调查。
根据《中华人民共和国反倾销条例》第二十七条规定,商务部自2005年11月7日起终止反倾销调查。
2006年7月10日,商务部又收到蓝星化工新材料股份有限公司代表国内双酚A产业提交的反倾销调查申请,请求对原产于日本、韩国、新加坡和台湾地区的进口双酚A进行反倾销调查。
氢气的制取与固体储集研究进展
天 然 气 工 业Natural Gas Industry 第41卷第4期2021年4月· 124 ·氢气的制取与固体储集研究进展王璐1,2 金之钧1,2,3 黄晓伟41.北京大学能源研究院2.北京大学地球与空间科学学院3. 中国石化石油勘探开发研究院4.中国地质大学(北京)能源学院摘要:氢气是一种优质燃料,也是一种清洁和可持续的能源。
目前全球氢能发展已迈入新的阶段,欧美日韩和我国都在加紧战略布局。
为了加快构建清洁低碳、安全高效的能源体系,通过文献调研的方式研究了氢气在地下的生成机制及分布、氢气的人工制取及储集尤其是固体储氢等若干问题。
研究结果表明:①氢气在地下的生成机制目前尚未明确,被认为主要与超镁铁质岩的蛇纹石化有关,此外也与水的辐射分解、断层机械摩擦等有关,氢气浓度高的气田主要分布在大陆裂谷系、火山岩广泛分布的沉积盆地等;②目前工业制氢主要采用甲烷气制氢和电解水制氢,而最理想的方法则应为太阳能制氢和生物制氢,但在目前的技术条件下还难以达成,实验室在一定的温度、压力条件下可以通过橄榄岩的蛇纹石化得到氢气;③固体储氢是通过吸附氢气或使氢气与材料反应来达到储氢目的的方式,然后通过加热或减压方式来释放氢气;④固态储氢密度可达相同温度、压力条件下气态储氢的1 000倍左右,能很好地解决传统储氢密度低的问题且吸放氢速度适宜,具有安全性高的优点,目前的固态储氢材料主要有碳质储氢材料、合金储氢材料和络合物储氢材料等。
结论认为,氢能产业目前在我国尚处于起步阶段,技术和成本是决定制氢和储氢的关键因素;基于现状,应将氢能与可再生能源技术有机结合,以实现“灰氢”到“绿氢”的转化。
关键词:氢能;蛇纹石化;天然氢气;制氢;固体储氢;合金储氢;络合物储氢;储氢密度DOI: 10.3787/j.issn.1000-0976.2021.04.014Research progress on hydrogen production and solid hydrogen storageWANG Lu1, 2,JIN Zhijun1,2,3, HUANG Xiaowei4(1. Institute of Energy, Peking University, Beijing 100871, China;2. School of Earth and Space Sciences, Peking University, Beijing 100871, China;3. Sinopec Exploration & Production Research Institute, Beijing 100083, China;4. School of Energy Resources, China University of Geosciences, Beijing 100083, China)Natural Gas Industry, Vol.41, No.4, p.124-136, 4/25/2021. (ISSN 1000-0976; In Chinese)Abstract: Hydrogen is a kind of high-quality fuel, as well as a kind of clean and sustainable energy. At present, global hydrogen energy development has entered a new stage, and Europe, America, Japan, South Korea and China are stepping up their strategic layout. In or-der to establish a low-carbon, clean, safe and efficient energy system as soon as possible, this paper studied the generation mechanisms and distribution of hydrogen underground, the artificial hydrogen production and storage (especially solid hydrogen storage) and other problems by means of literature research. And the following research results were obtained. First, the generation mechanism of hydrogen underground is not clarified yet, but it is deemed to be mainly related to the serpentinization of ultramafic rocks, as well as the radiation decomposition of water and the mechanical friction of faults. The gas fields with high hydrogen concentration are mainly distributed in continental rift systems and sedimentary basins where volcanic rocks are widely distributed. Second, at present, the industrial hydrogen production is mainly based on methane gas and electrolysis water, but the most ideal methods should be solar hydrogen production and biological hydrogen production, which can be hardly achieved under the current technical conditions. Hydrogen can be produced by the serpentinization of peridotite under certain temperature and pressure in the laboratory. Third, solid hydrogen storage is realized by ab-sorbing hydrogen or making hydrogen react with materials and then releasing it through heating or depressurization. Fourth, the density of solid hydrogen storage is about 1 000 times that of gas hydrogen storage under the same temperature and pressure, so solid hydrogen storage can well solve the problem of low density of traditional hydrogen storage. Moreover, it has the advantages of appropriate hydro-gen absorption and desorption rate and high safety. The current solid hydrogen storage materials mainly include carbon hydrogen storage materials, alloy hydrogen storage materials and complex hydrogen storage materials. In conclusion, hydrogen energy industry is currently in the beginning stage in China, and technology and cost are the key factors of hydrogen production and storage. In view of current situa-tions, it is necessary to combine hydrogen energy with renewable energy technologies, so as to realize the transformation of "grey hydro-gen" into "green hydrogen".Keywords: Hydrogen energy; Serpentinization; Natural hydrogen; Hydrogen production; Solid hydrogen storage; Alloy hydrogen stor-age; Complex hydrides; Hydrogen storage density基金项目:国家重点研发计划变革性技术关键科学问题重点专项项目“俯冲带深部过程与非生物成气”(编号:2019YFA0708500)。
百川资讯《2010年(第三届)中国炭素产业链市场研讨会暨供需见面会》成功举办

东丽总裁 A ir i au说 :“0 0年炭纤维供应量可 kh oNk k i k 21
能 出 现缺 口。 们 必须 考 虑 在近 期扩 大 产 能 。 他 在 8月初 宣 我 ” 布公 司 一季 度业 绩 时 透 露 , 他可 能增 加 资 本 投入 。公 司季 度 资产 负债 表 显示 ,炭 纤维 销 售额 17亿 日元 ,同 比增 长 大约 5 5 % 。 财年 的 受益 预 期 显 示 , 维 销 售增 加 , 明 需求 在 0 本 炭纤 说
纳米 管 附 着 在表 面 , 后将 这 种 材 料造 成球 形 。 之 摘 自《 国化 工 报 》 中
年 为他 们提 供 飞机 零 部 件 , 东丽 将 从 明年 起 启 动爱 媛 县 工 厂
的生 产 。
百川资 讯<oo年 ( < 1 2 第三届 ) 中国炭素产 业链市 场
研讨 会暨供 需见面会》 功举 办 成
外, 在新 型 纺织 机 械 、 炭纤 维 复 合 芯 电缆 、 田钻 探 、 力 发 油 风
有 限公 司倾 情 赞 助 ,来 自中电 投青 海 黄 河 水利 有 限公 司 、 河
南中孚实业股份有限公司 、 邯郸市鑫宝煤 化工有限公司 、烟
台市 翔宇 物 资 有 限公 司 、中石 化 上海 沥青 销 售 分 公 司 、 庆 大 石 化 、 顺 石 化 、 西 石化 、 抚 锦 吉林 石 化 、 河 石 化 、 阳 石化 、 辽 辽
与 此 同时 ,帝 人 有 限公 司 的 附属 东 邦滕 克 斯 公 司今 年 6
月取 得 一 些业 务 进展 ,与 欧 洲航 空 防 务及 航 天 公 司 (A S ED)
和加 拿 大 的庞 巴迪 签订 供 货合 同 , 些 公 司生 产 区域 客机 。 这 但 是 , 纤维 的 业 务增 长 也有 困难 ,即成 本 和原 料 加 工 炭 难度 。 摘 自《 国碳 纤 维 网》 中
GF测井技术

SIS (中国)信息简讯2010. 12(测井专刊)目录1 新产品发布Techlog 2010 新产品介绍2 技术交流-GeoFrame测井软件使用技巧GeoFrame技术交流一利用BorTex模块进行砾岩粒度分布研究GeoFrame技术交流二快速划分油气水层和输出解释成果表GeoFrame技术交流三如何利用WellEdit对成像处理和解释结果进行校深Techlog软件是为井筒数据解释提供的智能的特殊设计。
引导所有的井筒数据进入单一的图形环境,实现高水平的岩芯数据、测井数据、图像数据和相关数据的分析研究,提高了地质模型的解释精度,量化结果和管理不确定性,也为油藏工程师、地球物理工程师和地质家提供优化的和相关的静态模型,是致力于油藏描述研究的完善的处理和建模的工具箱。
经过很多石油公司的使用验证,Techlog软件能为用户的测井数据及岩芯信息提供创新的和有效的岩石物理分析并创造最大的价值。
主要特点:∙用户界面友好,易学易用∙全面交互设计,图形化操作∙灵活的便携性:服务器和客户机之间转移License∙先进的岩石物理评价方法∙提供高精度的井筒数据分析∙扩大交叉领域工作流程的需求∙快速连接外部世界∙保护投资创造更多价值运行环境:操作系统:WindowsXP(32和64位),Vista(32和64位),Windows7 (32和64位)硬件配置:3G内存(用于处理岩芯和成像等数据)Techlog是基于功能强大的Platform平台之上的拥有一系列Application应用模块的软件,应用模块可以增加到平台中来适应特殊的需求和目标,平台模块是应用模块的基础,包含了很多工具包,针对大量的数据进行处理、显示、操作等,同时可以客户化平台。
Platform平台模块特点提供高水平的全面管理所有井筒数据的工具,在一个先进的图形化和交互式的环境中,完成输入、输出、编辑和显示各种井筒数据,增加了更加广泛的功能像(环境校正,实时访问等),几种新的链接提高了快速访问外部世界的能力,包括在Techlog和Petrel之间双向的数据交换。
我国对外贸易的问题及对策

我国对外贸易的主要问题及对策摘要随着欧债危机的影响持续扩散,全球整体经济环境或将继续恶化,各国纷纷采用各种货币政策和财政政策以应对本国的经济衰退,但收效甚微。
由于国际经济环境的负面影响,加之国内经济的自主回落、内需放缓等原因,致使国内的经济环境也出现了新的变化,因此我国的对外贸易又将面临着新的挑战。
在国内外如此复杂的经济环境的背景之下,通过对我国经济运行环境的分析,提出我国现阶段对外贸易所面临的问题,剖析我国对外贸易所面临问题的原因,并提出与其相应的对策,对改善我国的外贸现状具有重要的现实意义。
关键字:对外贸易,问题,原因,对策目录摘要 (Ⅰ)一、绪论 (1)二、我国近年来对外贸易发展的现状及特点 (1)(1)进出口增速回落较快,贸易基本平衡 (1)(2)对欧出口负增长,与新兴市场贸易增长较快 (2)(3)劳动密集型产品出口比降低,机电产品出口增长平稳 (2)(4)民营企业对出口增量贡献过半,加工贸易增长乏力 (3)三、我国对外贸易发展过程中存在的主要问题及负面影响 (3)(1)世界经济复苏的不确定性和不稳定性对我国贸易的影响 (3)(2)我国外贸在结构调整转型期所存在的问题 (4)(3)成本上升对我国外贸的影响 (5)(4)本币升值对我国外贸的影响 (5)四、我国对外贸易问题的原因分析 (6)(1)主要贸易伙伴需求萎缩的原因分析 (6)(2)我国不断遭遇贸易保护主义的原因分析 (7)(3)我国外贸在结构调整转型期所存在问题的原因分析 (7)(4)成本上升的原因分析 (8)(5)本币升值的原因分析 (8)五、我国对外贸易问题的对策及建议 (9)(1)调整国内经济结构,拉动内需 (9)(2)完善贸易制度应对贸易保护主义 (9)(3)优化外贸结构,促进转型升级 (10)(4)顺应成本上升趋势,寻求自身突破 (10)(5)完善汇率改革制度,增强企业抗风险能力 (10)六、结论 (11)参考文献 (11)致谢 (13)一、绪论随着全球经济一体化的进程不断加快,国际贸易的环境也随之发生着巨大的变化。
The amount of water removed adjustment for meterin

专利名称:The amount of water removed adjustment for metering pump发明人:辻 剛,中野 浩臣申请号:JP2004166566申请日:20040604公开号:JP3763099B2公开日:20060405专利内容由知识产权出版社提供摘要:PROBLEM TO BE SOLVED: To provide a metering pump for adjusting a water removing quantity which intentionally removes the water accumulated in a body in hemodialysis, accurately measures the amount of a dialysis fluid supplied to a dialyzer, does not cause fluctuation in the gap between a cylinder and a piston by making it to a structure not to cause a shaft core to wobble at the time of vertical motion of the piston, in particular for securing a durability of a flexible septum material, and can secure reliability for use over a long period.SOLUTION: A motor 2 of which the motor shaft 2a is directed upward is fixed at the lower part of the cylinder 1, and a ball screw 14 is connected to the driving shaft 13 of the motor 2. A ball nut 9 which screw threaded to a spiral screw groove 14a formed on the outer periphery of the ball screw 14 via a ball 15 is fixed to the lower part of the piston 7. The piston 7 is advanced and retreated in the direction of a cylinder head part1a by rotating the ball screw 14 by driving of the motor shaft 2a, and the water removing quantity is measured by the volume change of a volume measuring chamber R1 caused by this.COPYRIGHT: (C)2006,JPO&NCIPI申请人:株式会社メテク地址:東京都板橋区舟渡1丁目7番3号国籍:JP代理人:谷山 守更多信息请下载全文后查看。
- 1、下载文档前请自行甄别文档内容的完整性,平台不提供额外的编辑、内容补充、找答案等附加服务。
- 2、"仅部分预览"的文档,不可在线预览部分如存在完整性等问题,可反馈申请退款(可完整预览的文档不适用该条件!)。
- 3、如文档侵犯您的权益,请联系客服反馈,我们会尽快为您处理(人工客服工作时间:9:00-18:30)。
Pages: 267Tables and figures: 221Published date: Mar 31,2010Contact: Mr. chenhui Wu 86-10-64627843; 86-136********, wch@Summary《2010 Deep Research Report on China Wind Turbine Industry》was published by QYResearch Wind Energy Research Center on Mar 2010. It was a professional and depth research report on China Wind Turbine industry. In the report, the following information will be included:China Wind Turbine Production Supply Sales Demand marketing and technology (equipment) information;China Wind Turbine production and demand from 2009-2014;China Top 18 Wind Turbine manufacturers Wind Turbine Capacity Production Cost Average selling price Production Value Revenue Profit etc information;China Wind Turbine industry development trend and related conclusions; Finally, we conduct a comprehensive summary of China Wind Turbine industry, including the past present and forecast the future, we also make a feasibility analysis of 1000sets/year Wind Turbine project ,we carry out an accurate calculation on investment cost, revenue, profitability, payback period. In a word, it was a depth research report on china Wind Turbine industry chain. And thanks to the China Wind Turbine marketing or technology experts help and support during QYResearch Wind Energy team survey and interviews.Table of Content:Chapter One Wind Turbine Industry Background 11.1 The principle of wind power 11.2 The cost of wind power 11.3 Wind power generation policies and regulations 51.3.1 Global Wind power generation policies and regulations Overview 5 1.3.2 Governments Wind power support policies and measures 61.3.3 China Wind power policies and measures 111.4 Development of wind power 151.4.1 Global wind power development 151.4.2 China Wind Power Development Status 181.5 Wind power equipment industry problems and development direction 19 1.5.1 Wind power equipment industry problems 191.5.2 Wind power equipment industry development direction 211.6 Research on wind power grid 271.6.1 Wind power Grid-connected method 271.6.2 Impact of Wind power grid connected analysis 301.6.3 Wind power grid connected Economic Analysis 311.6.4 Analysis of technical requirements of wind power grid connected 34 1.6.5 Non-grid wind power development and feasibility analysis 39Chapter Two Wind Turbine Industry Overview 452.1 Wind power equipment industry Chain overview 452.2 Wind Turbine Structure 512.3 Wind Turbine Classification 55Chapter Three China Wind Turbine Productions Supply Sales Demand Market Status and Forecast573.1 Wind Turbine Productions Overview 573.2 Wind Turbine Demand 603.3 Supply and Demand of China Wind Turbine 1023.4 Cost Price Value Profit Margin of China Wind Turbine 103Chapter Four China Wind Turbine Key Manufacturers 1074.1 Sinovel(Beijing 1.5MW 3.0MW)1074.2 Goldwind(Xinjiang 750KW 1.5MW 2.5MW)1164.3 DEC(600875 1.5MW) 1284.4 Guo dian United Power(Baoding Lianyungang)1354.5 Mingyang(Guangdong 1.5MW 3.0MW)1404.6 Vestas(Denmark Tianjin 2.0MW 850KW) 1464.7 Hara XEMC Windpower CO.LTD(Hunan 2.0MW Direct-drive wind turbine) 1574.8 GE Wind(USA Shenyang 1.5MW)1634.9 Suzlon(India Tianjin 1.25MW 1.5MW)1684.10 Gamesa(Spain Tianjin 850KW 2.0MW)1774.11 Windey(Zhejiang 750KW 800KW 1.5MW)1874.12 Shanghai Electric Wind Co.,Ltd(Shanghai 1.25MW 2.0MW) 1974.13 China Creative wind energy(Shenyang 1.5MW)2034.14 CASC-Acciona(Jiangsu 1.5MW)2084.15 New Unite(Jiangsu 1.5MW 2.0MW)2164.16 Beijing Beizhong Steam Turbine Generator Co.,Ltd(Beijing 2.0MW)2214.17 Nordex(Germany Yinchuan 1.5MW)2264.18 Hewind(Zhejiang 600290)2354.19 Other Wind turbine Manufactures 2394.19.1 Baoding Huide Wind Power Engineering Co., Ltd(Baoding)2394.19.2 CSIC Haizhuang Windpower Equipment Co., Ltd.,(Chongqing 2MW 850KW AERODYN)2404.19.3 Yinhe wind power(Guangxi Changzheng Electric)2414.19.4 Tianwei Baobian(Baoding 600550)2414.19.5 Shenyang Yuanda(Liaoning) 2424.19.6 Sino steel(Xi’an)2444.19.7 Ningxia Yixing energy Co.,Ltd(Ningxia 000862) 2474.19.8 Envision Energy(Jiangsu Denmark)2504.19.9 SANY 2514.19.10 Repower 252Chapter Five Feasibility Analysis of China New Wind Turbine Projects 2535.1 Opportunity and Risk of China Wind Turbine Projects 2535.2 Feasibility Analysis of Wind Turbine project 254Chapter Six Wind Turbine Industry Research Conclusions 257Tables and Figures:Figure The principle of wind power 1Figure Structure of wind power cost 2Figure Forecast of China wind power cost 2Figure Wind power Electricity price Structure 3Figure Comparison of Wind power and coal-generated electricity price 3Table Various forms of power generation (hydro, thermal power, nuclear power, wind power, photovoltaic power generation, etc.) Cost and electricity price List 3Table Comparison of Wind power and photovoltaic industries 4Table USA Wind power policies and measures List 6Table Germany Wind power policies and measures List 7Table Denmark Wind power policies and measures List 8Table Netherlands Wind power policies and measures List 9Table UK Wind power policies and measures List 9Table Spain Wind power policies and measures List 10Table Canada Wind power policies and measures List 11Table Japan Wind power policies and measures List 11Table India Wind power policies and measures List 11Figure National wind power policy framework 13Table 2009 China wind power policy adjustments and impact list 14Figure 2001—2009 Global wind power Cumulative installed capacity (MW) and Growth rate 15 Figure 2001—2009 Global wind power new installed capacity (MW) and Growth rate 16 Table 2009 Global 45 countries wind power installed capacity(MW)List 17Figure 2009 China 24 provinces new and cumulative wind power installed capacity (MW) List 18 Table Wind power equipment production quality problems and solutions List 19Figure Single Wind turbine capacity trends 21Table China Wind turbine manufacturers product certification List 24Table China high-capacity, multi-MW Wind Turbine development List 26Table Wind power Grid-connected method List 27Table Synchronous generators and network operation control list 27Table Induction generator and network operation control list 28Table VSCF wind turbine Grid-connected operation control list 29Table doubly-fed generator system grid connected list 29Table Wind farm impact on power grid list 30Figure Wind Turbine industry Chain 45Table Wind turbine industry chain (Blade Bearing gearbox Electronic Control System Generators Wind farm operators, etc.) companies List 45Table Wind turbine components cost share List 46Table Wind power industry listed companies and introduction List 48Figure Wind power projects certified testing process 51Figure Structure of Wind turbine 52Figure Doubly-fed wind turbine internal structure group 53Figure Permanent magnet direct-drive wind turbine internal structure 54Figure Hybrid (semi-direct-drive) wind turbine internal structure 54Figure Comparison of Doubly-fed wind turbine and Permanent magnet wind turbine 55Table Domestic major wind turbine manufactures MW level and above wind turbine technologies List 55Table 2009-2014 China Top 18 Wind Turbine Manufacturers Capacity (MW) and Total Capacity List 57Table 2009-2014 China Top 18 Wind Turbine Manufacturers Capacity (MW) Market Share List58Table 2009-2014 China Top 18 Wind Turbine Manufacturers Production (MW) and China Total Production List 58Table 2009-2014 China Top 18 Wind Turbine Manufacturers Production (MW) Market Share List59Table China 1st 2nd 3rd 4th 5th Round Wind Power Concession Projects Bidding Result List 60Table 2005 China 26 Wind Farm Wind Turbine Partner and Installed Capacity (KW) List 61Table 2006 China 52 Wind Farm Wind Turbine Partner and Installed Capacity (KW) List 62Table 2007 China 104 Wind Farm Operator Wind Turbine Partner and Installed Capacity (KW) List 64Table 2008 China 201 Wind Farm Operator Wind Turbine Partner and Installed Capacity (KW) List 70Table 2009 China New Wind Farm Operator Wind Turbine Partner and Installed Capacity (KW) List 83Table 2010 China all wind farm projects under construction List 83Table The Seven Reasons of China High Speed Wind Power Development 92Table China Wind Solar Waterpower Firepower Nuclear power etc Power Cost andGrid-Connected Power Price (RMB/KWH) List 93Table China Government Wind Energy Support Policies List 93Table National Development and R eform Commission ‘s new benchmark on-grid wind power price List 95Figure Analysis of new on-grid wind power price mechanism impacts on wind power equipment manufacturers and wind farm operators 96Figure 2009-2014 China Wind power Annual New Installed Capacity (MW) and growth rate 101Figure 2009-2014 China Wind Turbine Demand (MW) and Growth Rate 102Table 2009-2014 China Wind Turbine Production.Demand. Shortage (MW) List 102Table 2009-2014 750KW Wind turbine (Tower blade wheel bearings gear box, etc.)Detailed cost List 103Figure 750KW Wind turbine Cost structure 104Table 2009-2014 750KW Wind turbine Cost Price(10K RMB/set)Profit Margin List 104Table 2009-2014 1.5MW Wind turbine(Tower blade wheel bearings gear box, etc.)Detailed cost List 104Figure 1.5MW Wind turbine Cost structure 105Table 2009-2014 1.5MW Wind turbine Cost Price(10K RMB/set)Profit Margin List 105Table 2009-2014 2.0MW Direct Drive Wind turbine(Tower blade wheel bearings gear box, etc.)Detailed cost List 105Figure 2.0MW Direct-drive wind turbine Cost structure 106Table 2009-2014 2.0MW Permanent magnet direct-drive wind turbine Cost Price(10K RMB/set)Profit Margin List 106Table Sinovel Company Information (Products, Revenue, Suppliers,Clients and orders,Contract, Production plants, Expansion Plan, Contacts etc 15 items) 107Table 2009-2014 Sinovel Wind turbine Capacity Production(MW)List 109Figure 2009-2014 Sinovel Wind turbine Capacity Production(MW)and growth rate 110Table 2009-2014 Sinovel wind turbine Capacity Utilization ratio Sales(MW)List 110Table 2009-2014 Sinovel SL1500 1.5MW Wind turbine Sales(set)Price(10K RMB/set)Cost(10K RMB/set)Revenue(10K RMB)Profit Margin List 110Figure 2009-2014 Sinovel SL1500 1.5MW Wind turbine sales(set) and growth rate List 111Table 2009-2014 Sinovel SL3000 3.0MW Wind turbine Sales(set)Price(10K RMB/set)Cost(10K RMB/set)Revenue(10K RMB)Profit Margin List 111Figure 2009-2014 Sinovel SL3000 3.0MW Wind turbine sales(set) and growth rate List 112Table Sinovel all wind turbine installed Wind farm Location Owners Capacity Number Models Lifting time List 112Table Goldwind Company Information (Products, Revenue, Suppliers,Clients and orders,Contract, Production plants, Expansion Plan, Contacts etc 15 items) 116Table 2009-2014 Goldwind Wind turbine Capacity Production(MW)List 120Figure 2009-2014 Goldwind Wind turbine Capacity Production(MW)and growth rate 121Table 2009-2014 Goldwind Capacity Utilization ratio Sales(MW)List 121Table 2009-2014 Goldwind 750KW Wind turbine Sales(set)Price(10K RMB/set)Cost(10KRMB/set)Revenue(10K RMB)Profit Margin List 121Figure 2009-2014 Goldwind 750KW Wind turbine sales(set) and growth rate List 122Table 2009-2014 Goldwind 1.5MW Wind turbine Sales(set)Price(10K RMB/set)Cost(10KRMB/set)Revenue(10K RMB)Profit Margin List 122Figure 2009-2014 Goldwind 1.5MW Wind turbine sales(set) and growth rate List 123Table Goldwind all wind turbine installed Wind farm Location Owners Capacity Number Models Lifting time List 123Table DEC Company Information (Products, Revenue, Suppliers,Clients and orders,Contract, Production plants, Expansion Plan, Contacts etc 15 items) 128Table 2009-2014 DEC Wind turbine Capacity Production(MW)List 131Figure 2009-2014 DEC Wind turbine Capacity Production(MW)and growth rate 132Table 2009-2014 DEC Capacity Utilization ratio Sales(MW)List 132Table 2009-2014 DEC FD70/77 1.5MW Wind turbine Sales(set)Price(10K RMB/set)Cost(10K RMB/set)Revenue(10K RMB)Profit Margin List 132Figure 2009-2014 DEC FD70/77 1.5MW Wind turbine sales(set) and growth rate List 133Table DEC all wind turbine installed Wind farm Location Owners Capacity Number Models Lifting time List 133Table Guo dian United Power Company Information (Products, Revenue, Suppliers,Clients and orders,Contract, Production plants, Expansion Plan, Contacts etc 15 items) 135Table 2009-2014 Guo dian United Power Wind Turbine Capacity Production(MW)List 138Figure 2009-2014 Guo dian United Power Wind Turbine Capacity Production(MW)and growth rate 138Table 2009-2014 Guo dian United Power Capacity Utilization ratio Sales(MW)List 138Table 2009-2014 Guo dian United Power 1.5MW Wind Turbine Sales(set)Price(10K RMB/set)Cost(10K RMB/set)Revenue(10K RMB)Profit Margin List 139Figure 2009-2014 Guo dian United Power 1.5MW Wind Turbine sales(set) and growth rate List 139Table Guo dian United Power all wind turbine installed Wind farm Location Owners Capacity Number Models Lifting time List 140Table Mingyang Company Information (Products, Revenue, Suppliers,Clients and orders,Contract, Production plants, Expansion Plan, Contacts etc 15 items) 140Table 2009-2014 Mingyang Wind turbine Capacity Production(MW)List 144Figure 2009-2014 Mingyang Wind turbine Capacity Production(MW)and growth rate 144Table 2009-2014 Mingyang Capacity Utilization ratio Sales(MW)List 144Table 2009-2014 Mingyang MY1.5S/SE Wind turbine Sales(set)Price(10K RMB/set)Cost(10K RMB/set)Revenue(10K RMB)Profit Margin List 145Figure 2009-2014 Mingyang MY1.5S/SE Wind turbine sales(set) and growth rate List 145Table Mingyang all wind turbine installed Wind farm Owners Number Models Lifting time List 146Table Vestas Company Information (Products, Revenue, Suppliers,Clients and orders,Contract, Production plants, Expansion Plan, Contacts etc 15 items) 146Table 2009-2014 Vestas China Wind Turbine Capacity Production(MW)List 151Figure 2009-2014 Vestas China Wind Turbine Capacity Production(MW)and growth rate 152Table 2009-2014 Vestas China Capacity Utilization ratio Sales(MW)List 152Table 2009-2014 Vestas China 2.0MW Wind Turbine Sales(set)Price(10K RMB/set)Cost(10K RMB/set)Revenue(10K RMB)Profit Margin List 152Figure 2009-2014 Vestas China V80-2.0MW Wind Turbine sales(set) and growth rate List 153Table 2009-2014 Vestas China 850KW Wind Turbine Sales(set)Price(10K RMB/set)Cost(10K RMB/set)Revenue(10K RMB)Profit Margin List 153Figure 2009-2014 Vestas China V52/60-850KW Wind Turbine sales(set) and growth rate List 154Table Vestas all wind turbine installed Wind farm Location Owners Capacity Number Models Lifting time List 154Table XEMC Company Information (Products, Revenue, Suppliers,Clients and orders,Contract, Production plants, Expansion Plan, Contacts etc 15 items) 157Table 2009-2014 XEMC Wind Turbine Capacity Production(MW)List 160Figure 2009-2014 XEMC Wind Turbine Capacity Production(MW)and growth rate 161Table 2009-2014 XEMC Capacity Utilization ratio Sales(MW)List 161Table 2009-2014 XEMC 2.0MW Permanent magnet direct drive Wind Turbine Sales(set)Price (10K RMB/set)Cost(10K RMB/set)Revenue(10K RMB)Profit Margin List 161Figure 2009-2014 XEMC 2.0MW Permanent magnet direct drive Wind Turbine sales(set) and growth rate List 162Table XEMC all wind turbine installed Wind farm Location Owners Capacity Number Models Lifting time List 162Table GE Wind Energy Company Information (Products, Revenue, Suppliers,Clients and orders,Contract, Production plants, Expansion Plan, Contacts etc 15 items) 163Table 2009-2014 GE Wind China Wind Turbine Capacity Production(MW)List 165Figure 2009-2014 GE Wind China Wind Turbine Capacity Production(MW)and growth rate 166Table 2009-2014 GE Wind China Wind Capacity Utilization ratio Sales(MW)List 166Table 2009-2014 GE Wind China Wind 1.5MW Wind Turbine Sales(set)Price(10K RMB/set)Cost(10K RMB/set)Revenue(10K RMB)Profit Margin List 166Figure 2009-2014 GE Wind China Wind 1.5MW Wind Turbine sales(set) and growth rate List 167Table GE Wind China all wind turbine installed Wind farm Location Owners Capacity Number Models Lifting time List 167Table Suzlon Company Information (Products, Revenue, Suppliers,Clients and orders,Contract, Production plants, Expansion Plan, Contacts etc 15 items) 169Table 2009-2014 Suzlon China Wind Turbine Capacity Production(MW)List 173Figure 2009-2014 Suzlon China Wind Turbine Capacity Production(MW)and growth rate 173Table 2009-2014 Suzlon China Capacity Utilization ratio Sales(MW)List 173Table 2009-2014 Suzlon China S64-1.25 MW Wind Turbine Sales(set)Price(10K RMB/set)Cost(10K RMB/set)Revenue(10K RMB)Profit Margin List 174Figure 2009-2014 Suzlon China S64-1.25 MW Wind Turbine sales(set) and growth rate List 174Table 2009-2014 Suzlon China S82-1.5 MW Wind Turbine Sales(set)Price(10K RMB/set)Cost(10K RMB/set)Revenue(10K RMB)Profit Margin List 174Figure 2009-2014 Suzlon China S82-1.5 MW Wind Turbine sales(set) and growth rate List 175Table Suzlon all wind turbine installed Wind farm Location Owners Capacity Number Models Lifting time List 175Table Gamesa Company Information (Products, Revenue, Suppliers,Clients and orders,Contract, Production plants, Expansion Plan, Contacts etc 15 items) 177Table 2009-2014 Gamesa China Wind Turbine Capacity Production(MW)List 180Figure 2009-2014 Gamesa China Wind Turbine Capacity Production(MW)and growth rate 181Table 2009-2014 Gamesa China Capacity Utilization ratio Sales(MW)List 181Table 2009-2014 Gamesa G52/58-850 KW Wind Turbine Sales(set)Price(10K RMB/set)Cost (10K RMB/set)Revenue(10K RMB)Profit Margin List 181Figure 2009-2014 Gamesa G52/58-850 KW Wind Turbine sales(set) and growth rate List 182Table 2009-2014 Gamesa G80/87-2.0 MW Wind Turbine Sales(set)Price(10K RMB/set)Cost (10K RMB/set)Revenue(10K RMB)Profit Margin List 182Figure 2009-2014 Gamesa G80/87-2.0 MW Wind Turbine sales(set) and growth rate List 183Table Gamesa all wind turbine installed Wind farm Location Owners Capacity Number Models Lifting time List 183Table Zhejiang Windey Company Information (Products, Revenue, Suppliers,Clients and orders,Contract, Production plants, Expansion Plan, Contacts etc 15 items) 188Table 2009-2014 Windey Wind turbine Capacity Production(MW)List 191Figure 2009-2014 Windey Wind turbine Capacity Production(MW)and growth rate 192Table 2009-2014 Windey Capacity Utilization ratio Sales(MW)List 192Table 2009-2014 Windey WD49/50-750 Wind turbine Sales(set)Price(10K RMB/set)Cost(10K RMB/set)Revenue(10K RMB)Profit Margin List 192Figure 2009-2014 Windey WD49/50-750 Wind turbine sales(set) and growth rate List 193Table 2009-2014 Windey WD52-800 Wind turbine Sales(set)Price(10K RMB/set)Cost(10K RMB/set)Revenue(10K RMB)Profit Margin List 193Figure 2009-2014 Windey WD52-800 Wind turbine sales(set) and growth rate List 194Table 2009-2014 Windey WD70/77/82-1500 Wind turbine Sales(set)Price(10KRMB/set)Cost(10K RMB/set)Revenue(10K RMB)Profit Margin List 194Figure 2009-2014 Windey WD70/77/82-1500 Wind turbine sales(set) and growth rate List 195Table Windey all wind turbine installed Wind farm Location Owners Capacity Number Models Lifting time List 195Table Shanghai Electric Wind Co.,Ltd Company Information (Products, Revenue,Suppliers,Clients and orders,Contract, Production plants, Expansion Plan, Contacts etc 15 items) 197Table 2009-2014 Shanghai Electric Wind Co.,Ltd Wind Turbine Capacity Production(MW)List 199Figure 2009-2014 Shanghai Electric Wind Co.,Ltd Wind Turbine Capacity Production(MW)and growth rate 200Table 2009-2014 Shanghai Electric Wind Co.,Ltd Capacity Utilization ratio Sales(MW)List 200Table 2009-2014 Shanghai Electric Wind Co.,Ltd 1.25MW Wind Turbine Sales(set)Price(10K RMB/set)Cost(10K RMB/set)Revenue(10K RMB)Profit Margin List 201Figure 2009-2014 Shanghai Electric Wind Co.,Ltd 1.25MW Wind Turbine sales(set) and growth rate List 201Table 2009-2014 Shanghai Electric Wind Co.,Ltd 2.0MW Wind Turbine Sales(set)Price(10K RMB/set)Cost(10K RMB/set)Revenue(10K RMB)Profit Margin List 201Figure 2009-2014 Shanghai Electric Wind Co.,Ltd 2.0MW Wind Turbine sales(set) and growth rate List 202Table Shanghai Electric Wind Co.,Ltd all wind turbine installed Wind farm Location Owners Capacity Number Models Lifting time List 202Table China Creative wind energy Company Information (Products, Revenue, Suppliers,Clients and orders,Contract, Production plants, Expansion Plan, Contacts etc 15 items) 203Table 2009-2014 China Creative wind energy Wind Turbine Capacity Production(MW)List 207Figure 2009-2014 China Creative wind energy Wind Turbine Capacity Production(MW)and growth rate 207Table 2009-2014 China Creative wind energy Capacity Utilization ratio Sales(MW)List 207Table 2009-2014 China Creative wind energy 1.5MW Wind Turbine Sales(set)Price(10K RMB/set)Cost(10K RMB/set)Revenue(10K RMB)Profit Margin List 208Figure 2009-2014 China Creative wind energy 1.5MW Wind Turbine sales(set) and growth rate List 208Table CASC-Acciona Company Information (Products, Revenue, Suppliers,Clients andorders,Contract, Production plants, Expansion Plan, Contacts etc 15 items) 209Table 2009-2014 CASC-Acciona Wind Turbine Capacity Production(MW)List 211Figure 2009-2014 CASC-Acciona Wind Turbine Capacity Production(MW)and growth rate 212Table 2009-2014 CASC-Acciona Capacity Utilization ratio Sales(MW)List 212Table 2009-2014 CASC-Acciona 900KW direct drive Wind Turbine Sales(set)Price(10K RMB/set)Cost(10K RMB/set)Revenue(10K RMB)Profit Margin List 212Figure 2009-2014 CASC-Acciona 900KW direct drive Wind Turbine sales(set) and growth rate List 213Table 2009-2014 CASC-Acciona 1.5MW VSCF Wind Turbine Sales(set)Price(10K RMB/set)Cost(10K RMB/set)Revenue(10K RMB)Profit Margin List 213Figure 2009-2014 CASC-Acciona 1.5MW VSCF Wind Turbine sales(set) and growth rate List214Table 2009-2014 CASC-Acciona 2.0 MW Permanent magnet direct drive Wind Turbine Sales (set)Price(10K RMB/set)Cost(10K RMB/set)Revenue(10K RMB)Profit Margin List 214Figure 2009-2014 CASC-Acciona 2.0 MW Permanent magnet direct drive Wind Turbine sales(set) and growth rate List 215Table CASC-Acciona all wind turbine installed Wind farm Location Owners Capacity Number Models Lifting time List 215Table New Unite Company Information (Products, Revenue, Suppliers,Clients andorders,Contract, Production plants, Expansion Plan, Contacts etc 15 items) 216Table 2009-2014 New Unite Wind Turbine Capacity Production(MW)List 219Figure 2009-2014 New Unite Wind Turbine Capacity Production(MW)and growth rate 219Table 2009-2014 New Unite Capacity Utilization ratio Sales(MW)List 219Table 2009-2014 New Unite 1.5MW Wind Turbine Sales(set)Price(10K RMB/set)Cost(10K RMB/set)Revenue(10K RMB)Profit Margin List 220Figure 2009-2014 New Unite 1.5MW Wind Turbine sales(set) and growth rate List 220Table New Unite all wind turbine installed Wind farm Location Owners Capacity Number Models Lifting time List 220Table Beijing Beizhong Steam Turbine Generator Co.,Ltd Company Information (Products, Revenue, Suppliers,Clients and orders,Contract, Production plants, Expansion Plan, Contacts etc 15 items) 221Table 2009-2014 BEIZHONG Wind Turbine Capacity Production(MW)List 223Figure 2009-2014 BEIZHONG Wind turbine Capacity Production(MW)and growth rate 224Table 2009-2014 BEIZHONG Capacity Utilization ratio Sales(MW)List 224Table 2009-2014 BEIZHONG 2.0MW Wind Turbine Sales(set)Price(10K RMB/set)Cost(10K RMB/set)Revenue(10K RMB)Profit Margin List 224Figure 2009-2014 BEIZHONG 2.0MW Wind Turbine sales(set) and growth rate List 225Table BEIZHONG all wind turbine installed Wind farm Location Owners Capacity Number Models Lifting time List 225Table Nordex Company Information (Products, Revenue, Suppliers,Clients and orders,Contract, Production plants, Expansion Plan, Contacts etc 15 items) 226Table 2009-2014 Nordex China Wind Turbine Capacity Production(MW)List 230Figure 2009-2014 Nordex China Wind Turbine Capacity Production(MW)and growth rate 231Table 2009-2014 Nordex China Capacity Utilization ratio Sales(MW)List 231Table 2009-2014 Nordex China 1.5MW Wind Turbine Sales(set)Price(10K RMB/set)Cost (10K RMB/set)Revenue(10K RMB)Profit Margin List 232Figure 2009-2014 Nordex China 1.5MW Wind Turbine sales(set) and growth rate List 232Table Nordex all wind turbine installed Wind farm Location Owners Capacity Number Models Lifting time List 232Table Hewind Company Information (Products, Revenue, Suppliers,Clients and orders,Contract, Production plants, Expansion Plan, Contacts etc 15 items) 235Table 2009-2014 Hewind Wind Turbine Capacity Production(MW)List237Figure 2009-2014 Hewind Wind Turbine Capacity Production(MW)and growth rate 237Table 2009-2014 Hewind Capacity Utilization ratio Sales(MW)List 237Table 2009-2014 Hewind 780KW Wind Turbine Sales(set)Price(10K RMB/set)Cost(10K RMB/set)Revenue(10K RMB)Profit Margin List 238Figure 2009-2014 Hewind 780KW Wind Turbine sales(set) and growth rate List 238Table 2009-2014 Hewind 1.5MW Wind Turbine Sales(set)Price(10K RMB/set)Cost(10K RMB/set)Revenue(10K RMB)Profit Margin List 238Figure 2009-2014 Hewind 1.5MW Wind Turbine sales(set) and growth rate List 239Table 2010 China New Wind Turbine Opportunity and Risk List 253Table Feasibility Analysis of 1000 sets/year 1.5MW Wind Turbine 254Table 1000 sets/year 1.5MW Wind Turbine Project Costs expenditure analysis 255Table 1000 sets/year 1.5MW Wind Turbine Project Output income analysis 256Table 1000 sets/year 1.5MW Wind Turbine Project Profitability payback period analysis 256。