特朗普经济学与中美贸易失衡外文文献翻译
中美贸易战(英语讲义配PPT)
Trade War•唐纳德特朗普是美国商人、电视真人秀、政客、总统。
Donald trump is an American businessman, reality TV show, politician and President.•在商人期间,特朗普建造了办公大楼、酒店、娱乐、高尔夫球场和世界各地其他有名的建筑。
During his time as a businessman, trump built office buildings, hotels, entertainment, golf courses and other famous buildings around the world.•特朗普的精神问题有以下几点,推特治国、退出TTP、巴黎气候协定、伊核协议、联合国教科文组织等等。
Trump's spiritual problems include the rule of twitter, the withdrawal of the TTP, the Paris climate agreement, the Iranian nuclear agreement, UNESCO and others.•他的他经常性侵犯女性,以至于她们现在纷纷来起诉他。
He was so often sexually assaulting women that they are now suing him.•他指定他的女儿和女婿作为总统助理和高级顾问。
He appointed his daughter and son-in-law as presidential aides and senior advisers.•他上任24小时就推翻了奥巴马医保法案。
He overthrew obamacare within 24 hours of taking office.•发布禁止穆斯林入境指令和修建美墨边境墙。
特朗普执政与中美关系探讨
特朗普执政与中美关系探讨近年来,特朗普执政对中美关系产生了深远的影响。
特朗普上任后,对中国采取了一系列贸易政策和外交手段,使中美关系进入了一个不稳定的时期。
在特朗普执政期间,中美关系的发展面临着许多挑战和变数,而这些挑战和变数也对全球格局产生了深远的影响。
特朗普政府采取的贸易政策是中美关系中最受关注的问题之一。
特朗普上台后,对中国发动了一场所谓的“贸易战”,采取了一系列加征关税和制裁的措施。
特朗普政府指责中国在贸易领域存在不公平行为,包括强制技术转让、知识产权侵权、市场准入壁垒等问题。
特朗普对中国采取的贸易政策引发了中美两国之间的贸易摩擦和经济冲突,对全球经济秩序和国际贸易体系造成了不小的冲击。
特朗普政府还对中国采取了一系列外交手段,试图在亚太地区和全球范围内遏制中国的影响力。
特朗普政府提出了所谓的“印太战略”,试图组建一个包括印度、日本、澳大利亚等国家的联盟,以牵制中国在亚太地区的影响力。
特朗普政府还试图通过在南海、台湾等问题上支持中国的对手,加强对华政策的压力。
特朗普政府的对华政策引发了中美关系的紧张局势,也对全球格局产生了深远影响。
中美两国在贸易、安全、地区热点问题等领域的对抗和竞争加剧,加剧了世界局势的不稳定性和不确定性。
特朗普政府在对华政策上的强硬立场,也引发了国际社会的广泛担忧和批评。
不过,特朗普政府的对华政策也引发了国内和国际的反对和争议。
特朗普政府对中国采取的贸易政策和外交手段受到了国内外的广泛批评,认为这种做法不利于中美关系的稳定发展,也不利于世界和平与繁荣。
特朗普政府对中国采取的一些措施也引发了国内产业界和普通民众的抗议和反对。
不过,我们也不能忽视特朗普政府对中美关系和中国的一些负面行为的指出和批评的合理性。
中国在贸易和经济领域存在一些不公平行为,也存在一些对国际社会产生负面影响的问题。
特朗普政府对这些问题进行指出和批评,也是有一定的道理和合理性的。
无论如何,我们都不能简单地对特朗普执政对中美关系的影响进行简单的判断和定性。
特朗普时代中美经贸关系走向研判
2017年4月刊第12期当代经济摘要:通过分析特朗普时代“重建美国”和“美国优先”的政策导向等现实状况,未来中美关系能否继续健康发展下去,还是回到“修昔底德陷阱”的老路上来,是一个亟待解决的问题。
如果特朗普瞄准中国“开火”,未来可能聚焦在哪些领域、采取哪些手段,提前研判并提出应对之策。
关键词:特朗普时代;中美关系;经贸关系基金项目:中国国际经济交流中心基金课题“中美新型大国关系面临的挑战与应对”。
特朗普时代中美经贸关系走向研判梅冠群(中国国际经济交流中心战略研究部,北京100050)2016年11月9日,唐纳德·特朗普(DonaldJ.Trump)赢得美国大选。
由于特朗普在竞选前后有一些涉华的负面言论,上台后对华战略与政策走向呈现较大不确定性。
一、增加就业是特朗普“重建美国”和“美国优先”的本质,对特朗普政策方针的研判必须要基于以就业为核心的分析框架判断特朗普对华政策必须首先对其竞选成功的社会原因、竞选理念与执政思路进行全面分析,找出其所出台政策背后的规律一致性。
特朗普在竞选中扛着保护主义、孤立主义、民粹主义的大旗,打着代表美国在全球化中收益不多甚至利益受损的民众利益的竞选牌,赢得了广大工薪阶层、中西部民众以及广大农村民众的支持,一举赢得本次大选。
特朗普代表的不仅仅是他一个人,而是一个社会剧烈变化的外在代表,其竞选和当选,都是这个社会外在变化的重要表现,是在产业转出美国、美国贫富差距拉大的背景下,对美国传统主流政治模式的一次颠覆。
目前特朗普已明确提出推进三大政策:一是大规模的基础设施投资计划,特朗普承诺要花费上万亿美元改造美国基础设施。
二是大规模的结构性减税计划,特朗普主张启动自上世纪80年代里根执政以来最大规模的减税方案。
个人所得税方面,将联邦个人所得税由目前七档简化为12%、25%和33%三档,最高档将由目前的39.6%降至33%。
企业所得税方面,主张将最高联邦企业所得税率由目前35%降至15%,对参与基础设施建设的私人股权融资提供82%的税收减免。
基于国际贸易理论浅析中美贸易局势
基于国际贸易理论浅析中美贸易局势作者:何凯茜李海博刘思语来源:《新生代·上半月》2019年第02期【摘要】:美国总统特朗普高举“美国优先”的旗帜,实施贸易保护主义。
以中美贸易失衡为由挑起中美贸易战,表面上是中美贸易逆差过大引起中美贸易战,而从历史经验,盛行思想,实行政策等方面分析,美国此次打响贸易战是以减少贸易逆差为名,行打压中国企业之实。
中美贸易战是一场两败俱伤的战役,并没有哪一方能完全不受损伤。
国与国应平等相待,互谅互让,通过协商解决问题。
2018年12月1日,中美就经贸问题达成了共识,停止加征新的关税,短期来看,中美之间的贸易战没有越演越烈的趋势,但美国依然把中国作为头号竞争对手,未来仍可能在多个领域与中国竞争。
【关键词】:中美贸易战贸易保护主义对外贸易一、中美贸易发展历程自 1979 年中美建交和签订双边贸易协定以来,两国之间的贸易发展迅速,但也摩擦不断,尤其是 2016 年特朗普当选美国总统以来,以美中货物贸易巨额逆差为由,美国采取了一系列针对中国的行动,同时还运用美国国内的贸易法针对中国发起“301调查”等非常规性的贸易救济调查,挑起了中美之间的贸易摩擦。
此次中美贸易战起源自美国政府于2017年8月18日发布的对中国展开“301 调查”的声明。
“301 调查”的本质相当于美国摒弃了WTO的多边贸易框架,自行发起针对另外一个国家的贸易制裁行为。
2018年5月初,美国代表团来北京与中方在经贸领域进行了第一轮谈判,尽管“进行了坦诚、高效、富有建设性的讨论”,但是“在一些问题上仍存在较大分歧”;2018年5月中旬,中国代表团访问美国,与美方在经贸领域进行第二轮谈判,发布了《中美经贸磋商的联合声明》,并停止互相加征关税。
2018年6月15日,美国总统特朗普置中美双方已经形成的共识于不顾,批准对约500亿美元的中国商品征收关税,并在6月18日威胁中国,若中国继续反击,将再对2000亿美元中国商品加征10%关税。
国际商务英语阅读教程(第四版)
Unit 1~2 Mercantilism重商主义Trade surplus 贸易顺差Quota and tariff配额和关税Zero-sum game零和博弈Positive-sum game常和博弈The theory of absolute advantage绝对优势理论The theory of comparative advantage 比较优势理论Factor endowments要素禀赋理论Product life cycle 产品生命周期Economies of scale 规模经济First mover advantage先占优势Barrier to entry进入(市场)壁垒Porter’s diamond theory波特的钻石理论National competitive advantage国家竞争优势The department of commerce 商务部Letter of credit信用证Draft /bill of exchange 汇票bill of lading B/L 提单Sight draft即期汇票Time draft 远期汇票Banker ‘s acceptance 银行承兑Trade acceptance商业承兑汇票Countertrade 对等贸易Barter 易货贸易Switch trading 转手贸易Offset 抵消Counter purchase 互购贸易Compensation trade 补偿贸易1.波特钻石理论的主要内容①Factor endowments ②Firm strategy, structure, and rivalry③ Demand conditions ④Relating and supporting industries2.对等贸易的主要类型和优缺点①Types of countertradeCountertrade has evolved into a diverse set of activities that can be categorized as five distinct types of trading arrangements: barter, counter purchase, offset, switch trading, and compensation or buyback②The pros and cons of countertrade优:① The main attraction of countertrade is that it can give a firm a way to finance an export deal when other means are not available.② Thus if a firm is unwilling to enter into a countertrade agreement, it may lose an export opportunity to a competitor that is willing to make a countertrade agreement.缺:① Countertrade contracts may involve the exchange of unusable or poor-quality goods that the firm cannot dispose of profitably② In addition, even if the goods it receives are of high quality, the firm still needs to dispose of them profitably.Unit 3Strategic alliance 战略联盟Licensing 许可证Joint venture 合资经营Contracting 承包经营Partnership 合资人Return on investment 投资回报率Franchising 特许经营Contract manufacturing 生产承包Management contracting 管理承包1.许可贸易的优缺点优:①The basic advantage in licensing as contrasted to other approaches is theease and low cost of entering a foreign market.②Licensing is also advantageous in that it can be used to test a foreignmarket without the risk of capital loss should the market not be receptive to the manufacturer’s product.缺:①The greatest disadvantages to the licensor are that a potential competitoris set up.②There is a lack of control over production and marketing.③There may be incomplete market exploration.Unit 4Foreign direct investment 外国直接投资Small and medium-sized firms 中小企业Horizontal FDI 横向外国直接投资Vertical FDI 纵向外国直接投资Product life cycle 产品生命周期Backward vertical FDI 后移纵向外国直接投资Forward vertical FDI 前移纵向外国直接投资Transportation costs 运输成本Market impediments 市场阻碍Market power 市场力量Oligopoly 寡头垄断Specialized assets 特殊资产1.影响横向对外投资的因素①Transportation costs ②Market imperfections④Following competitors ④The product life cycle2.What are the impediments to the sale of know-how?①Licensing may result in a firm’s giving away its technological know-how to a potential foreign competitor.②Licensing does not give a firm the tight control over manufacturing, marketing, and strategy in a foreign country that may be required to profitably exploit tis advantage in know-how.③A firm’s know-how may not be amenable to licensing.Unit 5Bretton Woods System 布雷顿森林体系Fixed exchange rate 固定汇率制OPEC 石油输出国组织Organization of the Petroleum Exporting Countries Floating exchange rate regime 浮动汇率制Plaza Accord 和平广场协议Louvre Accord 卢浮宫协议Foreign exchange market 外汇市场European Monetary System 欧洲货币体系EMSExchange Rate Mechanism 汇率机制ERMEuropean Currency Unit欧元 ECUTrade deficit贸易赤字Real interest 实际利息Balance of payment 收支平衡表Forward market 期货市场Swaps 掉期交易1. 布雷顿森林体系/固定汇率制瓦解的主要原因As the only currency that could be converted into gold, and as the currency that served as the reference point for all others①It was financed by an increase in the money supply, which, in turn, led to a rise in price inflation from less than 4percent in 1966 to dose to 9 percent by 1968②The rise in government spending had stimulated the economy③Gave rise to speculation in the foreign exchange market that the dollar would be devalued④Weakening dollars lose its credibility.2. What are the reasons for the unexpected rise in the dollar between 1980 and 1985, and what are the reasons for the rapid fall of the US dollar between 1985 and 1987?The reasons for the unexpected rise in the value of the dollar between 1980 and 1985:①Strong economic growth in the US attracted heavy inflows of capital from foreign investors seeking high returns on capital assets.②High real interest rate attracted foreign investors seeking high vellums on financial assets③Political turmoil in other parts of the world.The reasons for 1985 and 1987:The fall in the value of the dollar between 1985 and 198 was caused by a combination of government intervention and market forces.Unit 6Common law 普通法Code civil law 成文法Roman law 罗马法Industrial property right 工业产权Act of god 不可抗力Element forces of nature 天灾自然因素Arbitration 仲裁Conciliation 调节Litigation 诉讼World court at the Hague 海牙国际法庭Tribunals for arbitration 仲裁庭U.N. convention on the Recognition and Enforcement of ForeignArbitral/Awards 联合国承认和执行外国仲裁裁决公约International Chamber of commerce 国际商会1. What are the differences between two legal systems in solving commercial disputes?①Under common law, commercial disputes are subject to laws which may be applied to either civil or commercial disputes since there is no specific recognition of commercial problems as such.②Code law differs in that there is a separate code specifically designed for business2. What are the procedures used by formal arbitration organizations? The usual arbitration procedure is for the parties involved to select a disinterested and informed party or parties as referee to determine the merits of the case and make a judgment that both parties agree to honor.Unit 7Intellectual property rights 知识产权Trade mark copyright, patents, trade secrets 商标权,版权,专利权,商业秘密Intangible assets, tangible assets 无形资产,有形资产Trademark registration 商标注册Generic terms 通称Infringement 侵权GATT 关贸总协定General Agreement on Tariffs and Trade1. What does intellectual property right consist of?①It consists of the products of individual’s minds—products that result from intellectual, creative processes.②Trademarks, copyrights and patents are all forms of intellectual propertyUnit 8The TRIPS agreement 与贸易有关的知识产权协议Need Hierarchy 需求层次理论Self-reference criterion 自我参考标准The adoption process 接纳过程理论High-context cultures 高背景文化Low-context cultures 低背景文化Poly-chromic time 多元化时间观Mono-chromic time 单一性时间观Perception 观念1. What are the characteristics of culture?①It is not innate, but learned②The various facts of culture are interrelated-touch a culture in one place andeverything else is affected.③It is shared by the members of a group and defines the boundaries betweendifferent groups.2. What are the main contents of Need Hierarchy theory?①Self-actualization ②Esteem ③Social ④Safety ⑤Physiological3. What is the concept of adoption process? How many stages will a person undergo before he can finally purchase a new product?Adoption process─through which an individual passes from the time of his or her first knowledge of an innovation to the time of adopting or purchase of the innovation.These stages are as follows: ①awareness ②interest ③evaluation④trial ⑤adoption4. What are the adopter categories? What is the feature for early adopter?Adopter categories are classifications of individuals within a market on the basis of their innovativeness. They include innovators、early adopters, the early majority, the late majority and laggards.The future for early adopter: They tend to be younger, have higher social status and in a more favorable financial position than later adopter. They must be responsive to mass-media information sources and must learn about innovation form these sourcesbecause they cannot simply copy the behavior of earlier adopters.Unit 9Organizational behavior组织行为学Multinational Corporation 跨国公司Maquiladoras 马基拉朵拉工厂Parochialism 地方主义NAFTA 北美自由贸易协定North American Free Trade AgreementKluckhohn-Strudtbeck framework 克拉克洪─斯托特柏克构架Hofstede framework 霍夫斯诺德构架BRICS 金砖五国巴西俄罗斯印度中国南非APEC 亚太经合组织Asia-Pacific Economic Cooperation1. Identify the sic cultural dimensions in the Kluckhohn-strodtbeck framework.①Relationship to the environment ②time orientation③nature of people ④Activity orientation⑤focus of responsibility ⑥conception of space2. Explain the dimensions of national culture in Hofstede framework.①Individualism versus collectivism②power distance③uncertainty avoidance④masculinity versus femininity。
时文阅读26
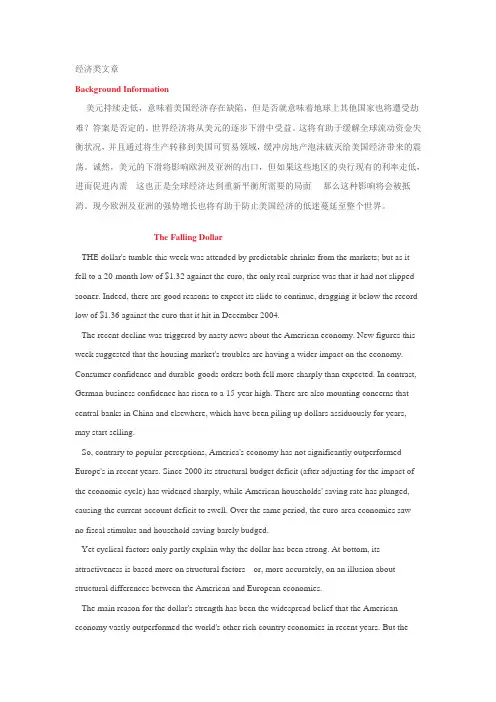
经济类文章Background Information美元持续走低,意味着美国经济存在缺陷,但是否就意味着地球上其他国家也将遭受劫难?答案是否定的。
世界经济将从美元的逐步下滑中受益。
这将有助于缓解全球流动资金失衡状况,并且通过将生产转移到美国可贸易领域,缓冲房地产泡沫破灭给美国经济带来的震荡。
诚然,美元的下滑将影响欧洲及亚洲的出口,但如果这些地区的央行现有的利率走低,进而促进内需---这也正是全球经济达到重新平衡所需要的局面----那么这种影响将会被抵消。
现今欧洲及亚洲的强势增长也将有助于防止美国经济的低迷蔓延至整个世界。
The Falling DollarTHE dollar's tumble this week was attended by predictable shrinks from the markets; but as it fell to a 20-month low of $1.32 against the euro, the only real surprise was that it had not slipped sooner. Indeed, there are good reasons to expect its slide to continue, dragging it below the record low of $1.36 against the euro that it hit in December 2004.The recent decline was triggered by nasty news about the American economy. New figures this week suggested that the housing market's troubles are having a wider impact on the economy. Consumer confidence and durable-goods orders both fell more sharply than expected. In contrast, German business confidence has risen to a 15-year high. There are also mounting concerns that central banks in China and elsewhere, which have been piling up dollars assiduously for years, may start selling.So, contrary to popular perceptions, America's economy has not significantly outperformed Europe's in recent years. Since 2000 its structural budget deficit (after adjusting for the impact of the economic cycle) has widened sharply, while American households' saving rate has plunged, causing the current-account deficit to swell. Over the same period, the euro-area economies saw no fiscal stimulus and household saving barely budged.Yet cyclical factors only partly explain why the dollar has been strong. At bottom, its attractiveness is based more on structural factors---or, more accurately, on an illusion about structural differences between the American and European economies.The main reason for the dollar's strength has been the widespread belief that the American economy vastly outperformed the world's other rich country economies in recent years. But thefigures do not support the hypothesis. Sure, America's GDP growth has been faster than Europe's, but that is mostly because its population has grown more quickly too. Official figures of productivity growth, which should in theory be an important factor driving currency movement, exaggerate America's lead. If the two are measured on a comparable basis, productivity growth over the past decade has been almost the same in the euro area as it has in America. Even more important, the latest figures suggest that, whereas productivity growth is now slowing in America, it is accelerating in the euro zone.America's growth, thus, has been driven by consumer spending. That spending, supported by dwindling saving and increased borrowing, is clearly unsustainable; and the consequent economic and financial imbalances must inevitably unwind. As that happens, the country could face a prolonged period of slower growth.As for Europe, the old continent is hobbled by inflexible product and labor markets. But that, paradoxically, is an advantage: it means the place has a lot of scope for improvement. Some European countries are beginning to contemplate (and, to a limited extent, undertake) economic reforms. If they push ahead, their growth could actually speed up over the coming years. Once investors spot this, they are likely to conclude that the euro is a better bet than the dollar.核心词汇:tumble v. ①(使)摔倒;②打滚,翻腾;n. 摔跤,跌倒shrink n. v. 萎缩,减少; [同义词]dwindleeuro 欧元slip v. ①滑,滑倒;②滑落,滑掉;③溜走;n. 疏忽,小错,口误,笔误Step outside and you could break a leg, slipping on your doormat.[1999年阅读1]如果你走出去,可能会滑倒在门垫上,摔伤一条腿。
中美货币政策的参考文献
中美货币政策的参考文献1. Bernanke, B. S. (2005). The global saving glut and the U.S. current account deficit. The Sandridge Lecture, Virginia Association of Economists, Richmond, Virginia.这篇论文由前美联储主席伯南克撰写,探讨了全球储蓄过剩和美国经常账户赤字之间的关系,对中美货币政策的影响进行了分析。
2. Obstfeld, M., & Rogoff, K. (2009). Global imbalances and the financial crisis: Products of common causes. In Proceedings of the Federal Reserve Bank of San Francisco, Asia Economic Policy Conference (Vol. 4, pp. 131-172).这篇论文由经济学家奥布斯菲尔德和罗戈夫撰写,研究了全球不平衡和金融危机之间的关系,对中美货币政策的协调性提出了一些观点。
3. Taylor, J. B. (2013). International monetary coordination and the great deviation. Journal of Policy Modeling, 35(3), 463-472.这篇论文由经济学家泰勒撰写,探讨了国际货币协调和经济波动之间的关系,对中美货币政策的协调性进行了研究。
4. People's Bank of China. (2019). China's Monetary Policy Report (No. 1).这是中国人民银行发布的一份货币政策报告,详细介绍了中国的货币政策框架、目标和措施,对中美货币政策的差异进行了说明。
中美贸易战中的金融对策
18智库观察The Financial Countermeasures in the China-US Trade War 中美贸易战中的金融对策■ 蓝裕平● 经济学家支招中美贸易战中美之间的竞争和博弈关系已经进入了一个新阶段:美国要求中国与其“保持安全距离”;中国又不能放弃对美好生活的追求。
这注定中国遭遇美国全方位狙击是必然的。
打击一个日渐强大且很可能超越自己的对手,美国会采取任何手段,包括贸易、金融和军事等。
金融方面的策略,不仅涉及经济对策,还涉及金融市场的保护与对垒。
孙子曰:知己知彼,百战不殆。
本文拟分析中美当前的金融形势,同时提出中国在货币政策、财政政策、投资市场、外汇市场和金融市场建设等方面需要考虑的应对策略美国的减税计划及其影响特朗普当选总统以后,推出被称为美国史上最大的减税计划,让美国各阶层皆大欢喜。
多数人只觉得这是政客上台后兑现承诺,回馈选民的招数,实际上减税计划是美国全面开打贸易战的重大准备措施。
这个计划至少达到了几个目的:第一,大幅降低企业税负,提高美国的国际竞争力。
美国经济的国际化程度很高,企业直接参与国际竞争。
减税计划类似于在战前给士兵分配武器。
第二,大幅减税以后,提高了美国个人和企业的生存能力和适应能力。
贸易战将给美国经济带来冲击,给个人和企业都会带来不利影响。
减税计划类似于战前给士兵分配给养。
第三,大幅减税稳定了美国金融市场,为开打贸易战提供了稳定的后方。
减税大幅提高了美国企业的税后利润,为本来看起来估值过高的股票市场,提供了一份保护。
经过了多年的牛市,道指到2016年底已经涨了约1.7倍。
这么高的涨幅让很多人都预期离顶部不远了。
如果美国股市进入下跌周期,开打贸易战将会September 2018 国际融资招致更多的批评,继续推进会有很多阻力。
减税计划为股市提供了一个盾牌,帮助其抵御市场的冲击。
第四,减税计划,可帮助吸纳国际资本,提高美国的国家实力。
美国的跨国公司在国外赚到了大笔利润,过去主要由于避税原因长期滞留国外,而减税计划鼓励这种资金回流美国。
中美新局势下的贸易摩擦——动因、影响及我国对策
第42卷第3期2024年03月对外经贸实务PRACTICE IN FOREIGN ECONOMIC RELATIONS AND TRADEV ol.42No.3M a r.2024一、引言中美两国自1979年建立外交关系以来,双方在多领域开展了多层次、多维度的广泛合作,尤其是经贸领域,成绩斐然。
然而,随着中国经济的强势崛起和在世界经济事务中话语权的日益提升,中美两国经济关系渐渐步入新阶段,形成“竞争-合作”新局势,贸易摩擦开始成为美国政府对华经济政策的主基调。
特朗普让“美国优先”的主张开启了中美建交后贸易领域美国对中国经济层面的全面对抗,两国贸易摩擦显著增多。
拜登在延续贸易领域对华强硬措施的基础上,将相关不公正手段延伸至高科技、金融等领域,导致两国良好的合作关系全面倒退。
虽然美国两届政府逆全球化浪潮而动,罔顾事实,对中国横加指责,但中国始终秉持合作共赢的理念,以中美两国元首巴厘岛和旧金山共识为基础,推动中美经贸关系的发展。
尽管中美两国竞争凌驾合作之上的总体框架难以改变,但仍可能出现中美在特定领域积极推进优先事项的机会。
二、中美新局势的由来及表征中美新局势的形成是特朗普政府和拜登政府政策导向变化的结果。
特朗普政府通过对抗手段试图改变中美经济和战略关系,而拜登政府虽继承了一些对华强硬政策,却也试图在某些领域缓和紧张关系,通过加强内部能力建设和国际合作来应对中国的崛起。
美国在面临与中国战略竞争的同时,仍寻求通过增强自身的经济和技术基础建设、深化与盟友的合作关系以及在必要时采取针对性措施来保护自身利益,避免全面的对抗或脱钩。
一方面,美国认识到与中国全面对抗的成本和风险,尤其是在全球化深度发展和国际关系相互依赖的背景下;另一方面,美国也在寻求维护自身的全球领导地位,防止中国在关键领域的崛起。
在中美由全面合作走向部分合作和“竞争-合作”的景况下,中美新局势有以下特征。
中美新局势下的贸易摩擦——动因、影响及我国对策陈杰,王箫轲(吉林大学,吉林长春130012)摘要:近年来,美国打着“国家安全”和“公平贸易”的幌子,对中国采取了一系列不公正的强硬措施,标志着两国关系进入新局势。
特朗普时期中美直接投资问题研究
2018年1 内蒙古科技与经January2018第1 期总第395 期Inner Mongolia Science Technology & Economy No. 1 Total No. 395持朗普12中4直辏投资9:,-刘青青(天津科技大学经济与管理学院,天津300222)摘要:介绍了特朗普主要经济政策主张,分析了“特朗普经济学”对中美直接投资的影响,并且提出了相议主张。
关键词:美国优先;特朗普;中图分类号:F752. 7 文献标识码:A文章编号:1007—6921(2018)01—0005—01特成功的原因,在于特经策达“美国”的政治经。
对内、低福利和振兴实体经济为重点,对外保护和构建已有利关系为重点。
其经济政策的核心目标是经济增长、增加就业。
1 特朗普时期主要经济政策笔者仅列出与中接关的政策举措。
1.1 以促进就业为核心的产业政策①加强基础建设。
发行“基础”计在10年为美国 2 500万工作岗位。
②提出“买美国货,雇美国人”特朗普发布新的行政指令,规定新的美国管道必须用美国的钢铁制造。
1 2 的 策①国国内企业,将企业所得税由35%15%,并提出国经。
②吸引美国,对企业国内的利三收10%的一次性,大中 级的税担。
③强国公司将国,35%的 。
1.3 以保护国内、妒大对外出口为核心的贸易策①退出关定,重谈出北定, 谈区域谈判。
②对国制造业的外国者.更的 策。
③将中国列为“国”并对中国发起更。
2 美国产业回迀对中美直接投资的影响“再工业化”以来,美国f 从基础、税收、、方面,为美国企业本土投造条件,已出现。
现今,特推进制造业,为 国 更强劲动。
2. 1 特朗普政策将增加中国对美直接投资,但挑战并存特的 策,与中国产业级,更低的将中国企业进一步对:。
特个人所,增加者可支配收人,加快美国国内。
中 有强性,美国强将扩大中国对美出口。
如图1所示,中国对美直接保持高的。
册必202007 2008 2009 2010 2011 2012 2013 2014 201S-----中国对美直接投资净额(亿美元)图1中国对美直接投资净额(亿美元)但特经济政策也将阻碍中国对,一方面,美国制造业中国产业升级将形成竞争关系。
- 1、下载文档前请自行甄别文档内容的完整性,平台不提供额外的编辑、内容补充、找答案等附加服务。
- 2、"仅部分预览"的文档,不可在线预览部分如存在完整性等问题,可反馈申请退款(可完整预览的文档不适用该条件!)。
- 3、如文档侵犯您的权益,请联系客服反馈,我们会尽快为您处理(人工客服工作时间:9:00-18:30)。
特朗普经济学与中美贸易失衡中英文英文Trump economics and China–US trade imbalancesJustin YifuLin1. IntroductionThe trade deficit of the Unites States, as shown in Fig, expanded from around zero before mid-1970s to peak in 2006 at $761 billion, which was around 5% of the US GDP. The trade deficit of goods was even larger, peaking at $837 billion in 2006. Though this value decreased after the 2008 global financial crisis, it was still at a remarkably high level as $752 billion in 2016. The trade imbalances between US and Japan and other industrialized economies contributed most to the rising US trade deficits before the 1980s, while in recent years the US runs deficits mainly against emerging Asian economies and oil-producing economies. President Trump argues that the US trade deficit was caused by unfavorable trade agreements against the US and pledges to eliminate them by bilateral renegotiations or unilateral actions.The US–China trade imbalance has been a prime concern of President Trump ever since his election campaign in 2015. The official data provided by the US Census Bureau shows that China, the emerging major player in the process of globalization, has been running a trade surplus with the US since 1984. China’s trade balance with the USincreased from a trade surplus of $0.06 billion in 1985 to a trade surplus of $347.02 billion in 2016, which represented 44% of US trade deficit in that year. This large imbalance has caused considerable pressure on the US–China trade relations. One major concern is the impacts of imports from China on US domestic employment. One highly cited work by Autor, Dorn, and Hanson (2013) shows that the exposure to imports from China had negative impacts on US’s manufacturing employment. President Trump pledged in his election campaign to impose 45% border tax on imports from China as a measure to reduce the US–China trade imbalances and to retain jobs in the US.Would imposing draconian tariffs on imports from China help reduce US total trade deficit? Would the reduction of US trade deficit with China bring manufacturing jobs back to the US? The answer to these questions depends on what cause the persistent trade imbalances.The causes of rising US trade deficit have been discussed intensively. Existing literature provides theoretical and empirical support for several key factors, such as the lack of investment opportunities in emerging economies, undervalued exchange rates against the US dollar to the currencies of several emerging economies, the increase in the price of the primary commodities and the over-consumption caused by financial deregulation and supported by US dollar as a major global reserve currency.This paper focuses specifically on trade imbalances between the US and China and investigates how China’s comparative advantage in the labor-intensive manufacturing activities, combined with the global production sharing across economies with China as the assembly hub, works as the major source of the increasing bilateral trade imbalances between US and China. In particular, this paper first analyzes the bilateral trade patterns between US and its main trading partners and finds that East Asia is traditionally the main source of US’s trade deficits. The paper further finds a declining share of US–East Asia trade imbalances in US total trade deficit during the period when the US–China trade imbalances was rising. It also reveals negative correlation between US trade deficit with China and China with some other East Asian economies. Based on these findings, our paper attributes the sharp increase in US–China trade imbalances to the reallocation of labor-intensive production activities from Japan and Asian newly industrialized economies (NIEs), namely South Korea, Singapore, Hong Kong, Taiwan, China, to China, epitomized by the US’s dramati c expansion of overall trade deficit.The US–China trade imbalances were also exacerbated by the production sharing across borders in East Asia with China as the assembly hub. A growing strand of literature considers the value-added contents as an indicator for international production fragmentation and a more objective assessment of the relative distribution of economicbenefits from trade between two trading partner economies (Daudin, Rifflart, & Schweisguth, 2011; Hummels, Ishii, & Yi, 2001; Johnson & Noguera, 2012). The idea of value-added contents of trade is based on models of sequential multi-stage production with stages split across economies. With flows of final products and intermediates co-existing, production fragmentation across economies generates discrepancy between gross and value-added trade flows. Traditionally, the focus of public interest is on the bilateral trade balance. However, with trade flows of intermediates across economies, the value of gross exports might overestimate the domestic economic benefits of exports to the exporting country and ignores the indirect impacts from other economies. Therefore, in addition to the bilateral trade balance, this paper carefully discusses patterns of bilateral trade flows measured in value-added contents, with data in Johnson and Noguera (2012) and Johnson (2014).Moreover, given that the difference in comparative advantages across economies is one of the main incentives of global production sharing, this paper examines the bilateral trade balances at the sector level. The results show that only in sectors that China has comparative advantages there is persistent bilateral trade imbalance between China and US. In addition, other economies that has low labor costs share the same trade pattern as that of China. We argue that the root of US trade deficit is not China’s exchange rate policy and other trade manipulationsas President Trump pledged. Therefore, raising trade barriers for China’s imports to the US will not help mitigate the US total trade deficits.This paper is organized as follows. In Section 2, we review several explanations for US trade deficits. Sector 3 presents the current status of the total US–China trade imbalances, and we further examine its domestic value-added contents in Section 4. In Section 5 we conduct our analysis by sectors and apply the analysis to other economies. We also discuss the evolution of China’s comparative advantages in the low-wage labor intensive sector. Section 6 concludes.2. Main explanations for US trade deficits in existing literatureThe causes of US trade deficits have been extensively discussed. In this section, we will review several main strands of existing literature. The first strand of literature considers the trade imbalances as the results of econ omic distortions rather than an “equilibrium” phenomenon. Therefore, the trade imbalances could only be resolved with policy adjustments. For example, a series papers by Obstfeld and Rogoff, 2000, Obstfeld and Rogoff, 2005 and Rogoff (2006) discuss the changes in exchange rate that are required to reduce the imbalances.The second strand of literature considering global imbalances as an “equilibrium” condition, marked with the hypothesis of a global “saving-glut” proposed by Bernanke (2005). Different explanations of the “saving glut” have been raised. Caballero, Farhi, and Gourinchas (2008),for example, develops a model with heterogeneity across economies in their ability to supply safe assets. Mendoza, Quadrini, and Rios-Rull (2009) also focuses on the different levels of financial development, but emphasizes heterogeneity in the demand of assets and their model predicts increased financial integration raises foreign demand for US assets. Fogli and Perri (2010) explore the impacts of time varying macro risk, while several papers consider demographic heterogeneity as one reason for the emergence of external imbalances, such as Henriksen (2002), Cooper (2008), and Du and Wei (2010).Other explanations for global imbalances include the anticipation of a rising U.S. future share in world output, trade channels, productivity growth in the non-traded sector, measurement error, the asset price boom of the late nineties (Laibson & Mollerstrom, 2010), etc.In other study, Lin (2013) has reviewed the above explanations and argued that the deterioration of US trade deficits after the mid-1970s is caused primarily by the US household’s overconsumption as a result of the wealth effect from rising asset value due to financial deregulation and the expansionary monetary policy, which in turn were made possible by the delink of US dollar to gold in 1971. Moreover, the only reason for the US to be able to sustain such a large and rising trade deficits for several decades is the status of US dollar as a major global reserve currency.In this paper we focus particularly on the US–China tradeimbalances. Unlike the cases in which economic reasons are employed to explain US trade deficit with Japan and the oil exporting economies, China and other East Asian economies have been blamed, by some researchers and politicians, to manipulate the exchange rate to promote net exports and use this as the main components of export-led growthdevelopment strategy. In this paper, we will show that the US traditionally has a trade deficit with the East Asian economies due to the differences in comparative advantages between the US and East Asian economies and the rising bilateral trade imbalances between the US and China is a result of reallocation of production from Asia’s NIEs to China due to the evolution of comparative advantages over time. The US has trade imbalance with East Asian economies traditionally. While China’s trade imbalance with US increased sharply after the 1990s, the share of US’s trade imbalance with East Asian economies as a gro up declined in the same period. The facts suggest that the US’s worsening of trade deficits in general and trade imbalance with China in specific are most likely to be a result of US’s own internal reasons.3. Current status of US–China trade imbalanceSince the official estimates of the same bilateral trade deficit often differs across trading partners, we only employ the trade values reported by importers as described in Feenstra, Lipsey, Deng, Ma, & Mo (2005) for the following analysis. present the main reasons that makeChina almost the sole concern among all economies with trade surplus with US. First, there has been continuous dramatic increases in the trade surplus of China for more than three decades while the trade imbalances of the main trading partners of US were much more stable since 1985. Japan’s trade surplus, for example, was $103 billion in 1985 and $110 billion in 2016. This increase was much lower than the case of China, from −$16 billion in 1985 to $608 billion in 2016. In addition, US’s trade deficit with China accounts for the major part of its total trade deficit in recent years. In 2016, 44% of US total trade deficit was with China, while this value was only 0.3% in 1985.However, these facts provide little evidence to support the idea that imposing high trade barriers for imports from China could help reduce US total trade deficit. A closer examination of the contribution of East Asian economies to US trade deficit reveals more evidence. There are two main messages from Panel B. First, as argued in Lin, Dinh, & Im (2010) US began to accumulate trade deficit long before the start of China’s trade surplus. US has had large trade deficit with East Asian as a whole before the rising of China’s exports since the 1990s. The pattern of East Asi an’s contribution to US trade deficit has been relatively stable during the past three decades, except for the peak in the 90s. Moreover, although the contribution of China to US trade deficit increases dramatically since 1990, the total share of trade surplus of East Asianeconomies4 in US total trade deficit declined from over 100% in early 1990s and 83.3% in 1995 to 63.1% in 2016. It implicates that the policies in China and East Asian economies were not the main reason for the US trade deficits and the increase in US–China trade deficit is associated with the reallocation of production activities across East Asian economies.The international reallocation of production activities, mainly labor-intensive activities, has been discussed in the literature under the term of “fly-geese”. The flying-geese theory (Akamatsu, 1962), as discussed in Kojima (2000) and its empirical work, mainly examine the sequential economic development in all “high-performing Asian economies” (HPEAs), which “trickled down from Japa n, to the NIEs, and then to ASEAN-4 (Thailand, Malaysia, Indonesia, and the Philippines), and China” (Cutler, Berri, & Ozawa, 2003). Japan was the first Asian country that experienced a dramatic structural transformation with expansion in its labor-intensive manufacturing sector and exports to the US after WWII. While its wage increased in the latter half of the 1960s, the labor-intensive manufacturing shifted to South Korea, Singapore, Hong Kong, and Taiwan, China. These production activities mirgrated again to the ASEAN-4 and China in 1980s, with 1990s as the peak time of FDI inflows to China (Chandra, Lin, & Wang, 2013; Lin, 2012, Lin, 2013).Inspired by the literature on the flying-geese-style economicdevelopment, we further examine the correlation among changes in the bilateral trade flows across economies. If our argument of production reallocation holds, increases in China’s trade surplus with US should be accompanied by increases in China’s trade deficit (or decreases in trade surplus) with South Korea and Taiwan, China after 1980s. The fitted lines in two graphs in Fig are both downward sloping, indicating a negative correlation between China’s trade imbalance with US and China’s trade imbalances with South Korea, as well as the one between China–US trade imbalances and China–Taiwan, China trade imbalances. In addition, China started to hold trade deficit with both South Korea and Taiwan, China after around 1990. This is also the start of the dramatic increase of China’s trade surplus with US. The ti ming pattern fits well with empirical evidence in the fly-geese style economic development literature.Since Japan finished its structural change and production reallocation before 1980. However, this graph is still consistent with the fly-geese story since the China–Japan trade grew in favor of Japan until 1990. In addition, if we divided the time of our concern into two periods, we see that before 2000, there existed a positive correlation between China’s net trade with Japan and with US, while this patte rn was reversed after 2001.Actually the “triangular production sharing within Asia” has beendiscussed in several papers. Johnson and Noguera (2012), for instance, finds that the adjustments of trade balances in Australia, Japan, Singapore, South Korea, and Taiwan, China nearly add up to the changes in the US–China deficit. The production fragmentation and sharing implies the possibility that large part of China’s exports to the US were intermediates that China imported from these economies.4. Value added content of US–China trade imbalanceTo find further support for production fragmentation, we next check the value-added share of exports in each economy as an indicator of the intensity of production sharing in the production network, as discussed by Johnson and Noguera (2012). When there exists production fragmentation, firms locate their production affiliation according to the comparative advantage in each country over the world. It helps firms reduce costs and gain more profits. In this case, what matters for the impacts of trade on employment is the value-added contents in trade flows rather than the total trade values.The value added (V A) content is defined as the difference between the value of output and the total value of purchased intermediate inputs. It includes compensation for labor and capital and indirect taxes. China is often engaged in the final stage of production by assembling intermediate parts before products are exported to final consumers. Consequently, the total domestic value-added c ontent of China’s exports is relatively low. Incontrast, the value-added content of U.S. exports to China is high, which implies that the imbalances in the gross value of trade flows between the U.S. and China have been overstated the actual trade imbalances that might have asymmetric impacts on economic results of two trading paternals. In addition, China imports large quantity of intermediate goods from South Korea and Taiwan, China. However, with simple processing in China, these products are exported to US and other economies. The calculation of overall trade flows counts their whole value into China’s exports to US rather than exports from South Korea and Taiwan, China. Therefore, it underestimates the impacts of other economies on US imbalance. In this section, we check the value-added contents of trade based on the value-added datasets provided by Johnson and Noguera (2012) and Johnson (2014).With regards to the bilateral trade flows, the most significant change appears in the value of trade imbalances between US and China. This is because the share of domestic contents containing in China’s exports to US is much lower than the share of other economies’ exports. This value would be even smaller if we adjust the results for processing trade (Johnson & Noguera, 2012; Wang, Wei, Yu, & Zhu, 2017; Wang, Wei, & Zhu, 2013). In addition, Panel A in Fig. 8 shows that the gap between the value added contents and total value of trade imbalances with US is rising for China. However, as illustrated in Panel B and Panel C, this share isquite stable for Japan and South Korea, with slight increases. South Korea’s trade surplus with US is almost the same with the two measurements, with a few exceptions in which the domestic value-added value was higher than the overall trade imbalances. It implicates that the production activities differ across economies.5. Further discussion5.1. Bilateral trade flows by sectorsThe main incentive for firms to split its production process is to seek lower cost around the world. Therefore, if the fragmentation of production contributes to the increase of bilateral trade imbalances between US and China, one should expect the conclusions in our previous discussion only hold for sectors that China has comparative advantages. Therefore, next we consider the correlation between China–US bilateral trade imbalances and the trade imbalances between China and South Korea, Japan and Taiwan, China as a group by sectors. It provides evidence consistent with our expectation. China’s trade deficit wit h East Asian economies and trade surplus with US only coexist in the manufacturing sector, which is where China’s comparative advantage lies. In addition, the negative correlation between the two balances of bilateral trade only exists for the agriculture and manufacturing sector, while the correlation is shown to be positive in the non-manufacturing industrial production7 and service sector.To support the argument that China mainly involves labor-intensive production process, we further investigate the share of value added in the tech-intensive industries and labor-intensive industries. The domestic value-added share of China’s exports to US in the labor-intensive sectors was raised from less than 45% in 1995 to more than 55% in 2009, while this value in the technology-intensive industries decreased sharply after China’s accession to WTO in 2001. The domestic value-added share was around 35% in 2009, which provides support of “fly-geese” story that firms in South Korea and Taiwan, China mainly moved their labor-intensive production activities, such as processing, to China.5.2. Bilateral trade flows of other economiesAs one of the many recipient economies of reallocated production activities from NIEs, China is not a special case in any sense. The above analysis holds for other low-wage economies in China’s neighborhood as well, such as Vietnam and India. The negative correlation discussed above is shown in the case of both India and Vietnam, and only exists in tech-intensive manufacturing industries. Therefore, as long as US still trades with other emerging economies with low wage, closing its deficit with China by imposing high import tariff would cause outmigration of labor-intensive manufacturing to other low-wage emerging economies and help little to bring employment back to the goods-producing sectors in US.5.3. Changes in patterns of China’s comparative advantagesThe main driving force of the fly-geese story and continuous reallocation of production activities across Asian economies is the variation of wages in this area. Cheap labor has played an important role in attracting the labor-intensive production process of the technology-intensive products to China and has contributed to the increase in China’s trade surplus with US. However, China’s wage i s now increasing, which will result in a loss of comparative advantages in the labor-intensive production activities. According to Li, Li, Wu, & Xiong (2012), real annual wages of Chinese urban workers in 1978 was 1004 US dollars, while this value has increased to 5487 US dollars in 2010. The fast wage growth started around 1998, with an annual growth rate at 13.8% during 1998–2010 (Li et al., 2012). In 2015, China’s average annual manufacturing wage was about 9165 measured in 2010 USD. It’s more than double of the wage rate in Thailand, and more than triple of the wage in all other economies shown in Fig. Although China’s labor productivity is estimated to grow at an annual rate of 11.3% during 1997–2010 (Li et al., 2012), China’s labor is still more expjavascript:void(0)ensive than these economies. It implies that the labor markets regulations are experiencing dramatic changes, which might also impact the locations choice of multinational firms.There are many factors that may explain China’s rising wage, s uchas the rapid growth and accumulation of capita, the labor market reforms, privatization of state-owned enterprises, spillover from multinational firms, shortage of unskilled labor, and the economic structural change. As a consequence of the dramatic in crease of China’s manufacturing wage, the production process, which was transplanted to China during the 1990s from NIEs has being reallocated to other economies with wages much lower than China, such as Vietnam, Cambodia, Bangladesh, India, Indonesia and even as far as Africa (Lin, 2012, Lin, 2013). Their average wage was still below 2000 USD in 2016. the FDI inflows to China dropped from 243.70 billion (measured in 2010 USD) in 2010 to 154.91 billion USD in 2016, while the outward FDI from China expanded from 57.95 billion to 197.28 billion. Meanwhile, the FDI inflows to Vietnam increased from 0.8 billion to 11.44 billion.There are two messages we can conclude from the discussion in this section. First, the pattern of China–US trade imbalances was mainly driven by the trade in sectors in which China has comparative advantages, mainly labor-intensive consumption-related manufacturing goods. Therefore, imposing border tariffs on imports from China will hurt US consumers. They will have to pay higher prices for goods either produced domestically or imported from other less competitive, labor-abundant countries. Second, even without imposing an extraordinary import tariff, there will be a reduction in China’s exports to the US due to thereallocation of manufacturing production activities to other low-wage economies as a result of the increasing wages in China.6. ConclusionIn this paper, we provide empirical evidences to show: (1) the East Asian economies are traditionally the major source of US’s trade defici ts and provider of labor-intensive manufacturing, consumer goods to the US due to the differences in comparative advantages between US and East Asian economies; (2) The relocation of labor-intensive manufacturing from other East Asian economies to China in a flying-geese pattern due to changing comparative advantages and the global production sharing contribute to the meteoric rise of China–US trade imbalances in the last three decades; (3) Even though the weight of China’s contribution to US’s trade deficit increased sharply after the 1990s, the contribution of East Asian economies as a group to US trade deficit in fact declined in the same period. Therefore, China and East Asian economies cannot be the main cause for the worsening of US trade imbalances after the 1970s; and (4) the China–US trade imbalance is expected to shrink with the rising of wage in China and the relocation of labor-intensive manufacturing from China to other low-wage labor abundant economies.From the above facts and analysis, Preside nt Trump’s pledge of China as the reason for US’s trade deficit is incorrect and his proposal to impose draconian tariffs on China’s imports to the US will make littlecontribution to reducing US’s overall trade imbalances and increasing US jobs. Such a measure may fasten the relocation of some manufacturing activities from China to other low-income economies and mitigate the US–China trade imbalance but not US’s total trade deficit. The US consumers will suffer if President Trump’s proposed tariff measure was implemented because they will have to pay higher prices for the imported manufacturing goods from either China or other economies.中文特朗普经济学与中美贸易失衡贾斯汀·伊夫林1.引言美国的贸易逆差从70年代中期之前的最低值扩大到2006年的峰值,达到7,610亿美元,约占美国GDP的5%。