Calibration of CMS calorimeters with LHC proton beam deflected by crystal
Height and gradient from shading
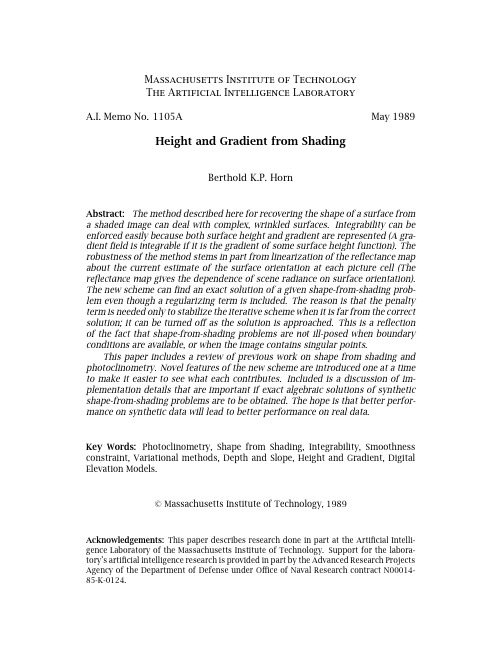
Massachusetts Institute of TechnologyThe Artificial Intelligence LaboratoryA.I.Memo No.1105A May1989Height and Gradient from ShadingBerthold K.P.HornAbstract:The method described here for recovering the shape of a surface from a shaded image can deal with complex,wrinkled surfaces.Integrability can be enforced easily because both surface height and gradient are represented(A gra-dientfield is integrable if it is the gradient of some surface height function).The robustness of the method stems in part from linearization of the reflectance map about the current estimate of the surface orientation at each picture cell(The reflectance map gives the dependence of scene radiance on surface orientation). The new scheme canfind an exact solution of a given shape-from-shading prob-lem even though a regularizing term is included.The reason is that the penalty term is needed only to stabilize the iterative scheme when it is far from the correct solution;it can be turned offas the solution is approached.This is a reflection of the fact that shape-from-shading problems are not ill-posed when boundary conditions are available,or when the image contains singular points.This paper includes a review of previous work on shape from shading and photoclinometry.Novel features of the new scheme are introduced one at a time to make it easier to see what each contributes.Included is a discussion of im-plementation details that are important if exact algebraic solutions of synthetic shape-from-shading problems are to be obtained.The hope is that better perfor-mance on synthetic data will lead to better performance on real data.Key Words:Photoclinometry,Shape from Shading,Integrability,Smoothness constraint,Variational methods,Depth and Slope,Height and Gradient,Digital Elevation Models.©Massachusetts Institute of Technology,1989 Acknowledgements:This paper describes research done in part at the Artificial Intelli-gence Laboratory of the Massachusetts Institute of Technology.Support for the labora-tory’s artificial intelligence research is provided in part by the Advanced Research Projects Agency of the Department of Defense under Office of Naval Research contract N00014-85-K-0124.1.BackgroundThefirst method developed for solving a shape-from-shading problem was restricted to surfaces with special reflecting properties[Rindfleisch66]. For the surfaces that Rindfleisch considered,profiles of the solution can be obtained by integrating along predetermined straight lines in the im-age.The general problem was formulated and solved later[Horn70, 75],using the method of characteristic strip expansion[Garabedian64] [John78]applied to the nonlinearfirst-order partial differential image ir-radiance equation.When the light sources and the viewer are far away from the scene being viewed,use of the reflectance map makes the anal-ysis of shape-from-shading algorithms much easier[Horn77][Horn& Sjoberg79].Several iterative schemes,mostly based on minimization of some functional containing an integral of the brightness error,arose later[Woodham77][Strat79][Ikeuchi&Horn81][Kirk84,87][Brooks& Horn85][Horn&Brooks86][Frankot&Chellappa88].The new method presented here was developed in part as a response to recent attention to the question of integrability1[Horn&Brooks86] [Frankot&Chellappa88]and exploits the idea of a coupled system of equations for depth and slope[Harris86,87][Horn88].It borrows from well-known variational approaches to the problem[Ikeuchi&Horn81] [Brooks&Horn85]and an existing least-squares method for estimat-ing surface shape given a needle diagram(see[Ikeuchi84],chapter11 in[Horn86],and[Horn&Brooks86]).For one choice of parameters,the new method becomes similar to one of thefirst iterative methods ever developed for shape from shading on a regular grid[Strat79],while it degenerates into another well-known method[Ikeuchi&Horn81]for a different choice of parameters.If the brightness error term is dropped, then it becomes a surface interpolation method[Harris86,87].The com-putational effort grows rapidly with image size,so the new method can benefit from proper multigrid implementation[Brandt77,80,84][Brandt &Dinar79][Hackbush85][Hackbush&Trottenberg82],as can existing iterative shape-from-shading schemes[Terzopolous83,84][Kirk84,87]. Alternatively,one can apply so-called direct methods for solving Poisson’s equations[Simchony,Chellappa&Shao89].Experiments indicate that linear expansion of the reflectance map about the current estimate of the surface gradient leads to more rapid convergence.More importantly,this modification often allows the scheme to converge when simpler schemes diverge,or get stuck in local minima of the functional.Most existing iterative shape-from-shading methods1A gradientfield is integrable if it is the gradient of some surface height function.2Height and Gradient from Shadinghandle only relatively simple surfaces and so could benefit from a retrofit of this idea.The new scheme was tested on a number of synthetic images of in-creasing complexity,including some generated from digital terrain mod-els of steep,wrinkled surfaces,such as a glacial cirque with numerous gullies.Shown in Figure1(a)is a shaded view of a digital terrain model, with lighting from the Northwest.This is the input provided to the algo-rithm.The underlying231×178digital terrain model was constructed from a detailed contour map,shown in Figure2,of Huntington ravine on the eastern slopes of Mount Washington in the White Mountains of New Hampshire2.Shown in Figure1(b)is a shaded view of the same digital terrain model with lighting from the Northeast.This is not available to the algorithm,but is shown here to make apparent features of the sur-face that may not stand out as well in the other shaded view.Figure1(c) shows a shaded view of the surface reconstructed by the algorithm,with lighting from the Northwest—it matches Figure1(a)exactly.More impor-tantly,the shaded view of the reconstructed surface with lighting from the Northeast,shown in Figure1(d),matches Figure1(b)exactly also3.With proper boundary conditions,the new scheme recovers surface orientation exactly when presented with noise-free synthetic scenes4.Pre-vious iterative schemes do notfind the exact solution,and in fact wander away from the correct solution when it is used as the initial guess.To ob-tain exact algebraic solutions,several details of the implementation have to be carefully thought through,as discussed in section6.Simple sur-faces are easier to process—with good results even when several of the implementation choices are not made in an optimal way.Similarly,these details perhaps may be of lesser importance for real images,where other error sources could dominate.In the next few sections we review image formation and other elemen-tary ideas underlying the usual formulation of the shape-from-shading problem.Photoclinometry is also briefly reviewed for the benefit of re-searchers in machine vision who may not be familiar with thisfield.We then discuss both the original and the variational approach to the shape-2The gullies are steep enough to be of interest to ice-climbers.3For additional examples of reconstructions from shaded images,see section7. 4In the examples tried,the algorithm always recovered the underlying surface orientation exactly at every picture cell,starting from a random surface ori-entationfield,provided that boundary information was available.Since the question of uniqueness of solutions has not been totally resolved,one cannot be quite certain that there may not be cases where a different solution might be found that happens to alsofit the given image data exactly.1.Background3Figure1.Reconstruction of surface from shaded image.See text.4Height and Gradient from ShadingFigure2.Contour map from which the digital terrain model used tosynthesize Figures1(a)and(b)was interpolated.The surface was mod-eled as a thin plate constrained to pass through the contours at thespecified elevations.The interpolating surface was found by solvingthe biharmonic equation,as described at the end of section5.4.from-shading problem.Readers familiar with the basic concepts may wish to skip over this material and go directly to section5,where the new scheme is derived.For additional details see chapters10and11in Robot Vision[Horn86]and the collection of papers,Shape from Shading[Horn &Brooks89].2.Review of Problem Formulation2.1Image Projection and Image IrradianceFor many problems in machine vision it is convenient to use a camera-2.Review of Problem Formulation5centered coordinate system with the origin at the center of projection and the Z-axis aligned with the optical axis(the perpendicular from the center of projection to the image plane)5.We can align the X-and Y-axes with the image plane x-and y-axes.Let the principal distance(that is,the perpendicular distance from the center of projection to the image plane) be f,and let the image plane be reflected through the center of projection so that we avoid sign reversal of the coordinates.Then the perspective projection equations arex=f XZand y=fYZ.(1)The shape-from-shading problem is simplified if we assume that the depth range is small compared with the distance of the scene from the viewer (which is often the case when we have a narrowfield of view,that is,when we use a telephoto lens).Then we havex≈fZ0X and y≈fZ0Y,(2)for some constant Z0,so that the projection is approximately orthographic. In this case it is convenient to rescale the image coordinates so that we can write x=X and y=Y.For work on shape from shading it is also convenient to use z,height above some reference plane perpendicular to the optical axis,rather than the distance measured along the optical axis from the center of projection.If we ignore vignetting and other imaging system defects,then im-age irradiance E at the point(x,y)is related to scene radiance L at the corresponding point in the scene by[Horn86]E=L π4df2cos4α,(3)where d is the diameter of the lens aperture,f is the principal distance, and the off-axis angleαis given bytanα=1fx2+y2.(4)Accordingly,image irradiance6is a multiple of the scene radiance,with the factor of proportionality depending inversely on the square of the f-5In photoclinometry it is customary to use an object-centered coordinate system.This is because surface shape can be computed along profiles only when strong additional constraint is provided,and such constraints are best expressed in an object-centered coordinate system.Working in an object-centered coordinate system,however,makes the formulation of the shape-from-shading problem considerably more complex(see,for example,[Rindfleisch66]).6Grey-levels are quantized estimates of image irradiance.6Height and Gradient from Shadingnumber7.If we have a narrowfield of view,the dependence on the off-axis angleαcan be neglected.Alternatively,we can normalize the image by dividing the observed image irradiance by cos4α(or whatever the actual vignetting function happens to be).We conclude from the above that what we measure in the image is directly proportional to scene radiance,which in turn depends on(a)the strength and distribution of illumination sources,(b)the surface micro-structure and(c)surface orientation.In order to be able to solve the shape from shading problem from a single image we must assume that the surface is uniform in its reflecting properties.If we also assume that the light sources are far away,then the irradiance of different parts of the scene will be approximately the same and the incident direction may be taken as constant.Finally,if we assume that the viewer is far away,then the direction to the viewer will be roughly the same for all points in the scene.Given the above,wefind that scene radiance does not depend on the position in space of a surface patch,only on its orientation.2.2Specifying Surface OrientationMethods for recovering shape from shading depend on assumptions about the continuity of surface height and its partial derivatives.First of all, since shading depends only on surface orientation,we must assume that the surface is continuous and that itsfirst partial derivatives exist.Most formulations implicitly also require that thefirst partial derivatives be continuous,and some even require that second partial derivatives exist. The existence and continuity of derivatives lends a certain“smoothness”to the surface and allows us to construct local tangent planes.We can then talk about the local surface orientation in terms of the orientation of these tangent planes.There are several commonly used ways of specifying the orientation of a planar surface patch,including:•Unit surface normalˆn[Horn&Brooks86];•Point on the Gaussian sphere[Horn84];•Surface gradient(p,q)[Horn77];•Stereographic coordinates(f,g)[Ikeuchi&Horn81];7The f-number is the ratio of the principal distance to the diameter of the aper-ture,that is,f/d.2.Review of Problem Formulation7•Dip and strike(as defined in geology)8;•Luminance longitude and latitude(as defined in astrogeology)9;•Incident and emittance angles(i and e)10;For our purposes here,the components of the surface gradientp=∂z∂xand q=∂z∂y,(5)will be most directly useful for specifying surface orientation.We can convert between different representations easily.For exam-ple,suppose that we are to determine the unit surface normal given the gradient components.We know that if we move a small distanceδx in x, then the change in height isδz=pδx(since p is the slope of the surface in the x direction).Thus(1,0,p)T is a tangent to the surface.If we move a small distanceδy in y,then the change in height isδz=qδy(since q is the slope of the surface in the y direction).Thus(0,1,q)T is also a tangent to the surface.The normal is perpendicular to all tangents,thus parallel to the cross-product of these particular tangents,that is parallel to(−p,−q,1)T.Hence a unit normal can be written in the formˆn=11+p2+q2(−p,−q,1)T.(6)Note that this assumes that the z-component of the surface normal is pos-itive.This is not a problem since we can only see surface elements whose normal vectors point withinπ/2of the direction toward the viewer—other surface elements are turned away from the viewer.We can use the same notation to specify the direction to a collimated light source or a small portion of an extended source.We simply give the orientation of a surface element that lies perpendicular to the incident8Dip is the angle between a given surface and the horizontal plane,while strike is the direction of the intersection of the surface and the horizontal plane.The line of intersection is perpendicular to the direction of steepest descent.9Luminance longitude and latitude are the longitude and latitude of a point ona sphere with the given orientation,measured in a spherical coordinate systemwith the poles at right angles to both the direction toward the source and the direction toward the viewer.10Incident and emittance angles are meaningful quantities only when there is a single source;and even then there is a two-way ambiguity in surface orienta-tion unless additional information is provided.The same applies to luminance longitude and latitude.8Height and Gradient from Shading light rays.So we can write11ˆs=11+p2s+q2s(−p s,−q s,1)T,(7)for some p s and q s.2.3Reflectance MapWe can show the dependence of scene radiance on surface orientation in the form of a reflectance map R(p,q).The reflectance map can be depicted graphically in gradient space12as a series of nested contours of constant brightness[Horn77,86].The reflectance map may be determined experimentally by mount-ing a sample of the surface on a goniometer stage and measuring its brightness under the given illuminating conditions for various orienta-tions.Alternatively,one may use the image of a calibration object(such as a sphere)for which surface orientation is easily calculated at every point.Finally,a reflectance map may be derived from a phenomenolog-ical model,such as that of a Lambertian surface.In this case one can integrate the product of the bidirectional reflectance distribution function (BRDF)and the given distribution of source brightness as a function of incident angle[Horn&Sjoberg79].An ideal Lambertian surface illuminated by a single point source pro-vides a convenient example of a reflectance map13.Here the scene radi-ance is given by R(p,q)=(E0/π)cos i,where i is the incident angle(the angle between the surface normal and the direction toward the source), while E0is the irradiance from the source on a surface oriented perpendic-ular to the incident rays.(The above formula only applies when i≤π/2; the scene radiance is,of course,zero for i>π/2.)Now cos i=ˆn·ˆs,soR(p,q)=E0π1+p s p+q s q1+p2+q21+p2s+q2s,(8)as long as the numerator is positive,otherwise R(p,q)=0.11There is a small problem,however,with this method for specifying the direction toward the light source:A source may be“behind”the scene,with the direction to the source more thanπ/2away from the direction toward the viewer.In this case the z-component of the vector pointing toward the light source is negative. 12The coordinates of gradient space are p and q,the slopes of the surface in the x and y direction respectively.13Note that shape-from-shading methods are most definitely not restricted to Lambertian surfaces.Such special surfaces merely provide a convenient peda-gogical device for illustrating basic concepts.2.Review of Problem Formulation92.4Image Irradiance EquationWe are now ready to write down the image irradiance equation E(x,y)=βR p(x,y),q(x,y) ,(9)where E(x,y)is the irradiance at the point (x,y)in the image,while R(p,q)is the radiance at the corresponding point in the scene,at which p =p(x,y)and q =q(x,y).The proportionality factor βdepends on the f -number of the imaging system (and may include a scaling factor that depends on the units in which the instrument measures brightness).It is customary to rescale image irradiance so that this proportionality factor may be dropped.If the reflectance map has a unique global extremum,for example,then the image can be normalized in this fashion,provided that a point can be located that has the corresponding surface orientation 14.Scene radiance also depends on the irradiance of the scene and a re-flectance factor (loosely called albedo here).These factors of proportion-ality can be combined into one that can be taken care of by normaliza-tion of image brightness.Then only the geometric dependence of image brightness on surface orientation remains in R(p,q),and we can write the image irradiance equation in the simple form E(x,y)=R p(x,y),q(x,y) (10)orE(x,y)=R z x (x,y),z y (x,y) ,(11)where p =z x and q =z y are the first partial derivatives of z with respect to x and y .This is a first-order partial differential equation;one that is typically nonlinear,because the reflectance map in most cases depends nonlinearly on the gradient.2.5Reflectance Map Linear in GradientViewed from a sufficiently great distance,the material in the maria of the moon has the interesting property that its brightness depends only on luminance longitude,being independent of luminance latitude [Hapke 63,65].When luminance longitude and latitude are related to the incident and emittance angles,it is found that longitude is a function of (cos i/cos e).From the above we see that cos i =ˆn ·ˆs ,while cos e =ˆn ·ˆv ,where ˆv =14If there is a unique maximum in reflected brightness,it is convenient to rescale the measurements so that this extremum corresponds to E =1.The same applies when there is a unique minimum,as is the case for the scanning electron microscope (SEM).10Height and Gradient from Shading (0,0,1)T is a unit vector in the direction toward the viewer.Consequently,cos i cos e =ˆn·ˆsˆn·ˆv=11+p2s+q2s(1+p s p+q s q).(12)Thus(cos i/cos e)depends linearly on the gradient components p and q, and we can writeR(p,q)=f(c p+s q),(13) for some function f and some coefficients c and s.Both Lommel-Seeliger’s and Hapke’s functionsfit this mold[Minnaert61][Hapke63,65].(For a few other papers on the reflecting properties of surfaces,see[Hapke81, 84][Hapke&Wells81]and the bibliography in[Horn&Brooks89].)We can,without loss of generality15,arrange for c2+s2=1.If the function f is continuous and monotonic16,we canfind an in-versec p+s q=f−1E(x,y).(14)The slope in the image direction(c,s)ism=c p+s q√c2+s2=1√c2+s2f−1E(x,y).(15)We can integrate17out this slope along the linex(ξ)=x0+cξand y(ξ)=y0+sξ,(16) to obtainz(ξ)=z0+1√c2+s2ξf−1Ex(η),y(η)dη.(17)An extension of the above approach allows one to take into account per-spective projection as well asfinite distance to the light source[Rind-fleisch66].Two changes need to be made;one is that the reflectance map now is no longer independent of image position(since the directions to the viewer and the source vary significantly);and the other that the integral is for the logarithm of the radial distance from the center of projection, as opposed to distance measured parallel to the optical axis.The above was thefirst shape-from-shading or photoclinometric prob-lem ever solved in other than a heuristic fashion.The original formulation was considerably more complex than described above,as the result of the15We see that c:s=p s:q s,so that the direction specified in the image by(c,s) is the direction“toward the source,”that is,the projection into the image plane of the vectorˆs toward the light source.16If the function f is not monotonic,there will be more than one solution for certain brightness values.In this case one may need to introduce assumptions about continuity of the derivatives in order to decide which solution to choose. 17The integration is,of course,carried out numerically,since the integrand is derived from image measurements and not represented as an analytic function.2.Review of Problem Formulation 11use of full perspective projection,the lack of the notion of anything like the reflectance map,and the use of an object-centered coordinate system[Rindfleisch 66].Note that we obtain profiles of the surface by integrating along pre-determined straight lines in the image.Each profile has its own unknown constant of integration,so there is a great deal of ambiguity in the recov-ery of surface shape.In fact,if z(x,y)is a solution,so isz(x,y)=z(x,y)+g(s x −c y)(18)for an arbitrary function g !This is true becausez x =z x +s g (s x −c y)and z y =z y −c g (s x −c y),(19)so c p +s q =c p +s q,(20)where p =z x and q =z y .It follows that R(p,q)=R(p,q).This ambi-guity can be removed if an initial curve is given from which the profiles can be started.Such an initial curve is typically not available in practice.Ambiguity is not restricted to the special case of a reflectance map that is linear in the gradient:Without additional constraint shape-from-shading problems typically do not have a unique solution.2.6Low Gradient Terrain and Oblique IlluminationIf we are looking at a surface where the gradient (p,q)is small,we can approximate the reflectance map using series expansionR(p,q)≈R(0,0)+p R p (0,0)+q R q (0,0).(21)This approach does not work when the reflectance map is rotationally symmetric,since the first-order terms then drop out 18.If the illumination is oblique,however,we can apply the method in the previous section to get a first estimate of the surface.Letting c =R p (0,0),s =R q (0,0)and f −1 E(x,y) =E(x,y)−R(0,0),(22)we find thatz(ξ)=z 0+1R 2p (0,0)+R 2q (0,0) ξ0 E x(η),y(η) −R(0,0)dη.(23)(For a related frequency domain approach see [Pentland 88].)One might imagine that the above would provide a good way to get initial conditions for an iterative shape from shading method.Unfortu-nately,this is not very helpful,because of the remaining ambiguity in the 18The reflectance map is rotationally symmetric,for example,when the source is where the viewer is,or when an extended source is symmetrically distributed about the direction toward the viewer.12Height and Gradient from Shadingdirection at right angles to that of profile integration.Iterative methods already rapidly get adequate variations in height along“down-sun pro-files,”but then struggle for a long time to try to get these profiles tied together in the direction at right angles.The above also suggests that errors in gradients of a computed so-lution are likely to be small in the direction towards or away“from the source”and large in the direction at right angles.It should also be clear that it is relatively easy tofind solutions for slowly undulating surfaces (where p and q remain small)with oblique illumination(as in[Kirk87]).It is harder to deal with cases where the surface gradient varies widely,and with cases where the source is near the viewer(see also the discussion in section7.3).3.Brief Review of PhotoclinometryPhotoclinometry is the recovery of surface slopes from images[Wilhelms64] [Rindfleisch66][Lambiotte&Taylor67][Watson68][Lucchitta&Gam-bell70][Tyler,Simpson&Moore71][Rowan,McCauley&Holm71][Bonner &Small73][Wildey75][Squyres81][Howard,Blasius&Cutt82].Many pa-pers and abstracts relating to this subject appear in places that may seem inaccessible to someone working in machine vision[Davis,Soderblom, &Eliason82][Passey&Shoemaker82][Davis&McEwen84][Davis& Soderblom83,84][Malin&Danielson84][Wilson et al.84][McEwen85] [Wilson et al.85](For additional references see Shape from Shading[Horn &Brooks89]).Superficially,photoclinometry may appear to be just an-other name for shape from shading.Two different groups of researchers independently tackled the problem of recovering surface shape from spa-tial brightness variations in single images.Astrogeologists and workers in machine vision became aware of each other’s interests only a few years ago.The underlying goals of the two groups are related,but there are some differences in approach that may be worthy of a brief discussion.3.1Photoclinometry versus Shape from Shading•First,photoclinometry has focused mostly on profile methods(pho-toclinometrists now refer to existing shape-from-shading methods as area-based photoclinometry,as opposed to profile-based).This came about in large part because several of the surfaces of interest to the astrogeologist have reflecting properties that allow numeri-cal integration along predetermined lines in the image,as discussed3.Brief Review of Photoclinometry13above in section2.5[Rindfleisch66].Later,a similar profile integra-tion approach was applied to other kinds of surfaces,by using strong assumptions about local surface geometry instead.The assumption that the surface is locally cylindrical leads to such a profile integra-tion scheme[Wildey86],for example.More commonly,however,it has been assumed that the cross-track slope is zero,in a suitable object-centered coordinate system[Squyres81].This may be reason-able when one is considering a cross-section of a linearly extended feature,like a ridge,a graben,or a central section of a rotationally symmetric feature like a crater.•The introduction of constraints that are easiest to express in an object-centered coordinate system leads away from use of a camera-centered coordinate system and to complex coordinate transformations that tend to obscure the underlying problem.A classic paper on photo-clinometry[Rindfleisch66]is difficult to read for this reason,and asa result had little impact on thefield.On the other hand,it must beacknowledged that this paper dealt properly with perspective projec-tion,which is important when thefield of view is large.In all but the earliest work on shape from shading[Horn70,75],the assump-tion is made that the projection is approximately orthographic.This simplifies the equations and allows introduction of the reflectance map.•The inherent ambiguity of the problem does not stand out as ob-viously when one works with profiles,as it does when one tries to fully reconstruct surfaces.This is perhaps why workers on shape from shading have been more concerned with ambiguity,and why they have emphasized the importance of singular points and occlud-ing boundaries[Bruss82][Deift&Sylvester81][Brooks83][Blake, Zisserman&Knowles85][Saxberg88].•The recovery of shape is more complex than the computation of a set of profiles.Consequently much of the work in shape from shading has been restricted to simple shapes.At the same time,there has been extensive testing of shape from shading algorithms on synthetic data.This is something that is important for work on shape from shading, but makes little sense for the study of simple profile methods,except to test for errors in the procedures used for inverting the photometric function.•Shape-from-shading methods easily deal with arbitrary collections of collimated light sources and extended sources,since these can be ac-commodated in the reflectance map by integrating the BRDF and the。
关注我英文作文开头结尾

关注我英文作文开头结尾英文,Attention! Crafting an engaging English essaythat captivates readers from the outset to the conclusion requires a delicate balance of creativity, clarity, and cohesion. Fear not, as I guide you through the intricacies of constructing compelling introductions and conclusions.To kick off your essay with a bang, consider employing a provocative question, a fascinating fact, or a compelling anecdote. For instance, you could begin with a rhetorical question such as, "Have you ever pondered the profound impact of technology on modern society?" This immediately piques the reader's curiosity and encourages them to delve deeper into your essay.Another effective approach is to start with a vivid description that sets the scene and draws readers into your narrative. For example, "The sun dipped below the horizon, casting long shadows across the deserted street as I embarked on a journey that would change my life forever."Such imagery transports the reader into the heart of your story, creating an emotional connection from the outset.Moving on to the conclusion, it's essential to leave a lasting impression on your readers while neatly tying upthe themes and arguments presented in your essay. Avoid introducing new information in the conclusion; instead, focus on reinforcing your main points and leaving thereader with a thought-provoking insight or a call to action.One effective strategy is to end with a memorable quote that encapsulates the essence of your essay. For example, you could conclude with a timeless aphorism like, "In the end, it's not the years in your life that count. It's thelife in your years." This leaves readers with a sense of reflection and imbues your essay with a sense of profundity.Alternatively, you could conclude with a hypothetical scenario that encourages readers to envision theimplications of your essay's arguments in real life. For instance, "Imagine a world where every individual took responsibility for their environmental impact. It's avision within reach if we dare to take action today."In summary, a captivating essay begins with a compelling introduction that grabs the reader's attention and sets the stage for what's to come. It concludes with a poignant ending that leaves a lasting impression and inspires further reflection. By mastering the art of crafting engaging introductions and conclusions, you can elevate your writing to new heights and leave a lasting impact on your audience.中文,关注!打造一篇引人入胜的英语文章,从开头到结尾都能吸引读者的注意力,需要巧妙地平衡创造力、清晰度和连贯性。
Firstmark Aerospace Standby Compass Calibrator说明书

Firstmark Aerospace 1176 Telecom Drive Creedmoor, NC 27522, USAINTRODUCTION:The Standby Compass Calibrator is designed to permit accurate compensation of permanent magnetization errors and completion of the compass calibration card for an aircraft's standby compass without physically rotating the aircraft. Standby compasses are now compensated by physical rotation of the aircraft, either on the ground or in the air. Use of the Standby Compass Calibrator eliminates the need for conventional airborne or ground swinging processes, allowing the standby compass to be compensated more rapidly and inexpensively.PRINCIPLE OF OPERATION:The Standby Compass Calibrator performs two separate functions:1. Cancels the Earth's fieldat the standby compass.2. Adds a standardmagnetic field which can be rotated to simulate aircraft heading which permits compass error to be determined without physical rotation of the aircraft. The Earth's field in the vicinity of the standby compass is canceled by amagnet assembly. A wide range of field strengths may be obtained to permit cancellation of the Earth's field at any location on the surface of the Earth by means of an adjustment screw . This adjustment is performed at the actual compass calibration site. The magnet assembly also provides an adjustment to compensate for misalignment of the aircraft with respect to a north-south line.Standby Compass Calibrator Set Part Number 2591553-903 StandbyCompass CalibrationTypical Standby CompassEliminates the Physical Rotation of the Aircraft by Setting a DialTECHNICAL OVERVIEWFirstmark Aerospace1176 Telecom Drive Creedmoor, NC 27522, USA The standby compass calibrator is attached to the aircraft standby compass or by means of a mounting bracket. Thesimulated magnetic field is produced by magnets in the knob assembly. This simulated magnetic field is rotated in 15 degree increments to produce the desired compass heading. This procedure is performed as required on any aircraft without readjustment of the canceling magnet assembly.MAGNET ADJUSTMENT PROCEDURE:The cancellation of the Earth's magnetic field by adjustment of the magnet assembly normalizes the Standby Compass Calibrator for subsequent use for standby compass calibration. The set includes the following:Description Firstmark Part Number Standby Compass Calibrator 2591553-901 Turntable 2969011-1 Tripod 2968806 Master Compass 2593239Note: Additional mounting bracket required for the B747-400. Additional mounting bracket and Master Compass required for Airbus aircraft.(1) A non-magnetic tripod and turntable are set up adjacent to the compass calibration site. The turntable site must be within an approximate 20-foot distance of the position the standby compass will assume when the aircraft is positioned along the north line. This is to ensure that the Earth's magnetic field at the aircraft standby compass and at the turntable site are nearly identical.(2) The mounting bracket is removed from the calibrator, and the Master Compass is attached to the bracket.(3) The compass and bracket are mounted on the turntable and rotated until the compass indicates a north heading.(4) The Standby Compass Calibrator is attached to the mounting bracket with the magnet assembly misalignment adjustment set to 0 degrees.(5) The knob assembly is adjusted to the "E” position. The magnet assembly is then adjusted until the compass indicates "E" or 90 degrees.(6) The knob assembly is then adjusted to the "W" position, and the magnet assembly is adjusted to remove one half the error between the indicated compass reading and "W" or 270 degrees.The Standby Compass Calibrator is now normalized to the local magnetic field. The canceling magnet assembly will exactly cancel the Earth's field at the swing location. It should not be necessary to repeat this procedure except for a periodic check, typically every 90 days.COMPASS CALIBRATION PROCEDURE:(1) The aircraft is towed into position on a surveyed north-south line, with the aircraft heading north.(2) The angular difference between the aircraft heading and the north-south line is determined and the canceling magnet assembly, which has a range of + 2 degrees, is adjusted to compensate for the measured angular misalignment.(3) The Standby Compass Calibrator is attached to the standby compass as it is mounted in the instrument area by means of 2 of the 4 mounting screws. The Standby Compass Calibrator may be mounted in an upright or inverted position, so that the compass compensation adjustments are accessible.(4) The knob assembly is rotated to the four cardinal headings and the standby compass compensation is adjusted in the usual manner.(5) The knob assembly is then positioned to each 15-degree increment from 0 through 345 degrees. At each 15-degree increment, the compass reading is noted and the compass calibration card completed.ATTACHMENT TO THE STANDBY COMPASSThe Standby Compass Calibrator is attached to the front of the standby compass. Sufficient space must be available in front of the standby compass for the calibrator. The dimensions of the calibrator are shown below.Accuracy (rms) ± 2.5 degrees Ambient Field Range0.06 to 0.42 oerstedMisalignment Adjustment Range ± 2 degreesWeight 1.6 lb.Outline Dimensions9.47 X 3.56 X 3.63 in.SPECIFICATIONS:To buy, sell, rent or trade-in this product please click on the link below:/Firstmark-Aerospace-2591553-903-Standby-Compass-Calibrator.aspx。
英语作文编小故事

英语作文编小故事Once upon a time, in a quaint little village nestled between rolling hills and lush green forests, there lived a young boy named Oliver. Oliver was known for his adventurous spirit and boundless imagination. Every day after school, he would rush to the nearby woods, where he would embark on thrilling expeditions and discover hidden treasures.One sunny afternoon, while exploring deeper into the woods than ever before, Oliver stumbled upon a mysterious cave hidden beneath a towering oak tree. Intrigued by the cave's dark entrance, Oliver hesitated for only a moment before bravely stepping inside.As he ventured deeper into the cave, Oliver's heart raced with excitement. The air grew cooler, and strange whispers echoed off the cavern walls. Ignoring the eerie sounds, Oliver pressed on, determined to uncover the secrets hidden within.After what seemed like hours of winding passages and narrow tunnels, Oliver finally reached a large chamber bathed in a soft, golden light. In the center of the chamber stood a magnificent crystal, pulsating with otherworldly energy. Mesmerized by its beauty, Oliver approached the crystal cautiously.Suddenly, a voice echoed through the chamber, causing Oliver to jump in surprise. "Greetings, young traveler," the voice said, its tone gentle yet powerful. "You have shown great courage to venture this far. But tell me, what brings you to this sacred place?"Heart pounding with excitement, Oliver explained how he stumbled upon the cave and his insatiable curiosity led him deeper inside. The voice chuckled softly before revealing its true identity—a wise and ancient spirit that had watched over the forest for centuries.Impressed by Oliver's bravery and pure heart, thespirit offered him a choice: he could either take aprecious gem from the crystal, which would grant him great wealth and power, or he could leave the cave empty-handed but with the knowledge and wisdom gained from his journey.After much deliberation, Oliver made his decision. "I choose knowledge and wisdom," he declared with unwavering resolve. "For true treasure lies not in material wealth, but in the lessons we learn and the experiences we gain."Moved by Oliver's selfless choice, the spirit smiled warmly and bestowed upon him the gift of wisdom. With newfound clarity and understanding, Oliver bid farewell to the spirit and made his way out of the cave, his heart light and spirits high.From that day forward, Oliver's adventures took on a new meaning. Armed with the wisdom he gained from his encounter with the ancient spirit, he continued to explore the world around him, spreading kindness and joy wherever he went.And though he never did find any more hidden treasuresin the woods, Oliver knew that the greatest treasure of all was the knowledge that he carried in his heart—a treasure that no amount of gold or jewels could ever rival.。
有关指南针的英语小作文

The compass is an ancient navigational instrument that has been used for centuries to determine direction relative to the geographic cardinal directions.Its primary function is to indicate the cardinal directions of the Earth,which are North,South,East,and West, and the intermediate directions between them.The History of the CompassThe compass originated in China during the Han Dynasty206BC220AD and was initially used for divination and geomancy.It was later adopted for navigation purposes, and its use spread to the West via the Silk Road.The first compasses were made of lodestone,a naturally magnetized mineral,which was carved into a spoon shape and allowed to rotate freely on a smooth surface.These early compasses were known as sinan.The Compass TodayModern compasses are typically made of a magnetic needle or dial housed within a protective casing,which is often filled with a liquid to dampen needle oscillation and provide a more stable reading.The needle aligns itself with the Earths magnetic field, pointing towards the magnetic North Pole,which is close to the geographic North Pole. How a Compass WorksThe Earth itself acts as a giant magnet,with a magnetic field that extends into space.The magnetic field is generated by the motion of molten iron in the Earths outer core.The compass needle is magnetized and,when free to rotate,aligns itself with the Earths magnetic field.The needles north end is attracted to the Earths magnetic north pole,and the south end is attracted to the magnetic south pole.Types of Compasses1.Base Plate Compass:This is the most common type of compass,used for general navigation.It has a rotating magnetic needle and a fixed orienting arrow,which is used to align the compass with the Earths magnetic field.2.Liquid Damped Compass:This type of compass is used in aviation and marine navigation.The liquid inside the compass casing helps to stabilize the needle,providing a more accurate and quickresponding reading.3.Silva Compass:A popular brand of compasses known for their durability and accuracy, often used in outdoor activities such as hiking and orienteering.4.Digital Compass:These compasses use electronic sensors to determine direction and display it on a digital screen.They are often used in conjunction with GPS devices for more precise navigation.Uses of the CompassNavigation:Compasses are essential tools for navigating in areas where landmarks are scarce or visibility is limited.Orientation:They help orient maps to the real world,allowing for more accurate route planning.Emergency Situations:In the absence of electronic navigation aids,a compass can be a lifesaver,helping individuals find their way out of wilderness areas or back to civilization. ConclusionThe compass is a simple yet powerful tool that has been integral to human exploration and survival.Its ability to provide a reliable sense of direction has made it an indispensable part of many outdoor activities and professions,from hiking and sailing to military operations and space exploration.Understanding how to use a compass is a valuable skill that can enhance ones ability to navigate and explore the world.。
STMicroelectronics 3GPID+1 常态监测仪的纠正因子、离子吸收能量和计算特性说

Correction Factors, Ionization Energies, And Calibration Characteristics For 3GPID+1 MonitorsCorrection Factors & Ionization Energies*Photoionization Detector sensors (PIDs) can be used for the detection of a wide variety of gases that exhibit different responses. In general, any compound with ionization energy (IE) lower than that of the lamp photons can be measured.* The best way to calibrate an instrument equipped with a PID sensor to different compounds is to use a standard of the gas of interest. However, correction factors have been determined that enable the user to quantify a large number of chemicals using only a single calibration gas, typically isobutylene. In our PIDs, correction factors can be used in one of three ways:1. Calibrate the monitor with isobutylene in the usual fashion to read in Isobutylene equivalents.Manually multiply the reading by the correction factor (CF) to obtain the concentration of the gas being measured.2. Calibrate the unit with isobutylene in the usual fashion to read in Isobutylene equivalents. Call up thecorrection factor from the instrument memory or download it from a personal computer and then call it up. The monitor will then read directly in units of the gas of interest.3. Calibrate the unit with Isobutylene, but input an equivalent, “corrected” span gas concentration whenprompted for this value. The unit will then read directly in units of the gas of interest.* The term “ionization energy” is more scientifically correct and replaces the old term “ionization potential.” High-boiling (“heavy”) compounds may not vaporize enough to give a response even when their ionization energies are below the lamp photon energy. Some inorganic compounds like H2O2 and NO2 give weak response even when their ionization energies are well below the lamp photon energy.Example 1:With the unit calibrated to read Isobutylene equivalents, the reading is 10 ppm with a 10.6 eV lamp. The gas being measured is Butyl Acetate, which has a correction factor of 2.6. Multiplying 10 by 2.6 gives an adjusted Butyl Acetate value of 26 ppm. Similarly, if the gas being measured were Trichloroethylene (CF = 0.54), the adjusted value with a 10 ppm reading would be 5.4 ppm.Example 2:With the unit calibrated to read isobutylene equivalents, the reading is 100 ppm with a 10.6 eV lamp. The gas measured is m-Xylene (CF = 0.43). After downloading this factor, the unit should read about 43 ppm when exposed to the same gas, and thus read directly in m-Xylene values.Example 3:The desired gas to measure is Ethylene Dichloride (EDC). The CF is 0.6 with an 11.7 eV lamp. During calibration with 100 ppm isobutylene, insert 0.6 times 100, or 60 at the prompt for the calibration gas concentration. The unit then reads directly in EDC values.1 3GPID+ Instruments are: MiniRAE Lite+, MiniRAE3000+, ppbRAE3000+, UltraRAE3000+Conversion to mg/m3To convert from ppm to mg/m3, use the following formula:Conc. (mg/m3) = [Conc.(ppmv) x mol. wt. (g/mole)]molar gas volume (L)For air at 25°C (77°F), the molar gas volume is 24.4 L/mole and the formula reduces to:Conc.(mg/m3) = Conc.(ppmv) x mol. wt. (g/mole) x 0.041For example, if the instrument is calibrated with a gas standard in ppmv, such as 100 ppm Isobutylene, and the user wants the display to read in mg/m3 of Hexane, whose m.w. is 86 and CF is 4.3, the overall correction factor would be 4.3 x 86 x 0.041 equals 15.2.Correction Factors for MixturesThe correction factor for a mixture is calculated from the sum of the mole fractions Xi of each component divided by their respective correction factors CFi:CFmix = 1 / (X1/CF1 + X2/CF2 + X3/CF3 + ... Xi/CFi)Thus, for example, a vapor phase mixture of 5% Benzene and 95% n-Hexane would have a CFmix of CFmix = 1 / (0.05/0.53 + 0.95/4.3) = 3.2. A reading of 100 would then correspond to 320 ppm of the total mixture, comprised of 16 ppm Benzene and 304 ppm Hexane.For a spreadsheet to compute the correction factor and TLV of a mixture see the appendix at the end of the CF table.TLVs and Alarm Limits for MixturesThe correction factor for mixtures can be used to set alarm limits for mixtures. To do this one first needs to calculate the exposure limit for the mixture. The Threshold Limit Value (TLV) often defines exposure limits. The TLV for the mixture is calculated in a manner similar to the CF calculation:In the above example, the 8-h TLV for Benzene is 0.5 ppm and for n-Hexane 50 ppm. Therefore, the TLV of the mixture is TLVmix = 1 / (0.05/0.5 + 0.95/50) = 8.4 ppm, corresponding to 8.0 ppm Hexane and 0.4 ppm Benzene. For an instrument calibrated on isobutylene, the reading corresponding to the TLV is:TLV mix = 1 / (X1/TLV1 + X2/TLV2 + X3/TLV3 + ... Xi/TLVi)A common practice is to set the lower alarm limit to half the TLV, and the higher limit to the TLV. Thus, one would set the alarms to 1.3 and 2.6 ppm, respectively.CALIBRATION CHARACTERISTICSA. Flow Configuration. PID response is essentially independent of gas flow rate as long as it is sufficient tosatisfy the pump demand. Four main flow configurations are used for calibrating a PID:1. Pressurized gas cylinder (Fixed-flow regulator):The flow rate of the regulator should match the flowdemand of the instrument pump or be slightly higher.2. Pressurized gas cylinder (Demand-flow regulator):A demand-flow regulator better matches pumpspeed differences, but results in a slight vacuum during calibration and thus slightly high readings.3. Collapsible gas bag:The instrument will draw the calibration gas from the bag at its normal flowrate, as long as the bag valve is large enough. The bag should be filled with enough gas to allow atleast one minute of flow (~ 0.5 L for a MiniRAE3000+, ~0.3 L for MultiRAE).4. T (or open tube) method:The T method uses a T-junction with gas flow higher than the pump draw.The gas supply is connected to one end of the T, the instrument inlet is connected to a second end ofthe T, and excess gas flow escapes through the third, open end of the T. To prevent ambient airmixing, a long tube should be connected to the open end, or a high excess rate should be used.Alternatively, the instrument probe can be inserted into an open tube slightly wider than the probe.Excess gas flows out around the probe.The first two cylinder methods are the most efficient in terms of gas usage, while the bag and T methods give slightly more accurate results because they match the pump flow better.B. Pressure. Pressures deviating from atmospheric pressure affect the readings by altering gas concentrationand pump characteristics. It is best to calibrate with the instrument and calibration gas at the same pressure as each other and the sample gas. (Note that the cylinder pressure is not relevant because the regulator reduces the pressure to ambient.) If the instrument is calibrated at atmospheric pressure in one of the flow configurations described above, then (1) pressures slightly above ambient are acceptable but highpressures can damage the pump and (2) samples under vacuum may give low readings if air leaks into the sample train.C. Temperature. Because temperature effects gas density and concentration, the temperature of thecalibration gas and instrument should be as close as possible to the ambient temperature where the unit will be used. We recommend that the temperature of the calibration gas be within the instrument’s temperature specification (typically, 14° to 113° F, or -10° to 45° C). Also, during actual measurements, the instrument should be kept at the same or higher temperature than the sample temperature to avoid condensation in the unit.D. Matrix. The matrix gas of the calibration compound and VOC sample is significant. Some common matrixcomponents, such as methane and water vapor can affect the VOC signal. PIDs are most commonly used for monitoring VOCs in air, in which case the preferred calibration gas matrix is air. For a MiniRAE,methane, methanol, and water vapor reduce the response by about 20% when their concentration is 15,000 ppm and by about 40% at 30,000 ppm. Despite earlier reports of oxygen effects, RAE PID responses with10.6 eV lamps are independent of oxygen concentration, and calibration gases in a pure nitrogen matrixcan be used. H2 and CO2 up to 5 volume % also have no effect.E. Concentration. Although Honeywell PIDs have electronically linearized output, it is best to calibrate in aconcentration range close to the actual measurement range. For example, 100 ppm standard gas for anticipated vapors of 0 to 250 ppm, and 500 ppm standard for expected concentrations of 250 to 1000 ppm.The correction factors in this table were typically measured at 50 to 100 ppm and apply from the ppb range up to about 1,000 ppm. Above 1,000 ppm the CF may vary and it is best to calibrate with the gas of interest near the concentration of interest.F. Filters. Filters affect flow and pressure conditions and therefore all filters to be used during sampling shouldalso be in place during calibration. Using a water trap (hydrophobic filter) greatly reduces the chances of drawing water aerosols or dirt particles into the instrument. Regular filter replacements are recommended because dirty filters can adsorb VOCs and cause slower response time and shifts in calibration.G. Instrument Design. High-boiling (“heavy”) or very reactive compounds can be lost by reaction or adsorptiononto materials in the gas sample train, such as filters, pumps and other sensors. Multi-gas meters, including MultiRAE and AreaRAE have the pump and other sensors upstream of the PID and are prone to these losses. Compounds possibly affected by such losses are shown in green in the table, and may give slow response, or in extreme cases, no response at all. In many cases the multi-gas meters can still give a rough indication of the relative concentration, without giving an accurate, quantitative reading. The 3GPID series instruments have inert sample trains and therefore do not exhibit significant loss; nevertheless, response may be slow for the very heavy compounds and additional sampling time up to a minute or more should be allowed to get a stable reading.DISCLAIMERTN-106C is a general guideline for Correction Factors (CF) for use with PID instruments manufactured by Honeywell. The CF may vary, depending on instrument and operation conditions. For the best accuracy, it is recommended to calibrate the instrument to target gas. Actual readings may vary with age and cleanliness of lamp, relative humidity, and other factors, as well. For accurate work, the instrument should be calibrated regularly under the operating conditions used. The factors in this table on the following pages were measured in dry air (40 to 50% RH) at room temperature, typically at 50 to 100 ppm. CF values may vary above about 1,000 ppm.IMPORTANT!Even though the same sensor may be used in different instruments (MultiRAE Series and ToxiRAE Pro, for example), the firmware and design of the instruments are different, The CF are therefore customized for best performance within the specific instrument, as confirmed by our lab tests.Note: These CF are specific to the instruments cited in these notes, and do not apply to instruments not manufactured by Honeywell. In addition, these lamps and sensors should not be used in instruments by other manufacturers because their performance cannot be guaranteed.UpdatesThe values in this table on the following pages are subject to change as more or better data become available. Watch for updates of this table on the Internet.IE data are taken from the CRC Handbook of Chemistry and Physics, 73rd Edition, D.R. Lide (Ed.), CRC Press (1993) and NIST Standard Ref. Database 19A, NIST Positive Ion Energetics, Vers. 2.0, Lias, et.al., U.S. Dept. Commerce (1993).TABLE ABBREVIATIONSCF = Correction Factor (multiply by reading to get corrected value for the compound when calibrated to isobutylene)ND = Not DetectableNCF = No Correction FactorMW = Molecular weightCAS No. = CAS Registry NumberIE = Ionization EnergyNote: The term "ionization energy" is more scientifically correct and replaces the old term "ionization potential." High-boiling ("heavy") compounds may not vaporize enough to give a response even when their ionization energies are below the lamp photon energy. Some inorganic compounds like H2O2 and NO2 give weak response even when their ionization energies are well below the lamp photon energy.IMPORTANT!Not every 3GPID+ instrument can support the three lamps listed in following table. Pease refer to the price guide/datasheet.Note: The Correction Factors shown here are included in the Correction Factor Library in firmware version rev 2.20 for the 3GPID+ family of instruments.。
ASTM D 2171-01用真空毛细管粘度计测定沥青粘度的标准试验方法

Designation:D2171–016.1.3Modified Koppers Vacuum Viscometer(MKVV),as described in Appendix X3.Calibrated viscometers are avail-able from commercial suppliers.Details regarding calibration of viscometers are given in Appendix X4.N OTE3—The viscosity measured in a CMVV may be from1to5% lower than either the AIVV or MKVV having the same viscosity range. This difference,when encountered,may be the result of non-Newtonian flow.46.2Thermometers—Calibrated liquid-in-glass thermom-eters(see Table X5.1)of an accuracy after correction of0.02°C (0.04°F)can be used or any other thermometric device of equal accuracy.ASTM Kinematic Viscosity Thermometers47°C and 47°F are suitable for the most commonly used temperature of 60°C(140°F).6.2.1The specified thermometers are standardized at“total immersion,”which means immersion to the top of the mercury column with the remainder of the stem and the expansion chamber at the top of the thermometer exposed to room temperature.The practice of completely submerging the ther-mometer is not recommended.When thermometers are com-pletely submerged,corrections for each individual thermom-eter based on calibration under conditions of complete submergence must be determined and applied.If the thermom-eter is completely submerged in the bath during use,the pressure of the gas in the expansion chamber will be higher or lower than during standardization,and may cause high or low readings on the thermometer.6.2.2It is essential that liquid-in-glass thermometers becalibrated periodically using the technique given in Test Method E77(see Appendix X5).6.3Bath—A bath suitable for immersion of the viscometer so that the liquid reservoir or the top of the capillary,whichever is uppermost,is at least20mm below the upper surface of the bath liquid and with provisions for visibility of the viscometer and the thermometer.Firm supports for the viscometer shall be provided.The efficiency of the stirring and the balance between heat losses and heat input must be such that the temperature of the bath medium does not vary by more than60.03°C (60.05°F)over the length of the viscometer,or from viscom-eter to viscometer in the various bath positions.6.4Vacuum System—A vacuum system5capable of main-taining a vacuum to within60.5mm of the desired level up to and including40.0kPa300mm Hg.The essential system is shown schematically in Fig. 1.Glass tubing of 6.35-mm (1⁄4-in.)inside diameter should be used,and all glass joints should be airtight so that when the system is closed,no loss of vacuum is indicated by the open-end mercury manometer having1-mm graduations.A vacuum or aspirator pump is suitable for the vacuum source.6.5Timer—A stop watch or other timing device graduated in divisions of0.1s or less and accurate to within0.05%when tested over intervals of not less than15min.6.6Electrical Timing Devices may be used only on electri-cal circuits,the frequencies of which are controlled to an accuracy of0.05%or better.6.6.1Alternating currents,the frequencies of which are intermittently and not continuously controlled,as provided by some public power systems,can cause large errors,particularly over short timing intervals,when used to actuate electrical timing devices.7.Sample Preparations7.1Heat the sample with care to prevent local overheating until it has become sufficientlyfluid to pour,occasionally stirring the sample to aid heat transfer and to assure uniformity.7.2Transfer a minimum of20mL into a suitable container and heat to13565.5°C(275610°F),stirring occasionally to prevent local overheating and taking care to avoid the entrap-ment of air.N OTE4—If it is suspected that the sample may contain solid material, strain the melted sample into the container through a No.50(300-µm) sieve conforming to No.50Specification E11.8.Procedure8.1The specific details of operation vary somewhat for the various types of viscometers.See the detailed descriptions of viscometers in Appendix X1-Appendix X3for instructions for using the type of viscometer selected.In all cases,however, follow the general procedure described in8.1.1-8.1.9.8.1.1Maintain the bath at the test temperature within6 0.03°C(0.05°F).Apply the necessary corrections,if any,to all thermometer readings.4Supporting data are available from ASTM Headquarters,100Barr Harbor Drive,West Conshohocken,PA19428-2959.Request RR:D04-1003.5The vacuum control system marketed by Cannon Instrument Co.,P.O.Box16, State College,PA16801,has been found satisfactory for thispurpose.FIG.1Suggested Vacuum System for Vacuum CapillaryViscometers8.1.2Select a clean,dry viscometer that will give a flow time greater than 60s,and preheat to 13565.5°C (275610°F).8.1.3Charge the viscometer by pouring the prepared sample to within 62mm of fill line E (Fig.2,Fig.3,and Fig.4).8.1.4Place the charged viscometer in an oven or bath maintained at 13565.5°C (275610°F)for a period of 1062min,to allow large air bubbles to escape.8.1.5Remove the viscometer from the oven or bath and,within 5min,insert the viscometer in a holder,and position the viscometer vertically in the bath so that the upper most timing mark is at least 20mm below the surface of the bath liquid.8.1.6Establish a 40.060.07kPa (30060.5mm Hg)vacuum below atmospheric pressure in the vacuum system and connect the vacuum system to the viscometer with the toggle valve or stopcock closed in the line leading to the viscometer.8.1.7After the viscometer has been in the bath for 3065min,start the flow of asphalt in the viscometer by opening the toggle valve or stopcock in the line leading to the vacuum system.8.1.8Measure to within 0.1s the time required for the leading edge of the meniscus to pass between successive pairs of timing marks.Report the first flow time which exceeds 60s between a pair of timing marks,noting the identification of the pair of timing marks.8.1.9Upon completion of the test,clean the viscometer thoroughly by several rinsings with an appropriate solvent completely miscible with the sample,followed by a completelyvolatile solvent.Dry the tube by passing a slow stream of filtered dry air through the capillary for 2min,or until the last trace of solvent is removed.Alternatively,the viscometer may be cleaned in a glass-cleaning oven,at a temperature not to exceed 500°C (932°F),followed by rinses with distilled or deionized water,residue-free acetone,and filtered dry air.Periodically clean the instrument with a strong acid cleaning solution to remove organic deposits,rinse thoroughly with distilled water and residue-free acetone,and dry with filtered dry air.8.1.9.1Chromic acid cleaning solution may be prepared by adding,with the usual precautions,800mL of concentrated sulphuric acid to a solution of 92g of sodium dichromate in 458mL of water.The use of similar commercially available sulphuric acid cleaning solutions is acceptable.Nonchromium-containing,strongly oxidizing acid cleaning solutions 6may be substituted so as to avoid the disposal problems of chromium-containing solutions.8.1.9.2Use of alkaline glass cleaning solutions may result in a change of viscometer calibration,and is not recommended.9.Calculation9.1Select the calibration factor that corresponds to the pair of timing marks used for the determination,as prescribed in6A commercial source for a nonchromium-containing cleaning solution is Godax Laboratories Inc.,480Canal St.,New York,NY10013.All dimensions are in millimeters.FIG.2Cannon-Manning Vacuum CapillaryViscometerAll dimensions are in millimeters.FIG.3Asphalt Institute Vacuum CapillaryViscometer8.1.8.Calculate and report the viscosity to three significant figures using the following equation:Viscosity,Pa ·s 5~Kt !(1)where:K =selected calibration factor,Pa ·s/s,and t =flow time,s.N OTE 5—If the viscometer constant or calibration factor (K cgs )is known in cgs units (Poise/s)calculate the calibration factor (Ksi)in SI units (pascal·seconds/second)as follows:Ksi 5~Pa ·s /s !5K cgs /10or ~P /s !/10(2)10.Report10.1Always report the test temperature and vacuum with the viscosity test result.For example,viscosity at 60°C (140°F)and 300mm Hg vacuum,in Pa ·s.11.Precision and Bias11.1The following criteria (see Note 1)should be used for judging the acceptability of results (95%probability):11.1.1Repeatability —Duplicate results by the same opera-tor using the same viscometer should not be considered suspect unless they differ by more than 7%of their mean.11.1.2Reproducibility —The results submitted by each of two laboratories should not be considered suspect unless the two results differ by more than 10%of their mean.APPENDIXES(Nonmandatory Information)X1.CANNON-MANNING V ACUUM CAPILLARY VISCOMETER (CMVV)X1.1ScopeX1.1.1The Cannon-Manning vacuum capillary viscometer (CMVV)7,8is available in eleven sizes (Table X1.1)covering a range from 0.0036to 8000Pa ·s (0.036to 80000P).Sizes 10through 14are best suited to viscosity measurements of asphalt cements at 60°C (140°F).X1.2ApparatusX1.2.1Details of the design and construction of Cannon-Manning vacuum capillary viscometers are shown in Fig.2.The size numbers,approximate bulb factors,K ,and viscosity ranges for the series of Cannon-Manning vacuum capillary viscometers are given in Table X1.1.X1.2.2For all viscometer sizes,the volume of measuring bulb C is approximately three times that of bulb B .X1.2.3A convenient holder can be made by drilling two holes,22and 8mm in diameter,respectively,through a No.117Griffith,J.M.and Puzinauskas,P.,“Relation of Empirical Tests to Fundamental Viscosity of Asphalt Cement and the Relative Precision of Data Obtained by Various Tests Methods,”Symposium on Fundamental Viscosity of Bituminous Materials,ASTM STP 328,Am.Soc.Testing Mats.,ASTTA,1962,pp.20–44.8Manning,R. E.,“Comments on Vacuum Viscometers for Measuring the Viscosity of Asphalt Cements,”Symposium on Fundamental Viscosity of Bituminous Materials,ASTM STP No.328,Am.Soc.Testing Mats.,ASTTA,1962,pp.44–47.All dimensions are in millimeters.FIG.4Modified Koppers Vacuum Capillary ViscometerTABLE X1.1Standard Viscometer Sizes,Approximate Calibration Factors,K and Viscosity Ranges for Cannon-Manning VacuumCapillary ViscometersViscometer Size Number Approximate Calibration Factor,K ,A 40kPa (300mm Hg)Vacuum,Pa ·s/s (P/s/10)Viscosity Range,Pa ·s B Viscosity Range,P BBulb BBulb C 40.00020.000060.0036to 0.080.036to 0.850.00060.00020.012to 0.240.12to 2.460.0020.00060.036to 0.80.36to 870.0060.0020.12to 2.4 1.2to 2480.020.0060.36to 8 3.6to 8090.060.02 1.2to 2412to 240100.20.06 3.6to 8036to 800110.60.212to 240120to 240012 2.00.636to 0.8360to 813 6.0 2.0120to 24001200to 240001420.06.0360to 80003600to 80000A Exact calibration factors must be determined with viscosity standards.BThe viscosity ranges shown in this table correspond to a filling time of 60to 400s.Longer flow times (up to 1000s)may beused.rubber stopper.The center-to-center distance between holes should be 25mm.Slit through the rubber stopper between holes and also between the 8-mm hole and edge of the stopper.When placed in a 51-mm (2-in.)diameter hole in the bath cover,the stopper holds the viscometer in place.Such holders are commercially available.X2.ASPHALT INSTITUTE V ACUUM CAPILLARY VISCOMETER (AIVV)X2.1ScopeX2.1.1The Asphalt Institute vacuum capillary viscometer (AIVV)7,8is available in seven sizes (Table X2.1)from a range from 4.2to 580000Pa ·s (42to 5800000P).Sizes 50through 200are best suited to viscosity measurements of asphalt cements at 60°C (140°F).X2.2ApparatusX2.2.1Details of design and construction of the Asphalt Institute vacuum capillary viscometer are shown in Fig.3.The size numbers,approximate radii,approximate bulb factors,K ,and viscosity range for the series of Asphalt Institutevacuum capillary viscometers are given in Table X2.1.X2.2.2This viscometer has measuring bulbs,B ,C ,and D ,located on the viscometer arm,M ,which is a precision bore glass capillary.The measuring bulbs are 20-mm long capillary segments,separated by timing marks,F ,G ,H ,and I .X2.2.3A convenient holder can be made by drilling two holes,22and 8mm in diameter,respectively,through a No.11rubber stopper.The center-to-center distance between holes should be 25mm.Slit through the rubber stopper between the holes and also between the 8-mm hole and edge of the stopper.When placed in a 51-mm (2-in.)diameter hole in the bath cover,the stopper holds the viscometer in place.Such holders are commercially available.TABLE X2.1Standard Viscometer Sizes,Capillary Radii,Approximate Calibration Factors,K ,and Viscosity Ranges for Asphalt InstituteVacuum Capillary ViscometersViscometer Size Number Capillary Radius,mmApproximate Calibration Factor,K ,A 40kPa (300mm)Hg Vacuum,Pa ·s/s (P/s)/10Viscosity Range,Pa ·s B Viscosity Range,P BBulb B Bulb C Bulb D 250.1250.2.10.07 4.2to 8042to 800500.250.8.4.318to 320180to 32001000.50 3.2 1.6 1.060to 1280600to 12800200 1.012.8 6.4 4.0240to 52002400to 52000400 2.050.025.016.0960to 200009600to 200000400R C 2.050.025.016.0960to 1400009600to 1400000800R C4.0200.0100.064.03800to 58000038000to 5800000A Exact calibration factors must be determined with viscosity standards.BThe viscosity ranges shown in this table correspond to a filling time of 60to 400s.Longer flow times (up to 1000s)may be used.CSpecial design for roofing asphalts having additional marks at 5and 10mm above timing mark,F (see Fig.3).Thus,using these marks,the maximum viscosity range is increased from that using the bulb B calibrationfactor.X3.MODIFIED KOPPERS V ACUUM CAPILLARY VISCOMETER (MKVV)X3.1ScopeX3.1.1The Modified Koppers vacuum capillary viscometer (MKVV)9,10,11is available in five sizes (Table X3.1)covering a range from 4.2to 20000Pas (42to 2000000).Sizes 50through 200are best suited to viscosity measurements of asphalt cements at 60°C (140°F).X3.2ApparatusX3.2.1Details of design and construction of the Modified Koppers vacuum capillary viscometer are shown in Fig.4.Thesize numbers,approximate radii,approximate bulb factors,K ,and viscosity ranges for the series of Modified Koppers vacuum capillary viscometers are given in Table X3.1.X3.2.2This viscometer consists of a separate filling tube,A ,and precision-bore glass capillary vacuum tube,M .These two parts are joined by a borosilicate ground glass joint,N ,having a 24/40standard taper.The measuring bulbs B ,C ,and D ,on the glass capillary are 20-mm long capillary segments,separated by timing marks F ,G ,H ,and I .X3.2.3A viscometer holder can be made by drilling a 28-mm hole through the center of a No.11rubber stopper and slitting the stopper between the hole and the edge.When placed in a 51-mm (2-in.)diameter hole in the bath cover,it holds the viscometer in place.9Rhodes,E.O.,V olkmann,E.W.,and Barker,C.T.,“New Viscometer for Bitumens Has Extended Range,”Engineering News-Record ,V ol 115,No.21,1935,p.714.10Lewis,R.H.and Halstead,W.J.,“Determination of the Kinematic Viscosity of Petroleum Asphalts with a Capillary Tube Viscometer,”Public Roads ,V ol 21,No.7,September 1940,p.127.11Heithaus,J.J.,“Measurement of Asphalt Viscosity with a Vacuum Capillary Viscometer,”Papers on Road and Paving Materials and Symposium on Microvis-cometry,ASTM STP 309,1961,p.63.TABLE X3.1Standard Viscometer Sizes,Capillary Radii,Approximate Calibration Factors,K ,and Viscosity Ranges for Asphalt InstituteVacuum Capillary ViscometersViscometer SizeNumberCapillary Radius,mmApproximate Calibration Factor,K ,A 40kPa (300mm)Hg Vacuum,Pa ·s/s (P/s)/10Viscosity Range,Pa ·s BViscosity Range,Pa ·s BBulb B Bulb C Bulb D 250.1250.20.1.007 4.2to 8042to 800500.250.80.40.318to 320180to 32001000.50 3.2 1.6 1.060to 1280600to 12800200 1.012.8 6.4 4.0240to 52002400to 520004002.050.025.016.0960to 200009600to 200000A Exact calibration factors must be determined with viscosity standards.BThe viscosity ranges shown in this table correspond to a filling time of 60to 400s.Longer flow times (up to 100s)may beused.X4.CALIBRATION OF VISCOMETERSX4.1ScopeX4.1.1This appendix describes the materials and proce-dures used for calibrating or checking the calibration of viscometers used in this method.X4.2Reference MaterialsX4.2.1Viscosity Standards having approximate viscosities are given in Table X4.1.X4.3CalibrationX4.3.1Calibration of Vacuum Viscometer by Means of Viscosity Standards —Calibrate the vacuum viscometer as fol-lows:X4.3.1.1Select from Table X4.1a viscosity standard having a minimum flow time of 60s at the calibration temperature.X4.3.1.2Charge a clean,dry viscometer by pouring the sample to within 62mm of fill line E (See Fig.2,Fig.3,and Fig.4).X4.3.1.3Place the charged viscometer in the viscometer bath,maintained at the calibration temperature 60.01°C (60.02°F).X4.3.1.4Establish a 30060.5-mm (40.06.07kPa)Hg vacuum in the vacuum system and connect the vacuum system to the viscometer with the toggle valve or stopcock closed in the line leading to the viscometer.X4.3.1.5After the viscometer has been in the bath for 3065min,start the flow of standard in the viscometer by opening the stopcock or toggle valve in the line leading to the vacuum system.X4.3.1.6Measure to within 0.1s,the time required for the leading edge of the meniscus to pass between timing marks Fand G .Using a second timer,also measure to within 0.1s,the time required for the leading edge of the meniscus to pass between timing marks G and H .If the instrument contains additional timing marks,similarly determine the flow time for each successive bulb.X4.3.1.7Calculate the calibration factor,K ,for each bulb as follows:K 5h /t(X4.1)where:K =viscometer bulb calibration factor,(Pa ·s/s)40.0kPa(300mm),h =viscosity of viscosity standard at calibration tempera-ture,P,and t =flow time,s.X4.3.1.8Repeat the calibration procedure using the same viscosity standard or another viscosity standard.Record the average calibration constant,K ,for each bulb.N OTE X4.1—The duplicate determinations of calibration constant,K ,for each bulb must agree with 2%of their mean (Note X4.2).N OTE X4.2—The bulb constants are independent of temperature.X4.3.2Calibration of Vacuum Viscometer by Means of Standard Vacuum Viscometer —Calibrate the vacuum viscom-eter as follows:X4.3.2.1Select any petroleum asphalt having a flow time of at least 60s.Select also a standard viscometer of known bulb constants.X4.3.2.2Mount the standard viscometer together with the viscometer to be calibrated in the same bath at 60°C (140°F)and determine the flow times of the asphalt by the procedure described in 8.1.X4.3.2.3Calculate the constant,K ,for each bulb as follows:K 15~t 23K 2!/t 1(X4.2)where:K 1=constant of viscometer bulb being calibrated,t 1=flow time of viscometer bulb being calibrated,K 2=bulb constant of standard viscometer,andt 2=flow time of corresponding bulb in standard viscom-eter.X5.ICE POINT DETERMINATION AND RECALIBRATION OF KINEMATIC VISCOSITY THERMOMETERSX5.1To achieve an accuracy of 60.02°C for calibrated kinematic viscosity thermometers,it is required that a check at the ice point be made and the corrections altered for the change seen in the ice point.It is recommended that the interval of checking be every six months;for a new thermometer,check monthly for the first six months.X5.2A detailed procedure for the measurement of the ice point and recalibration of thermometers is described in 6.5ofTest Method E 77.The suggestions in the following sections of this appendix are given specifically for the mercury-in-glass kinematic viscosity thermometers described in Table X5.1,and may not apply to other thermometers.X5.2.1The ice point reading of kinematic viscosity ther-mometers shall be taken within 60min after being at the test temperature for not less than 3min.The ice point reading shall be expressed to the nearest 0.01°C or 0.02°F.TABLE X4.1Viscosity StandardsViscosity Approximate Viscosity,Pa ·s Approximate Viscosity,PAt 20°C (68°F)At 40°C (104°F)At 20°C (68°F)At 40°C (104°F)N30000A 150211500210N190000A 80014080001400S30000A...21 (210)AAvailable in 1-pt containers.Purchase orders should be addressed to CannonInstrument Co.,P .O.Box 16,State College,PA 16801.Shipment will be made as specified or by bestmeans.X5.2.2Select clear pieces of ice,preferably made from distilled or pure water.Discard any cloudy or unsound por-tions.Rinse the ice with distilled water and shave or crush into small pieces,avoiding direct contact with the hands or any chemically unclean objects.Fill the Dewar vessel with the crushed ice and add sufficient distilled and preferably pre-cooled water to form a slush,but not enough to float the ice.As the ice melts,drain off some of the water and add more crushed ice.Insert the thermometer packing the ice gently about the stem,to a depth approximately one scale division below the 0°C (32°F)graduation.It may be necessary to repack the ice around the thermometer because of melting.X5.2.3After at least 3min have elapsed,tap the stem gently,and observe the reading.Successive readings taken at least 1min apart should agree within one tenth of a division.X5.2.4Record the ice point reading and compare it with the previous reading.If the reading is found to be higher or lower than the reading corresponding to a previous calibration,readings at all other temperatures will be correspondingly increased or decreased.X5.2.5The ice point procedure given in X5.1-X5.2.4is used for the recalibration of kinematic viscosity thermometers,and a complete new calibration of the thermometer is not necessary in order to meet the accuracy ascribed to this design thermometer.X5.3It is recommended that these kinematic viscosity thermometers be stored vertically when not in use so as to avoid the separation of the mercury column.X5.4It is recommended that these kinematic viscosity thermometers be read to the nearest 1⁄5of a division using appropriate magnification.Since these thermometers are typi-cally in a kinematic viscosity bath (which has vision through the front),the thermometer is read by lowering the thermom-eter such that the top of the mercury column is 5to 15mm below the surface of the bath liquid.Be careful to ensure that the expansion chamber at the top of the thermometer is above the lid of the constant temperature bath.If the expansion chamber is at elevated or lowered temperatures from ambient temperatures,a significant error can occur.This error can be as much as one or two thermometer divisions.A reading glass such as used for reading books may be useful to ensure reading the scale to 1⁄5of a division.ASTM International takes no position respecting the validity of any patent rights asserted in connection with any item mentioned in this ers of this standard are expressly advised that determination of the validity of any such patent rights,and the risk of infringement of such rights,are entirely their own responsibility.This standard is subject to revision at any time by the responsible technical committee and must be reviewed every five years and if not revised,either reapproved or withdrawn.Your comments are invited either for revision of this standard or for additional standards and should be addressed to ASTM International Headquarters.Your comments will receive careful consideration at a meeting of the responsible technical committee,which you may attend.If you feel that your comments have not received a fair hearing you should make your views known to the ASTM Committee on Standards,at the address shown below.This standard is copyrighted by ASTM International,100Barr Harbor Drive,PO Box C700,West Conshohocken,PA 19428-2959,United States.Individual reprints (single or multiple copies)of this standard may be obtained by contacting ASTM at the above address or at 610-832-9585(phone),610-832-9555(fax),or service@ (e-mail);or through the ASTM website ().TABLE X5.1Kinematic Viscosity Test Thermometers ATest Temperature Scale Error BThermometer Number °C°F ASTM C IP D 20and 21.168and 7044C,F 29C,F 257745C,F 30C,F 3086118C,F ...37.810028F 31C,F 40120C ...5012246C,F 66C,F 54.413029F 34C,F 6014047C,F 35C,F 82.218048F 90C,F 93.3200...36C,F 98.9and 100210and 21230F 32C,F100121C 135275110C,FAThe smallest graduation of the Celsius thermometers is 0.05°C and for the Fahrenheit thermometers is 0.1°F.BScale error for the Celsius thermometers is not to exceed 60.1°C for the Fahrenheit thermometers it is 60.2°F (except for ASTM 110F which is 60.3°F).These scale errors are required to apply only at the given test temperature.CComplete construction detail is given in Specifications E 1.DComplete construction detail is given in Part I of IP Standards for Petroleum and itsProducts.。
外文翻译1

Computer Vision Application in Automatic MeterCalibrationLeo, S.L. Pang Technical Services Department CLP Power Hong Kong LimitedHong Kongslpang@Dr. W.L. Chan Department of Electrical Engineering The Hong Kong Polytechnic UniversityHong Kongeewlchan@.hkAbstract—CLP Power Hong Kong Limited (CLP Power) is a leading electricity utility in Hong Kong. Instrument calibration is an important supporting service for the company. Under traditional practice, manual calibration is being performed. As one of the new performance improvement initiatives, computer-vision application in meter calibration was introduced in 2004. This paper summarised the application of an intelligent automatic calibration system for instruments without computer interface output. This system is designed to communicate with the high precision calibrator using General Purpose Interface Bus (GPIB) interface to give out pre-programmed test signals and connect to a camera through the PXI-1490 interface card to capture meter readings in image format and then convert to digital format for test data verification in computer automatically. Now, the company is enjoying the benefits from the system in terms of eliminated human calibration errors and reduced operating costs.Keywords- computer vision, automatic, meter, calibrationI.I NTRODUCTIONCLP Power, being the largest power company in Hong Kong, is supplying electricity power to over two million customers in its supply areas. As one of the success factors, CLP Power’s operation and maintenance teams need to be equipped with different kinds of portable instruments enabling them to be the most efficient teams handling daily works for the power system. As such, portable instrument periodic calibration is regarded as part of the important technical support service for the company. To suit the business needs, there are various types of instruments being used and more than 3,000 units are handheld with either digital or analogue displays. The Technical Services Department’s electrical standard laboratory, as the company service provider, is responsible for providing the calibration service in order to ensure the accuracy and functionality of these instruments. Prior to establishing the proposed system, the tests were performed manually by controlling the calibrator to output a series of test signals to the instruments under calibration, reading out and logging the measured values, comparing with the allowable limits and transferring the handwritten raw data to computer. This manual process required long calibration time (about one hour per unit on average) and had to be tested by a competent operator. Moreover, the process was also susceptible to human errors in which the department was most concerned about. In view of assuring work quality and reducing cost, CLP Power therefore initiated an innovative idea to tailor-make a new automated calibration system by computer vision technology. Though computer-based automatic calibration system is not new [1], digital interface is required in order to collect instrument readings by the computer. As one of the computer vision technology advantages, the requirement of a separated digital interface is no longer needed and calibration system will provide a very low cost solution for low cost instruments without computer interface. Computer vision is a maturing technology and it has been used in many areas [2]. In this paper, an automatic instrument calibration system using computer vision is reported.II.MANAGING INSTRUMENT IN CLP POWER CLP Power as a world class electricity utility, the supply reliability performance is over 99.99%. Instrumentation calibration is essential to supporting this excellent performance. Currently, there are about 6,500 units of portable instruments divided into 28 classes that are being used in daily activities. All these instruments require periodic calibration according to the company’s quality management system requirements. In this connection, the department has to provide about 3,500 number of instrument calibration services yearly including calibration after repair and new instrument acceptance test.Such a large calibration volume consumes lots of manpower. To ensure high quality calibration services are delivered to meet the service pledges, different effective strategies have been explored, including:i.Obtaining optimal calibration intervals for differentclasses of instruments by experience and statisticalmethodii.Developing virtual instruments to reduce number of traditional instruments to be used hence minimizingcalibration efforts; andiii.Automating calibration process [4].It was revealed from the analysis that 7 major classes of instruments, digital multi-meter, analogue multi-meters,clip-on meter, insulation resistance meter, power factor & phase angle meter, loop impedance & earth tester and residual current device represent more than 40% of the 28 instrument classes with a total quantity of about 2,800 units. Should all these types of instrument calibration be automated, about 30% of manpower saving in calibration can be obtained yearly. More importantly, most of the possible human errors can be eliminated compared with the existing manual calibration practice.III.S YSTEM O PERATION P RINCIPLEThe automated test station implemented by CLP Power is based on machine vision technology. The system consists of an industrial computer with PXI (PCI eXtensions for Instrumentation) interface and a PXI-1409 which is a high performance machine vision hardware used for capturing the images of the portable instruments under test. The control software used to process the images was developed based on the vision development module which is supplied by the hardware manufacturer.The hardware connection is shown in Figure 1 and the automated test station goes through the following steps:1)By using the GPIB interface of a traditional calibrator, the PXI system automates the calibrator to sequentially output the specified test signals as programmed according to the existing test forms.2)The PXI-1409 image card acquires the images of instrument reading displays. By identifying a reference edge and regions of interest (ROI), the test system converts the numerical or pointer deflection values as shown in the digital and analogue meter displays to digital formats. The data is then logged to a file.3)Steps 1 and 2 repeat until all test points are tested.4)Software programmatically compares the results with the allowable limits, and then generates “pass” or “fail” test results accordingly. This pass/fail data are also logged to file.Figure 1 - Hardware Connection DiagramIV.M ECHANICAL A RRANGEMENT OF THEC AMERAA.Mounting AssemblyTo allow the system capturing correct image signal from the meter under test, the image positions have to be pre-defined. First of all, the unit under test has to be fixed to a relative position under the camera without any rotational and lateral shifts. A tailor-made mounting assembly for serving the purpose is therefore treated as the pre-requisite requirement for capturing steady image.B.Reference Point for ROIHaving the mounting assembly fixed, next steps are to define the reading image reference point and the locations of the meter characters or numerical readings to be displayed on the meter screen, so called region of interest. Different types of meters will have different ROI. Locating a reference framework is vital in the system as the ROI will be relative to the framework. The system is using software to locate a reference coordinates as the reference points and the results are shown in Figure 2 below.C.Lighting ControlAs the lighting of the environment will affect the grey level value of the digitized image, it is important to have a constant lighting environment so as to make the recognition process to be stable. Equipment background light if built-in may require to be turned on during calibration.Figure 2 – Reference Point for ROI of Different DMsV.D IGITAL METERBefore performing meter calibration of a digital meter (DM), all ROI have to be set so as to allow the system to know what to be recognized from the display of a DM as shown in Figure 3. In CLP Power Electrical Standard Laboratory, the ROI of three DMs were defined. The different regions in the display will display different readings like Voltage, Current, AC, DC, etc.For a reading, say 0.2 mVdc, the regions of ‘0.2,DC’,‘V’,’m’ will be displayed. The system will then check forC.A. 5003 BM222Fluke 189 Fluke 87the grey level of displayed ROI. Since the blank region will have much higher grey level values than those regions with characters, images were distinguished and read by the system from this great grey level difference. For the digits, the regions of the numerical digits were mapped with the internal 7-segment library to produce the closest digit with the one shown in the display.Figure 3 – Defined ROI a DMVI.ANALOGUE METERUnlike DM, analogue meter (AM) is, to make use of a pointer deflection to indicate measured values like CA5003, the ROI is the two red lines from zero reference to the expected full scale deflection as shown in Figure 4. They are in fact the defined ROI for this type of meter different from DM. When signal is fed into the meter, the meter pointer will deflect to the corresponding position within the two red lines. The readings of the meter will then be calculated from the portion ratio of the pointer inside the two red lines multiplied by the total range.Figure 4 – Defined ROI of a AMVII.S OFTWARE F EATURESThe software of the automatic calibration system is running under Windows XP Professional operating system platform and it is written in image capturing application program environment. The features of the software are listed as follows:•Verification of authorized users•Interface with barcode reader for scanning operator ID and meter ID•Mapping operator and meter information from database•Interface with calibrators to output programmable signals•Selection of correct calibrators•Calibration of the defined types meters•Selection of one or two meters to be calibrated at the same time•Selection of calibration modes, single point or continuous point calibration•Test results logging and verifying•Test certificate and report printingVIII.SMART FEATURES INCORPORATED To make the system more successful, suitable smart features are recommended to be built-in. First consideration is to remind the operator whenever a wrong test item is selected during the calibration process. That is, when the operator inadvertently selected a wrong test item the system will not continue the calibration and will prompt the operator to select the correct one before giving out calibration signal to protect the test unit. Secondly, some sorts of automatic image searching feature is to be built-in to allow operator to take out the test unit for inspection any time during calibration. With this smart feature the system is able to recall the remembered reference point and ROI even if the test unit is taken out and then put back after some time to continue the calibration.IX.REPORTING SYSTEMTo allow operators to view the test results as shown in Figure 5 before producing test report, the reporting system is designed to let operators highlight any particular row of result for re-testing if encountering any questionable results . Once all the test results were verified, the system will allow operators to choose ‘Print Report’ or ‘Print Certificate’ as required. After that, the ‘Open spreadsheet’ program will be invoked to show the test report or certificate. Users can then modify the format, and add information to the file before actually printing it out. Should an electronic test report be required, the test report generated can be saved to the report database directly without scanning efforts.Figure 5 - Test Report Generating During CalibrationX.S UGGESTION FOR SOLVING THE FIXEDMOUNTING PROBLEMFor analogue meter, it is possible to solve the fixed mounting requirement by using computer vision algorithm [4]. During initialization, the image of a meter with zero reading is retrieved. Another image of the same meter captured by the same camera at the same location under the same illumination will be grabbed. As shown in Figure 6, a "maximum" operation is carried out between the two images, resulting in an image of the meter without the pointer or the bar. This image is treated as a reference and is stored inside the memory of the computer. During normal operation, a real-time image of the meter is grabbed and an "image subtraction" algorithm is then executed to compare this real-time image and the reference image stored in the computer memory. The operation is shown in Figure 7. Hence, a pointer is then highlighted as shown in Figure 8. "Hough Transform" is then carried out to locate the most probable position of the pointer and those noisy points can be eliminated. A "robust line fit" algorithm is employed to identify the optimal position and orientation of the pointer. Once the orientation is known, the real-time reading can be obtained by referring to the table within the database kept in the memory of the computer. The time-stamped value is then stored for trend logging and statistical analysis. The flowchart of the method is shown in Figure 9.Figure 6 – An Illustration of the "Maximum" OperationFor Hough Transform, a straight line can always be written as:x cos θ + y sin θ = rwhere θ is the angle that a normal to line makes with the x-axis and r is the length of this normal. Any point, (xi, yi) on this line must satisfy the straight line equation while the equation can be interpreted as a sinusoidal curve in the (r, θ) space. If a number of points are collinear in the (x, y) space, their Hough transform curves must intersect in the same point in the (r, θ) space. Each point (xi, yi) will contribute a count to the cells given by the equation and the cells with high counts will give the desired lines. The value θ gives an approximate position of the meter pointer. To refine the meter reading, the optimal line that represents the point can be obtained by means of robust fit of the useful pixels. The line fitting is based on minimization of the squared deviation of all useful pixels from the optimal line which has the equation "y = a + bx".()()x b-a-y x=;1xb-y=axb-a-yiiiiiii∑∑∑∑MinFigure 7 – An Illustration of the Subtraction OperatorFigure 8 – The Extracted Meter PointerFigure 9 – The Flowchart of the MethodXI.T ANGIBLE B ENEFITSWith the automatic calibration system as shown in Figure 10 in place, the test time has been decreased significantly from approximately 1 hour to less than 10 minutes per unit, i.e. 6 times of speed improvement for a typical DM out of the four developed meter models as shown in Figure 11. Apart from time saving, instrument calibration by competent operator becomes less demanding as the process has been fully automated. More importantly, possible human errors are eliminated. Since the complexity of the task has been simplified, training for operator on manual calibration can be much simpler.Figure 10 – Two DM Being Calibrated By The SystemFigure 11 – Four Types of Meters Developed Automatic Calibration Program By Computer VisionXII.C ONCLUSIONWith the help of advanced computer vision technology, automating calibration and testing for instruments without computer interface is technically feasible and cost effective for any utility which needs to manage large number of same model instruments with digital or analogue display. Such system not only saves manpower but also improves the quality of work. Apart from computer technology, other applications such as automatic calibration by infra-red signal and virtual instrument development are also worth considering in terms of work quality improvement and cost saving. This newly developed computer vision system could also benefit other industries.References:[1]S.C. Wang, C.L. Chen, “Computer-aided transducer calibration systemfor a practical power system”, IEE Proc. – Sci. Meas. Technol., Vol.142, No.6, Nov. 1995, pp. 459-462[2] A.T.P. So, W.L. Chan, K.C. Li, "A Computer Vision Based FireDetection, Lighting and Air-conditioning Control System", Proceedings of CIBSE National Conference, Computers in Construction Industry, Manchester, May 1993, pp. 345-355[3]W.L. Chan, Leo S.L. Pang, C.F. Ma, "Computer Vision Applications inPower Substations", Proceedings of the 2004 IEEE International Conference on Electric Utility Deregulation, Restructuring and Power Technologies, DRPT 2004, Hong Kong, April, 2004, pp. 383-388[4]Leo S.L. Pang, " The First Successful Application of Computer VisionTechnology in Automating Multi-meter Calibration” CLP Power TSD Technical Bulletin Issue No. 6, Aug 2004.。
- 1、下载文档前请自行甄别文档内容的完整性,平台不提供额外的编辑、内容补充、找答案等附加服务。
- 2、"仅部分预览"的文档,不可在线预览部分如存在完整性等问题,可反馈申请退款(可完整预览的文档不适用该条件!)。
- 3、如文档侵犯您的权益,请联系客服反馈,我们会尽快为您处理(人工客服工作时间:9:00-18:30)。
CALIBRATION OF CMS CALORIMETERS WITH LHC PROTON BEAMDEFLECTED BY CRYSTALYu.Chesnokov, V.Biryukov, V.Kryshkin, IHEP, Protvino, 142281, RussiaAbstractCalibration of the forward CMS hadron calorimeters in situ by the LHC beam is proposed. Simulations show that bent crystal channeling technique is feasible at the LHC, and report the experience of IHEP Protvino in bending 70 GeV protons by 9 degrees (150 mrad) during 10 years in 1994-2004 experiments. Practical realization of calibration scheme based on simulations and previous experience is proposed.INTRODUCTIONThe goal of the absolute energy scale (about 1%) required for the new generation of the collider experiments is a very tough task. Calibration of hadron calorimeters with fixed target beam is practically impossible:- in case the calorimeters are supposed to be placed in a magnetic field any calibration outside of magnetic field is a rough approximation because the scintillator and a sandwich calorimeter response depend on magnetic field value and its orientation;- transportation of calibration coefficients obtained with external beams is not an easy task (requires some corrections connected, for example, with influence of magnetic field on calorimeter response).Absolute calibration in situ, utilizing some physical processes, is time consuming procedure providing only limited precision (particularly for forward direction due to large number of mini-bias events):- "in the forward direction Z +jet utility becomes more questionable" [1];- same arguments are applicable to "γ+jet";- for the process W→jet in t -⎯t events there is no estimation for forward calorimeters, the pile up can be a serious problem.Besides a single hadron response of the forward calorimeters is important also if B physics is planned to study. There is no reliable way to do it in situ.An ideal solution would be to irradiate the assembled calorimeters by high energy beam. There is such beam in hadron collides – circulating proton beam. And the method to direct the beam into the detectors is well known.BEAM BENDING METHODTo irradiate CMS detectors, one would need to bend the beam circulating in the LHC by a huge angle, order of 1-10 degrees (17-170 mrad) . Beam intensity as low as 1-1000 p/s would be sufficient for calibration purposes. Such a bending is possible indeed, but only by extreme, ~1000-Tesla-strong fields of bent crystal. The technique of particle beam channeling by bent crystals is well established at accelerators [2]. Broad experience is obtained with bent channeling crystals at IHEP, CERN SPS, Tevatron, and RHIC over recent decades [2-15]. For instance, bent crystals are largely used for extraction of 70-GeV protons at IHEP (Protvino) [11-15] with efficiency reaching 85% at intensity of 1012 particle per second, steered by silicon crystal of just 2 mm in length [12]. Much of the IHEP physics program relies on crystal channeled beams regularly used since 1989. Following the successful experiments on crystal channeling in accelerator rings, there has been a strong interest to apply channeling technique in a TeV-range collider for beam extraction or collimation [2-8,16-18].IHEP EXPERIMENT ON CRYSTALBENDING OF 70 GeV PROTONS BY150 MRADThe possibility of beam bending by a channeling crystal through very large angles, order of 100 mrad, was studied at Protvino. In 1994-2004 IHEP has operated a channeling crystal 100 mm long to bend 70 GeV beam a huge angle of 150 mrad (9 degrees!) [19,20]. This was done with the purpose to organize over a short base a non-traditional beam line. A 100 mm long Si (110) crystal deflected 106 proton/s beyond the 2-meter iron-concrete shield over 20 m base, out of about 1010 proton/s hitting the crystal. The crystal efficiency was in agreement with calculation. The orientation-independent component of the signal (background particles) did not exceed 3% of the channeled beam. The scheme of 150-mrad crystal beam line operated at IHEP at 106 proton/s in 1994-2004 is shown in Figure 1. This crystal beam line was used mostly for our studies of channeling. It consumed practically no power and allowed one to work in parallel with other beam lines without affecting other physical set-ups operation.Besides this 150-mrad bent crystal used in 1994-2004, another example in IHEP experience was an 85-mrad bent crystal used for extraction in 1989-1999 over 10 years until a new crystal replaced it [2].SIMULATIONS FOR THE LHC BEAMBENDING BY 1-20 DEGREESIn order to find out whether one can extrapolate the 70 GeV experience onto the LHC case of much higher energy range, we performed Monte Carlo simulations applying the code [21-23] used in many other channeling experiments [6-15]. Details of the theoretical calculations can be found, e.g., in book [2]. Our preliminary study assumed a crystal of 50 cm size, which is a reasonable figure available on the market in Russia and Europe. Earlier, IHEP has used up to 15 cm long Si crystals for channeling.An example of the calculation of efficient transmission of LHC beam with Silicon crystal at the energies of 450 GeV (injection level in the LHC) and 1000 GeV is shown in Figure 2. Respectively, bending angles up to about 7 and 11 degrees can be realized with Si crystal at these energies.Figure 2 Efficiency of the LHC proton beam bending with a single Si crystal 500 mm long as a function ofthe bending angle (degrees).We have run computations for Silicon and Germanium crystals of 50 cm size and the LHC energy range from injection, 450 GeV, through the top energy, 7 TeV. Some preliminary results are shown on Figure 3 for the bending angle achievable with a single Si crystal of 50 cm length as a function of the LHC beam energy.Figure 3 Bending angle achievable with a single Si crystal of 50 cm length as a function of the LHC beamenergy.Thus simulations show: if the beam energy is limited to the injection energy (450 GeV) that is sufficient for reliable measurement of the energy scale the size of the crystal can be a modest one.All towers of the hadron calorimeters (HE and HF) are irradiated by a radioactive source and relative coefficients are known for all towers therefore in principle it is sufficient to define an energy scale only for a single tower. But due to harsh radiation environment in forward direction the active calorimeter elements can be damaged. Therefore control of the tower performance is required in all available psevdorapidity range (no scanning in ϕ is requiredbecause of the axial symmetry). The solution of the task is depicted in fig. 4. Not all channeledFig. 4. Angular distribution of the bended particles. particles are bent to a maximum angle. Positive feature of large crystal bending for calibration is wide angular region of the deflected particles: there are present not only fully deflected particles, but also some particles dechanneled in a crystal bulk and thus deflected at smaller angle.LAYOUT OF A CALIBRATIONSCHEMEExample of the realization of the proposed method is illustrated in fig. 5 where the central part of CMS is shown. A crystal can be placed inside of the electromagnetic calorimeter EE. Then the maximum particle bending angle will be about 120 and the proton beam will strike HE tower far enough from the inner edge to avoid leakage into HF. On the other hand the combined performance of HE and HF can not be studied with extracted beams and the use of the channeled crystal inserted in beam is the only way to measure this characteristic.The place inside of the EE is shown in fig. 6. There is a bellows to join two parts of the beam pipe and no special efforts are needed to insert a crystal. The maximal available Si crystal length is about 350 mm. According to the fig.6 after removing the part of the pipe with the bells there is a free space 410 mm length.The bent crystal can be fixed in a Π shape aluminum profile presented in fig.7 and positioned in the beam pipe (fig. 8). There exist several possible options to direct the particles at the crystal which depend on the dynamics of the beam. For example if the injected 450 GeV beam has appreciable halo the crystal can be placed at such distance from the axis that the beam halo will overlap the crystal. This period can be used for calorimeter calibration. After the proton accumulation the beam halo is decreased and the crystal will be outside of the beam. The other way is to use existing magnetic elements to steer the beam into the crystal. No moving parts (goniometer and so on) are needed due to application of special crystal with triangular shape of entry face (fig. 9). Such crystal type has distributed acceptance and its initial alignment with an accuracy of about few milliradian is enough for channeling achievement. At fig. 10 the diminish-scale model of necessary crystal device is presented. The full scale device can be constructed and tested in 2006 test beam time with HE and HF prototypes.HE EEFig. 5. Layout of the central part of CMS with crystal placed inside electromagnetic calorimeter EE.Figure 9. Scheme of crystal with skew entry face. The tangents to crystalline planes at crystal entry are non parallel in the limits of few milliradian witch excluded the necessary of crystal rotation for achievement ofchanneling mode.Figure 10. The diminish scale model of bent crystal with skew entry. Model parameters are: 150 mrad bent, 100 mm length and 12 mm width.The simple method can be used for absolute calibration in real environment. Unique characteristic (such as the combine performance of HE and HF) can be thoroughly studied. The calibration can be done regularly (at least each day). So it can be used for the control also (variation of scale and resolution with time). No radioactive sours can give this information (if some channel failed the resulting degradation of the energy resolution can not be calculated).For HE calibration the maximum required angle is about 120 that is close for the present achievements. As for HF the bending angle is well within the currently used range and it will not require additional study.REFERENCES[1]J. Freeman and W. Wu. In SituCalibration of the CMS HCALDetector. FERMILAB-TM-1984.[2] V.M. Biryukov, Yu.A. Chesnokov and V.I.Kotov, "Crystal Channeling and its Application atHigh Energy Accelerators" (Springer, Berlin,1997)[3]H. Akbari et al. Phys. Lett. B 313 (1993) 491[4]X. Altuna et al., Phys. Lett. B357, 671 (1995).[5] A. Baurichter, et al. Nucl.Instrum.Meth.B 164-165:(2000) 27-43[6]R.A. Carrigan et al., Nucl. Instrum. Meth. B 119(1996) 231[7]R.A.Carrigan, Jr., et al. Phys. Rev. ST AB 1,022801 (1998)[8]R.A. Carrigan et al. Phys. Rev. ST Accel. Beams5(2002) 043501.[9]R.P. Fliller III, A. Drees, D. Gassner, L.Hammons, G. McIntyre, S. Peggs, D. Trbojevic,V. Biryukov, Y. Chesnokov, V. Terekhov, AIPConf. Proc. 693 (2003) 192-195[10]R.P. Fliller III, A. Drees, D. Gassner, L.Hammons, G. McIntyre, S. Peggs, D. Trbojevic,V. Biryukov, Y. Chesnokov, V. Terekhov, Nucl.Instr. and Meth. B, in press[11]A.G. Afonin et al. Phys. Lett. B435 (1998) 240-244.[12]A.G. Afonin et al. Phys. Rev. Lett. 87, 094802(2001)[13]V.M. Biryukov et al. Rev. Sci. Instrum. 73 (2002)3170-3173[14]A.G. Afonin et al. JETP Lett.74 (2001) 55-58 [15]A.G. Afonin et al. Instrum. Exp. Tech.45(4)(2002) 476[16]V. Biryukov. Phys. Rev. Lett. 74 (1995) 2471.[17]V.M. Biryukov, V.N. Chepegin, Yu.A.Chesnokov, V. Guidi, W. Scandale, Nucl. Instr.and Meth. B, in press[18]V.M. Biryukov, A.I. Drozhdin, N.V. Mokhov.PAC 1999 Proc. (New York), p.1234.FERMILAB-Conf-99-072 (1999), "On PossibleUse of Bent Crystal to Improve Tevatron BeamScraping".[19]V.M. Biryukov et al. IHEP Preprint 95-14 (1995).[20]V.M. Biryukov et al. PAC Proceedings (Dallas,1995).[21]V.Biryukov. CERN SL Note 93-74 AP (1993)."Crystal Channeling Simulation. CATCH 1.4User's Guide".[22]V. Biryukov. Phys. Rev. E51 (1995) 3522.[23]V. Biryukov. Phys. Rev. Lett. 74 (1995) 2471.。