Inflation Dynamics and Monetary Policy_yellen20150924
Part1MonetaryPolicy,Inflation,andtheBusinessCycle
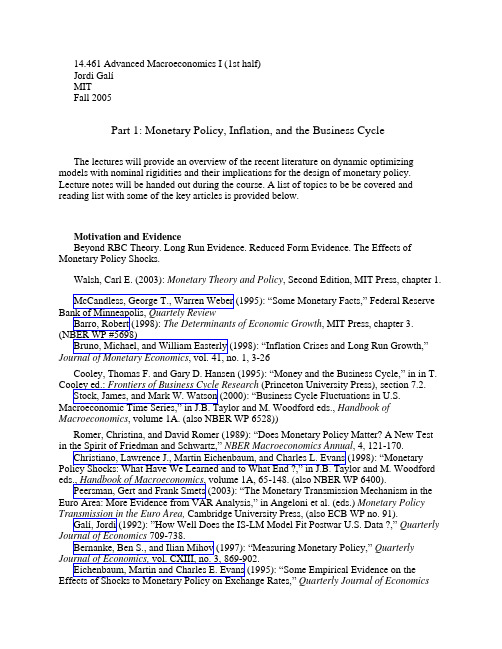
14.461Advanced Macroeconomics I(1st half)Jordi GalíMITFall2005Part1:Monetary Policy,Inflation,and the Business Cycle The lectures will provide an overview of the recent literature on dynamic optimizing models with nominal rigidities and their implications for the design of monetary policy. Lecture notes will be handed out during the course.A list of topics to be be covered and reading list with some of the key articles is provided below.Motivation and EvidenceBeyond RBC Theory.Long Run Evidence.Reduced Form Evidence.The Effects of Monetary Policy Shocks.Walsh,Carl E.(2003):Monetary Theory and Policy,Second Edition,MIT Press,chapter1.McCandless,George T.,Warren Weber(1995):“Some Monetary Facts,”Federal Reserve Bank of Minneapolis,Quartely ReviewBarro,Robert(1998):The Determinants of Economic Growth,MIT Press,chapter3. (NBER WP#5698)Bruno,Michael,and William Easterly(1998):“Inflation Crises and Long Run Growth,”Journal of Monetary Economics,vol.41,no.1,3-26Cooley,Thomas F.and Gary D.Hansen(1995):“Money and the Business Cycle,”in in T. Cooley ed.:Frontiers of Business Cycle Research(Princeton University Press),section7.2.Stock,James,and Mark W.Watson(2000):“Business Cycle Fluctuations in U.S. Macroeconomic Time Series,”in J.B.Taylor and M.Woodford eds.,Handbook of Macroeconomics,volume1A.(also NBER WP6528))Romer,Christina,and David Romer(1989):“Does Monetary Policy Matter?A New Test in the Spirit of Friedman and Schwartz,”NBER Macroeconomics Annual,4,121-170.Christiano,Lawrence J.,Martin Eichenbaum,and Charles L.Evans(1998):“Monetary Policy Shocks:What Have We Learned and to What End?,”in J.B.Taylor and M.Woodford eds.,Handbook of Macroeconomics,volume1A,65-148.(also NBER WP6400).Peersman,Gert and Frank Smets(2003):“The Monetary Transmission Mechanism in the Euro Area:More Evidence from VAR Analysis,”in Angeloni et al.(eds.)Monetary Policy Transmission in the Euro Area,Cambridge University Press,(also ECB WP no.91).Galí,Jordi(1992):”How Well Does the IS-LM Model Fit Postwar U.S.Data?,”Quarterly Journal of Economics709-738.Bernanke,Ben S.,and Ilian Mihov(1997):“Measuring Monetary Policy,”Quarterly Journal of Economics,vol.CXIII,no.3,869-902.Eichenbaum,Martin and Charles E.Evans(1995):“Some Empirical Evidence on the Effects of Shocks to Monetary Policy on Exchange Rates,”Quarterly Journal of Economics110,no.4,975-1010.Bils,Mark and Peter J.Klenow(2004):“Some Evidence on the Importance of Sticky Prices,”Journal of Political Economy,vol112(5),947-985.Dhyne,Emmanuel et al.(2005):“Price Setting in the Euro Area:Some Stylised Facts from Individual Consumer Price Data,”mimeo.Alvarez,Luis et al.(2005):“Sticky Prices in the Euro Area:Evidence from Micro-Data,”mimeo.A Simple Framework for Monetary Policy AnalysisHouseholds.Firms.Marginal costs and markups.Elements of equilibrium.Money demand. Capital accumulation.Walsh,Carl E.(2003):Monetary Theory and Policy,Second Edition,MIT Press,chapter2 (also related:chapter3)Woodford,Michael(2003):Interest and Prices:Foundations of a Theory of Monetary Policy,Princeton University Press,chapter1.Flexible PricesThe classical monetary model.Optimal price setting.Neutrality.Monetary policy rules and price level determination.Sources of non-neutrality.Optimal monetary policy. Hyperinflations.Walsh,Carl E.(2003):Monetary Theory and Policy,Second Edition,MIT Press,chapter2.Woodford,Michael(2003):Interest and Prices:Foundations of a Theory of Monetary Policy,Princeton University Press,chapter2.Cooley,Thomas F.and Gary D.Hansen(1995):“Money and the Business Cycle,”in in T. Cooley ed.:Frontiers of Business Cycle Research(Princeton University Press).Cooley,Thomas F.and Gary D.Hansen(1989):“Inflation Tax in a Real Business Cycle Model,”American Economic Review79,733-748.King,Robert G.,and Mark Watson(1996):“Money,Prices,Interest Rates,and the Business Cycle,”Review of Economics and Statistics,vol78,no1,35-53.Chari,V.V.,and Patrick J.Kehoe(1999):“Optimal Fiscal and Monetary Policy,”in in J.B. Taylor and M.Woodford eds.,Handbook of Macroeconomics,volume1C,1671-1745.Correia,Isabel,and Pedro Teles(1999):“The Optimal Inflation Tax,”Review of Economic Dynamics,vol.2,no.2325-346.A Baseline Sticky Price ModelThe Calvo model.The new Keynesian Phillips curve.The output gap and the natural rate of interest.The effects of monetary policy shocks.Evidence on inflation dynamics.Alternative time-dependent models:convex price adjustment costs,the Taylor model,the truncated Calvo model.State-dependent models.Walsh,Carl E.(2003):Monetary Theory and Policy,Second Edition,MIT Press,chapter5.Woodford,Michael(2003):Interest and Prices:Foundations of a Theory of MonetaryPolicy,Princeton University Press,chapter4.Calvo,Guillermo(1983):“Staggered Prices in a Utility Maximizing Framework,”Journal of Monetary Economics,12,383-398.Yun,Tack(1996):“Nominal Price Rigidity,Money Supply Endogeneity,and Business Cycles,”Journal of Monetary Economics37,345-370.King,Robert G.,and Alexander L.Wolman(1996):“Inflation Targeting in a St.Louis Model of the21st Century,”Federal Reserve Bank of St.Louis Review,vol.78,no.3.(NBER WP#5507).Fuhrer,Jeffrey C.and George R.Moore(1995):“Inflation Persistence”,Quarterly Journal of Economics,Vol.110,February,pp127-159.Galí,Jordi and Mark Gertler(1998):“Inflation Dynamics:A Structural Econometric Analysis,”Journal of Monetary Economics,vol44,no.2,195-222.Sbordone,Argia(2002):“Prices and Unit Labor Costs:A New Test of Price Stickiness,”Journal of Monetary Economics,vol.49,no.2,265-292.Galí,Jordi,Mark Gertler,David López-Salido(2001):“European Inflation Dynamics,”European Economic Review vol.45,no.7,1237-1270.Galí,Jordi,Mark Gertler,David López-Salido(2005):“Robustness of the Estimates of the Hybrid New Keynesian Phillips Curve,”Journal of Monetary Economics,forthcoming.Eichenbaum,Martin and Jonas D.M.Fisher(2004):“Evaluating the Calvo Model of Sticky Prices,”NBER WP10617.Mankiw,N.Gregory and Ricardo Reis(2002):“Sticky Information vs.Sticky Prices:A Proposal to Replace the New Keynesian Phillips Curve,”Quartely Journal of Economics,vol. CXVII,issue4,1295-1328.Rotemberg,Julio(1996):“Prices,Output,and Hours:An Empirical Analysis Based on a Sticky Price Model,”Journal of Monetary Economics37,505-533.Chari,V.V.,Patrick J.Kehoe,Ellen R.McGrattan(2000):“Sticky Price Models of the Business Cycle:Can the Contract Multiplier Solve the Persistence Problem?,”Econometrica, vol.68,no.5,1151-1180.Wolman,Alexander(1999):“Sticky Prices,Marginal Cost,and the Behavior of Inflation,”Economic Quarterly,vol85,no.4,29-48.Dotsey,Michael,Robert G.King,and Alexander L.Wolman(1999):“State Dependent Pricing and the General Equilibrium Dynamics of Money and Output,”Quarterly Journal of Economics,vol.CXIV,issue2,655-690.Dotsey,Michael,and Robert G.King(2005):“Implications of State Dependent Pricing for Dynamic Macroeconomic Models,”Journal of Monetary Economics,52,213-242.Golosov,Mikhail,Robert E.Lucas(2005):“Menu Costs and Phillips Curves”mimeo.Gertler,Mark and John Leahy(2005):“A Phillips Curve with an Ss Foundation,”mimeo.Monetary Policy Design in the Baseline ModelA benchmark case.Optimal monetary policy and its implementation.The Taylor Principle. Simple Monetary Policy Rules.Second order approximation to welfare losses.Evidence on Monetary Policy rules.The effects of technology shocks:theory and evidence.Galí,Jordi(2003):“New Perspectives on Monetary Policy,Inflation,and the BusinessCycle,”in Advances in Economics and Econometrics,volume III,edited by M.Dewatripont, L.Hansen,and S.Turnovsky,Cambridge University Press(also available as NBER WP#8767).Woodford,Michael(2003):Interest and Prices:Foundations of a Theory of Monetary Policy,Princeton University Press,chapter6.Yun,Tack(2005):“Optimal Monetary Policy with Relative Price Distortions”American Economic Review,vol.95,no.1,89-109Blanchard,Olivier and Charles Kahn(1980),“The Solution of Linear Difference Models under Rational Expectations”,Econometrica,48,1305-1311Bullard,James,and Kaushik Mitra(2002):“Learning About Monetary Policy Rules,”Journal of Monetary Economics,vol.49,no.6,1105-1130.Woodford,Michael(2001):“The Taylor Rule and Optimal Monetary Policy,”American Economic Review91(2):232-237(2001).Rotemberg,Julio and Michael Woodford(1999):“Interest Rate Rules in an Estimated Sticky Price Model,”in J.B.Taylor ed.,Monetary Policy Rules,University of Chicago Press.Benhabib,Jess,Stephanie Schmitt-Grohe,and Martin Uribe(2001):“The Perils of Taylor Rules,”Journal of Economic Theory96,40-69.Levin,Andrew,Volker Wieland,and John C.Williams(2003):“The Performance of Forecast-Based Monetary Policy Rules under Model Uncertainty,”American Economic Review,vol.93,no.3,622-645.Clarida,Richard,Jordi Galí,and Mark Gertler(2000):“Monetary Policy Rules and Macroeconomic Stability:Evidence and Some Theory,”Quarterly Journal of Economics,vol. 115,issue1,147-180.Taylor,John B.(1998):“An Historical Analysis of Monetary Policy Rules,”in J.B.Taylor ed.,Monetary Policy Rules,University of Chicago Press.Orphanides,Athanasios(2003):“The Quest for Prosperity Without Inflation,”Journal of Monetary Economics50,633-663Galí,Jordi(1999):“Technology,Employment,and the Business Cycle:Do Technology Shocks Explain Aggregate Fluctuations?,”American Economic Review,vol.89,no.1,249-271.Basu,Susanto,John Fernald,and Miles Kimball(2004):“Are Technology Improvements Contractionary?,”American Economic Review,forthcoming(also NBER WP#10592).Francis,Neville,and Valerie Ramey(2005):“Is the Technology-Driven Real Business Cycle Hypothesis Dead?Shocks and Aggregate FLuctuations Revisited,”Journal of Monetary Economics,forthcoming.Galí,Jordi and Pau Rabanal(2004):“Technology Shocks and Aggregate Fluctuations: How Well Does the RBC Model Fit Postwar U.S.Data?,”NBER Macroeconomics Annual 2004,225-288.(also as NBER WP#10636).Christiano,Lawrence,Martin Eichenbaum,and Robert Vigfusson(2003):“What happens after a Technology Shock?,”NBER WP#9819.Galí,Jordi,J.David López-Salido,and Javier Vallés(2003):“Technology Shocks and Monetary Policy:Assessing the Fed’s Performance,”Journal of Monetary Economics,vol.50, no.4.,723-743.Extensions of the Baseline Model and their Implications for Monetary PolicyCost-push shocks.Nominal wage rigidities.Monetary frictions.Inflation inertia.Real wage rigidities.Steady state distortions.Estimated medium-scale models.Giannoni,Marc P.,and Michael Woodford(2003):“Optimal Inflation Targeting Rules,”in B.Bernanke and M.Woodford,eds.The Inflation Targeting Debate,Chicago,Chicago University Press.(also NBER WP#9939).Woodford,Michael(2003):Interest and Prices:Foundations of a Theory of Monetary Policy,Princeton University Press,chapters6-8.Clarida,Richard,Jordi Galí,and Mark Gertler(1999):“The Science of Monetary Policy:A New Keynesian Perspective,”Journal of Economic Literature,vol.37,no.4,1661-1707.Erceg,Christopher J.,Dale W.Henderson,and Andrew T.Levin(2000):“Optimal Monetary Policy with Staggered Wage and Price Contracts,”Journal of Monetary Economics vol.46,no.2,281-314.Huang,Kevin X.D.,and Zheng Liu.(2002):“Staggered Price-setting,staggeredwage-setting and business cycle persistence,”Journal of Monetary Economics,vo.49,405-433.Woodford,Michael(2003):“Optimal Interest Rate Smoothing,”Review of Economic Studies,vol.70,no.4,861-886.Steinsson,Jón(2003):“Optimal Monetary Policy in an Economy with Inflation Persistence,”Journal of Monetary Economics,vol.50,no.7.Blanchard,Olivier J.and Jordi Galí(2005):“Real Wage Rigidities and the Nw Keynesian Model”mimeo.Benigno,Pierpaolo,and Michael Woodford(2005):“Inflation Stabilization and Welfare: the Case of a Distorted Steady State”Journal of the European Economic Association, forthcoming.Khan,Aubhik,Robert G.King and Alexander L.Wolman(2003):“Optimal Monetary Policy,”Review of Economic Studies,825-860.Christiano,Lawrence J.,Martin Eichenbaum,and Charles L.Evans(2001):“Nominal Rigidities and the Dynamic Effects of a Shock to Monetary Policy,”Journal of Political EconomySmets,Frank,and Raf Wouters(2003):“An Estimated Dynamic Stochastic General Equilibrium Model of the Euro Area,”Journal of the European Economic Association,vol1, no.5,1123-1175.Monetary Policy in the Open EconomyEmpirical issues.Two country models.Small Open Economy.Monetary Unions.Local Currency Pricing.Benigno,Gianluca,and Benigno,Pierpaolo(2003):“Price Stability in Open Economies,”Review of Economic Studies,vol.70,no.4,743-764.Galí,Jordi,and Tommaso Monacelli(2005):“Monetary Policy and Exchange Rate Volatility in a Small Open Economy,”Review of Economic Studies,vol.72,issue3,2005,707-734.Clarida,Richard,Jordi Galí,and Mark Gertler(2002):“A Simple Framework for International Monetary Policy Analysis,”Journal of Monetary Economics,vol.49,no.5, 879-904.Benigno,Pierpaolo(2004):“Optimal Monetary Policy in a Currency Area,”Journal of International Economics,vol.63,issue2,293-320.Monetary and Fiscal Policy InteractionsFiscal policy rules and equilibrium determination.Distortionary taxes and optimal policy. Non-Ricardian economies and the effects ernment spending.Optimal monetary and fiscal policy in currency unions.Leeper,Eric(1991):“Equilibria under Active and Passive Monetary Policies,”Journal of Monetary Economic s27,129-147.Sims,Christopher A.(1994):“A Simple Model for the Determination of the Price Level and the Interaction of Monetary and Fiscal Policy,”Economic Theory,vol.4,381-399.Woodford,Michael(1996):“Control of the Public Debt:A Requirement for Price Stability,”NBER WP#5684.Davig,Troy and Eric Leeper(2005):“Fluctuating Macro Policies and the Fiscal Theory,”mimeo.Schmitt-Grohé,Stephanie,and Martin Uribe(2004):“Optimal Fiscal and Monetary Policy under Sticky Prices,”Journal of Economic Theory114,198-230Schmitt-Grohé,Stephanie,and Martin Uribe(2003):“Optimal Simple and Implementable Monetary and Fiscal Rules,”NBER WP#10253.Blanchard,Olivier and Roberto Perotti(2002),“An Empirical Characterization of the Dynamic Effects of Changes in Government Spending and Taxes on Output,”Quarterly Journal of Economics,vol CXVII,issue4,1329-1368.Fatás,Antonio and Ilian Mihov(2001),“The Effects of Fiscal Policy on Consumption and Employment:Theory and Evidence,”INSEAD,mimeo.Galí,Jordi,J.David López-Salido and Javier Vallés(2005):“Understanding the Effects of Government Spending on Consumption,”mimeo.Galí,Jordi,and Tommaso Monacelli(2005):“Optimal Monetary and Fiscal Policy in a Currency Union:A New Keynesian Perspective,”miemo.。
曼昆-十大经济学原理,中英文对照

十大经济学原理。
曼昆在《经济学原理》一书中提出了十大经济学原理,他们分别是:十大经济学原理一:人们面临权衡取舍。
人们为了获得一件东西,必须放弃另一件东西。
决策需要对目标进行比较。
People Face Trade offs. To get one thing, you have to give up something else. Making decisions requires trading off one goal against another.例子:这样的例子很多,典型的是在“大炮与黄油”之间的选择,军事上所占的资源越多,可供民用消费和投资的资源就会越少。
同样,政府用于生产公共品的资源越多,剩下的用于生产私人品的资源就越少;我们用来消费的食品越多,则用来消费的衣服就越少;学生用于学习的时间越多,那么用于休息的时间就越少。
十大经济学原理二:某种东西的成本是为了得到它所放弃的东西。
决策者必须要考虑其行为的显性成本和隐性成本。
The Cost of Something is what You Give Up to Get It. Decision-makers have to consider both the obvious and implicit costs of their actions.例子:某公司决定在一个公园附近开采金矿的成本。
开采者称由于公园的门票收入几乎不受影响,因此金矿开采的成本很低。
但可以发现伴随着金矿开采带来的噪声、水和空气的污染、环境的恶化等,是否真的不会影响公园的风景价值?尽管货币价值成本可能会很小,但是考虑到环境和自然生态价值会丧失,因此机会成本事实上可能很大。
十大经济学原理三:理性人考虑边际量。
理性的决策者当且仅当行动的边际收益超过边际成本时才采取行动。
Rational People Think at Margin. A rational decision-maker takes action if and only ifthe marginal benefit of the action exceeds the marginal cost.例子:“边际量”是指某个经济变量在一定的影响因素下发生的变动量。
宏观调控英语术语

宏观调控英语术语
宏观调控英语术语是指应用于宏观经济领域的一些专业术语,主要用于描述国家或政府在宏观经济领域进行的调控活动。
以下是一些常见的宏观调控英语术语:
1. Fiscal Policy:财政政策
2. Monetary Policy:货币政策
3. Interest Rate:利率
4. Inflation:通货膨胀
5. Deflation:通货紧缩
6. Recession:经济衰退
7. Stabilization Policy:稳定政策
8. Aggregate Demand:总需求
9. Aggregate Supply:总供给
10. Gross Domestic Product (GDP):国内生产总值
11. Unemployment Rate:失业率
12. Exchange Rate:汇率
13. Balance of Payments:国际收支
14. Structural Adjustment:结构调整
15. Public Debt:公共债务
16. Money Supply:货币供应量
这些术语在宏观经济领域中被广泛使用,有助于描述和分析国家或政府在经济调控方面所采取的政策和措施。
了解这些术语可以帮助
我们更好地理解经济现象和政策。
通货膨胀动态和通胀预期外文文献翻译2019-2020

通货膨胀动态和通胀预期外文翻译2019-2020英文Global inflation dynamics and inflation expectationsMartin Feldkirchera, Pierre SiklosAbstractIn this paper we investigate dynamics of inflation and short-run inflation expectations. We estimate a global vector autoregressive (GV AR) model using Bayesian techniques. We then explore the effects of three source of inflationary pressure that could drive up inflation expectations: domestic aggregate demand and supply shocks as well as a global increase in oil price inflation. Our results indicate that inflation expectations tend to increase as inflation accelerates. However, the effects of the demand and supply shocks are short-lived for most countries. When global oil price inflation accelerates, however, effects on inflation and expectations are often more pronounced and long-lasting. Hence, an assessment of the link between observed inflation and inflation expectations requires disentangling the underlying sources of inflationary pressure. We also examine whether the relationship between actual inflation and inflation expectations changed following the global financial crisis. The transmission between inflation and inflation expectations is found to be largely unaffected in response to domestic demand and supply shocks, while effects of an oil price shock on inflationexpectations are smaller post-crisis.Keywords: Inflation, Inflation expectations, GV AR modelling, Anchoring of inflation expectationsIntroductionInflation expectations are a pivotal variable in providing insights about likely future economic conditions. While the decades long debate about the degree to which monetary policy is forward looking has not abated (e.g., Friedman, 1968; Woodford, 2003a) there is little doubt that policy makers devote considerable attention to the economic outlook. Hence, the dynamics of the relationship between inflation and inflation expectations continues to pre-occupy the monetary authorities and central bankers. Even before the full impact of the global financial crisis (GFC) of 2008–9 was felt in the US, and in many other parts of the globe, central bankers such as Bernanke (2007) highlighted the importance of inflation expectations since “… the state of inflation expectations greatly influences actual inflation …“. More recently, Yellen (2016) also underscores the crucial role played by expectations while bemoaning the fact that the profession must confront gaps in our knowledge about the relationship between observed inflation and the short-run inflation expectations that lies at the heart of many theoretical macroeconomic models. It is not difficult to come across speeches by central bankers who, on a regular basis, touch upon the subject of the formation andimplications of inflation expectations.A main, but not sole, driver of inflation expectations is past inflation. At the risk of some over-simplification, inflation can be thought of as being driven by two sets of determinants, namely local or domestic factors versus international or global forces. The local determinants would include technical progress and changes in productivity, demographic factors, institutional considerations such as the adoption of inflation targeting and central bank independence and, since 2008, the adoption and maintenance of unconventional monetary policies in systemically important economies. More generally, however, economists tend to make the distinction between aggregate demand and supply sources of changes in inflation pressure. In what follows, we retain this distinction to allow for greater comparability with the extant literature as well as because it provides us with a vehicle to present new insights into the underlying drivers of inflation and ultimately about the likelihood that inflation expectations can be anchored.Globalization in both the trading of good and services and in finance is often also touted as a critical driver of the international component that influences domestic inflation rates. As a result, the extant literature has diverged wherein some argue that models of inflation are too nation centric (e.g., Borio & Filardo, 2007; Ahmad & Civelli, 2016; Auer, Borio, & Filardo, 2017, Kabukçuoğlu & Martínez-García, 2018) while othersplace greater emphasis on the various local factors mentioned above.The current literature generally focuses on a homogeneous set of countries (e.g., advanced or emerging market economies; see the following section). We depart from this norm to consider 42 economies that span a wide range in terms of their size, success at controlling inflation, monetary strategies in place, and the extent to which they were directly implicated or not in the GFC. To fully exploit the potential for cross-border spillovers in inflation we use the Global V ARs (GV AR) methodology (Pesaran & Chudik, 2016). This methodology is well suited to address the domestic impact of changing inflation on expectations dynamics controlling for international spillovers through cross-border inter-linkages.Often, global factors are constructed using some indicator of trade openness to aggregate country-specific series. Nevertheless, there is disagreement about whether this is the appropriate vehicle to estimate global versus local influences on domestic inflation (e.g., Kabukçuoğlu & Martínez-García, 2018; Ahmad & Civelli, 2016). Instead, we propose a novel set of weights in estimating the GV AR obtained from the forecast error variance decompositions estimated via the methodology of Diebold and Yilmaz (DY, 2009) developed to measure the degree of connectedness. Since the debate about local versus global determinants of inflation expectations partly centers around the extent to which countriesare linked to each other the DY technique is a natural one to use in the present circumstances. Indeed, the foregoing combination of methodologies permits us to highlight two neglected aspects of the debate about what drives inflation and inflation expectations. First, that the relative importance of local versus global factors is likely a function of the policy horizon. Second, the globalization of observed inflation is also reflected in a globalization of expected inflation. While the GV AR methodology provides a very rich set of potential shocks that may be analyzed, we focus on two sets of shocks. They are: the impact of domestic aggregate demand and supply shocks on inflation and inflation expectations and the impact of a global oil price supply shock on these same two variables.Briefly, we find that inflation expectations respond positively to either domestic aggregate demand or supply shocks, but the effects are generally temporary. This finding holds equally true for the post-crisis period. By contrast, if inflation accelerates due to a pick-up in global oil price inflation, inflation expectations respond significantly positive and effects are long lasting. The impact on inflation is even larger than on inflation expectations. Hence, oil price shocks drive a wedge between inflation and inflation expectations even among professional forecasters. Nevertheless, actual inflation and inflation expectations tend to co-move closely and the pass-through has diminished in the aftermath of the crisis.Therefore, in an era where energy prices are volatile and are subject to large swings, this has implications for when and how aggressively monetary authorities ought to respond to oil price shocks. An additional important implication is that identifying the aggregate supply from aggregate demand components of shocks is critical to understanding the dynamics of both observed and expected inflation.Literature reviewInflation expectations lie at the core of all macroeconomic models (e.g., Woodford, 2003a). Moreover, to the extent that policy is able to influence these expectations, understanding the connection with observed inflation remains an essential ingredient to evaluating the impact of monetary policy.Especially following the GFC, the debate surrounding the mechanism that best describes how expectations adjust in response to shocks, as well as what are the fundamental drivers of inflation expectations, has been rekindled. The same is true of the companion literature that explores the dynamics and determinants of observed inflation. An era of ultra-low interest rates, combined with low inflation, has also contributed to reviving the study and debate about links between inflation and inflation expectations.Rational expectations serve as a convenient benchmark, in part because theoretical models are readily solvable and closed form solutionsare typically feasible. However, when confronted with the empirical evidence, considerable differences of opinion emerge about how best to describe the evolution of expectations. For example, an early assessment by the Bank of Japan of its Quantitative and Qualitative Easing program (QQE; Bank of Japan, 2016) finds that the Japanese are prone to adjusting inflation expectations more gradually than in other advanced economies (e.g., the US or the euro area). This is largely due to the backward-looking nature of these expectations. This also resonates somewhat with recent evidence from the US (e.g., Trehan, 2015) and other economies both large and systemically important as well as ones that are small and open (e.g., Bhatnagar et al., 2017).Of course, there may be several explanations for the sluggish adjustment of inflation expectations. Japan, after two decades or more of very low inflation to low deflation, sets this country apart from the remaining advanced economies which, over the same period, experienced only passing bouts of deflation (early 2000s and in the aftermath of the 2007-8 global financial crisis). Since that time, below ‘normal’ inflation rates have spread across much of the advanced world. Unsurprisingly, this has attracted the attention and the concern of policy makers. This represents a relatively new element in the story of the dynamics of inflation.6It is also notable that, prior to the recent drop in inflation, the main concern was the role of commodity prices, notably oil prices, ingenerating higher inflation and the extent to which these shocks were seen to have permanent effects or not.Even if domestic economic slack retains its power to influence inflation, the globalization of trade and finance has introduced a new element into the inflation story, namely the potential role of global slack. Rogoff (2003, 2006) early on drew attention to the link between the phenomenon of globalization and inflation. Alternatively, at almost the high point of the globalization era, studies began to appear that provided empirical support either in favor of a significant global component in inflation, in some of its critical components (e.g., Ciccarelli & Mojon, 2010; Parker, 2017), or via the global influence of China's rapid economic growth (e.g., Pang & Siklos, 2016, and references therein).Economists, central bankers and policy makers have waxed and waned in their views about the significance of global slack as a source of inflationary pressure. Nevertheless, it is a consideration that needs to be taken seriously and the question remains understudied (e.g., see Borio & Filardo, 2007, Ihrig, Kamin, Lindner, & Marquez, 2010 and Yellen, 2016). More broadly, the notion that a global component is an important driver of domestic inflation rates continues to find empirical support despite of the proliferation of new econometric techniques used to address the question (e.g., Carriero, Corsello, & Marcellino, 2018).Recalling the words of central bankers cited in the introduction thereremains much to be learned about the dynamic relationship between observed and expected inflation. The two are inextricably linked, for example, in theory because the anchoring of expectations is thought to be the core requirement of a successful monetary policy strategy that prevents prices (and wages) from drifting away either from a stated objective, as in inflation targeting economies, or an implicit one where the central bank is committed to some form of price stability.There is, of course, also an ever-expanding literature that examines how well expectations are anchored. This literature focuses mostly on long-run inflation expectations (e.g., see Buono & Formai, 2018; Chan, Clark, & Koop, 2017; Mehrotra & Yetman, 2018; Lyziak & Paloviita, 2016; Strohsal & Winkelmann, 2015, and references therein). A few authors have focused on episodes when inflation is below target (e.g., Ehrmann, 2015), or during mild deflations (Banerjee & Mehrotra, 2018), while IMF (2016), Blanchard (2016), and Blanchard, Cerutti, and Summers (2015), are more general investigations of the issues.While central bankers and a considerable portion of existing empirical research worries about how changes to inflation expectations influence observed inflation the more recent literature on the anchoring of expectations shifts the emphasis on how inflation shocks can de-anchor these same expectations. Unfortunately, there is as yet no formal definition of ‘anchoring’. Indeed, there is still nothing approaching aconsensus on the determinants of inflation expectations from various sources (e.g., households, firms, professionals). Factors range from the past history of inflation, knowledge of monetary policy, media portrayals of the inflation process, shopping experience, and the impact of commodity prices, to name some of the most prominent determinants (e.g., see Coibion, Gorodnichenko, Kumar, & Pedemonte, 2018b). Not listed is a role for global factors which is a focus of the present study. Since, as we shall see below, there is a close connection between inflation and expected inflation, and an increasingly well-established link between global and local inflation, there exists an additional unexplored avenue that ties inflation performance on a global scale to local inflation expectations. We contribute to this literature in the sense that we also quantify the effects of inflationary shocks on short-run inflation expectations, which has a bearing on the ability of central banks to anchor inflation in the medium-term.Ad hoc methods exist to convert fixed event into fixed horizon forecasts (e.g., see Buono & Formai, 2018; Siklos, 2013). Winkelried (2017) adapts the Kozicki and Tinsley (2012) shifting endpoint model to exploit the information content of fixed event forecasts. Of course, we do not know whether or how much new information is absorbed into subsequent forecasts in an environment where the horizon shrinks whether it is because information is sticky or there is sufficient rationalinattention that mitigates the effective differences between fixed horizon and fixed event forecasts. Although constructed fixed horizon forecasts are imperfect (e.g., Yetman, 2018) they have the advantage that several papers in the extant literature employ this proxy.Until the recent period of sluggish inflation, the focus of much research fell on accounts that sought to evaluate the success, or lack thereof, of inflation targeting (IT) regimes. The fact that this kind of monetary policy strategy was designed in an era where the challenge was to reduce inflation is not lost on those who ask whether IT regimes are up to the task of maintaining inflation close to the target (e.g., see Ehrmann, 2015 and references therein).Fuhrer (2017) considers the extent to which expectations of inflation are informative about the dynamics of observed inflation based on empirical work that covers a period of 25 years for the US and Japan. Fuhrer's study is also interested in the extent to which long-term inflation objectives can be modelled via a sequence of short-term forecasts. The answer seems to be in the affirmative but significant departures from the long-term are present in the data. In contrast, our study is not able to determine the strength of any such links due to data limitations, as we shall see. Nevertheless, as suggested above, the degree to which inflation is anchored need not be solely evaluated according to long-term expectations. Short-term deviations can also serve as warning signals.To our knowledge then, a dynamic model that attempts to evaluate the link between inflation and inflation expectations in economies beyond ones that are advanced, and the role of global factors as well as cross-country interactions, is still missing. The following sections begin to fill the gap.Empirical resultsWe begin by investigating the responses of inflation expectations and actual inflation to a domestic AD shock. We see that for most economies the response of inflation expectations is either flat and hovers around zero or is hump shaped, petering out in the longer term. This finding implies a high degree of anchoring of short-term inflation expectations, which might directly translate into anchoring of long-run inflation expectations. Countries for which inflation expectations converge more slowly comprise advanced and euro area economies (Italy, Ireland, Norway, Portugal and Slovenia), CESEE economies (Bulgaria, Croatia, Russia), Asian economies (China, India and Indonesia) as well as South Africa. In Italy, Norway, South Africa and Slovenia the cooling off phase of inflation expectations takes particularly long. Inflation expectations decrease in India, Indonesia and Chile.Do inflation expectations and actual inflation always move in the same direction? We see that actual inflation responses are not hump shaped – rather in most countries actual inflation gradually declines anddies out after 8–16 months. However, in countries that show a longer adjustment phase, actual inflation responses also take longer to cool off. In countries with negative inflation expectation responses actual inflation tends to be negative over the impulse response horizon such as in the cases of India and Chile. In Indonesia, by contrast, actual inflation is positive up until 20 months revealing a negative relationship between inflation expectations and inflation, which, however, is not statistically significant since credible intervals of both responses overlap. A significantly larger long-run effect of inflation compared to inflation expectations can be found in Peru, though.Next, we investigate the impact of domestic AS shocks on inflation expectations. Here, we also find that inflation expectations tend to adjust rather quickly for almost all countries. Shapes of actual inflation responses tend to differ from those for inflation expectations indicating that there is no direct one-to-one relationship between the two series. Exceptions to this result are obtained in countries that either show a positive and significant response of inflation expectations in the long-run (Bulgaria and Croatia) or a negative response (India, Brazil and Chile). In these countries, inflation expectations tend to follow closely actual inflation responses implying that there is no divergence between responses of inflation expectations and actual inflation. Only in two countries are differences in long-run responses of inflation expectationsand inflation statistically significant. More specifically, in Chile, responses of inflation expectations are significantly more pronounced than responses of actual inflation, whereas the opposite is the case in Peru.Finally, we look at the effects of a supply side driven acceleration of oil price inflation. Here, we see that most of the effects are positive and long-lasting. Also, the effects are sometimes rather sizable even in the long-run. The bottom panel shows differences in inflation expectations and inflation responses along with 68% credible intervals. The figure indicates that even after 25 months, effects on actual inflation are sizable and for some countries significantly larger than those on inflation expectations. Regressing the posterior median of these differences on the sum of exports and imports in % of GDP, averaged over the sample period, shows that countries with a higher degree of trade openness show larger differences in responses. The implication is that for more open economies the effect of oil price changes on domestic inflation is larger, thereby driving a wedge between expectations and actual inflation. That the effect of global shocks on domestic inflation is larger for more open economies is consistent with the findings provided in Ahmad and Civelli (2016). Having said that, responses of inflation expectations in absolute terms also tend to be sizeable. Indeed, in 23 of 42 countries, long run-effects on inflation expectations are above 0.4. This implies thatnearly half of the acceleration in oil prices directly translates into upward movements of inflation expectations. In contrast to the domestic demand and supply shocks, there are no significantly negative responses for the countries covered in this study. Finally, comparing the shapes of impulse responses, we find a strong relationship between actual inflation and inflation expectation responses.Summing up, inflation expectations increase in the short-run if inflationary pressure stems from either domestic supply or demand shocks. However, no permanent effects are found. This result changes when a global acceleration of oil price inflation is considered. Here, we find positive long-run effects on inflation expectations for a range of countries. Also, there is a close link between actual inflation and inflation expectations indicating that there is a direct pass-through, to a different extent, from oil prices to domestic inflation to inflation expectations.ConclusionsIn this paper we investigate the dynamics of global inflation and short-run inflation expectations. We first demonstrate the existence of substantial interdependence between global and domestic inflation and inflation expectations. This implies that inflation expectations are not only driven by changes in domestic macroeconomic conditions but also by inflation expectations of other countries. The same holds true for observed inflation.We then proceed to investigate the drivers of inflation expectations controlling for global linkages in the data. We rely on a global vector autoregressive (GV AR) model estimated using Bayesian shrinkage priors. Our model nests a broad range of specifications for inflation and inflation expectations including variables that measure global slack. We then identify three shocks that can lead to inflationary pressure, namely a domestic aggregate demand shock, a domestic aggregate supply shock and a global acceleration of oil price inflation. The shocks are identified using sign restrictions and the oil supply shock makes use of the cross-sectional dimension of the data (Cashin et al., 2014, Mohaddes and Pesaran, 2016).Our main findings are as follows: First, we find that inflation expectations respond positively to domestic shocks that drive up actual inflation. This is true for aggregate demand shocks that drive up both actual inflation and output as well as for aggregate supply shocks which are characterized by an acceleration of inflation but a contraction in output. Peak effects of inflation expectations tend to be positive, but overall effects are rather short-lived. The most direct pass-through from actual inflation to inflation expectations, however, is observed when inflation increases due to a global acceleration of (supply-driven) oil price inflation. Here, both actual inflation and inflation expectations respond positively and effects are sizeable. This implies that for a policy makerinterested in the anchoring of long-run inflation expectations, oil price shocks should be closely watched since the high pass-through to short-run inflation expectations can limit the room for long-run inflation expectation anchoring. This is not the case for domestic demand and supply shocks that only show short-lived effects on short-run inflation expectations.Second, we examine whether the pass-through of inflation to short-run inflation expectations has changed during the aftermath of the global financial crisis – a period that was characterized by low inflation in advanced economies and the introduction of unconventional monetary policies by several major central banks to stimulate inflation. We find that the transmission between inflation and inflation expectations was largely unaffected in response to domestic demand and supply shocks. For the oil supply shock, our findings indicate a smaller impact on inflation expectations post-crisis. This implies a greater likelihood of a successful anchoring of long-run inflation expectations in the aftermath of the crisis compared to the full sample period. Lastly, we examine more generally the drivers of inflation expectations. Here we find that domestic inflation expectations, oil prices and variables from large emerging economies such as India and Turkey are important drivers of inflation expectations. For some CESEE economies, Russian macroeconomic conditions also shape inflation expectations.Some (e.g., Coibion, Gorodnichenko, Kumar, et al., 2018b) have drawn attention to differences between household and the professional forecasts used in the present study as critical to determining whether expectations are anchored. Clearly, this is a potential area where additional work is necessary. However, unlike household expectations, whose availability is episodic and where the manner in which surveys are structured and information about inflation expectations are solicited, our data set consists of comparable data and is on a global scale. Moreover, paralleling some of the results based on household surveys, professional forecasts are potentially just as sensitive to energy prices movements. Policy makers will have to bear this in mind when associating a tightening or loosening of monetary policy to changes in oil prices.中文全球通货膨胀动态和通胀预期马丁费德基拉摘要在本文中,我们研究了通胀和短期通胀预期的动态。
fomc货币政策会议声明全文(中英文对照)

fomc货币政策会议声明全文(中英文对照)美联储货币政策会议声明全文(中英文对照)中文版:美联储联邦公开市场委员会于XXX年XX月XX日召开货币政策会议。
会议讨论了当前经济状况和未来货币政策调整的问题。
根据对经济数据的评估和展望,委员会决定采取以下措施:1. 将联邦基金利率目标范围维持在XX%至XX%不变。
这一利率水平有助于支持经济增长和就业市场的稳定。
2. 将继续购买国债和抵押贷款支持证券,以维持适当的货币流动性。
购买规模和节奏将根据市场情况进行调整。
3. 继续监控经济增长、通胀和就业市场的变化,并根据数据来调整货币政策。
委员会将密切关注通胀预期和金融市场的波动。
4. 将通过透明的沟通方式向公众传达货币政策决策的思路和依据。
委员会鼓励公众对货币政策进行积极的参与和理解。
委员会认为,当前美国经济正在逐步复苏,但仍面临不确定性和风险。
委员会将继续采取适当的措施来支持和促进经济增长,同时保持通胀和金融市场稳定。
英文版:The Federal Open Market Committee (FOMC) of the Federal Reserve met on XX Month XX, XXXX to discuss the current economic conditions and future adjustments to monetary policy. Based on the assessment of economic data and outlook, the Committee decided to take the following measures:1. Maintain the target range for the federal funds rate at XX% to XX%. This level of interest rates is expected to support economic growth and stabilize the job market.2. Continue to purchase Treasury securities and mortgage-backed securities to maintain appropriate monetary liquidity. The scale and pace of purchases will be adjusted based on market conditions.3. Monitor changes in economic growth, inflation, and the job market, and adjust monetary policy accordingly. The Committee will closely watch inflation expectations and financial market volatility.4. Communicate the rationale and basis for monetary policy decisions in a transparent manner to the public. The Committee encourages active public participation and understanding of monetary policy.The Committee believes that the current U.S. economy is gradually recovering but still faces uncertainty and risks. The Committee will continue to take appropriate measures to support and promote economic growth while maintaining inflation and financial market stability.。
英语中宏观经济常用词汇以及实际应用
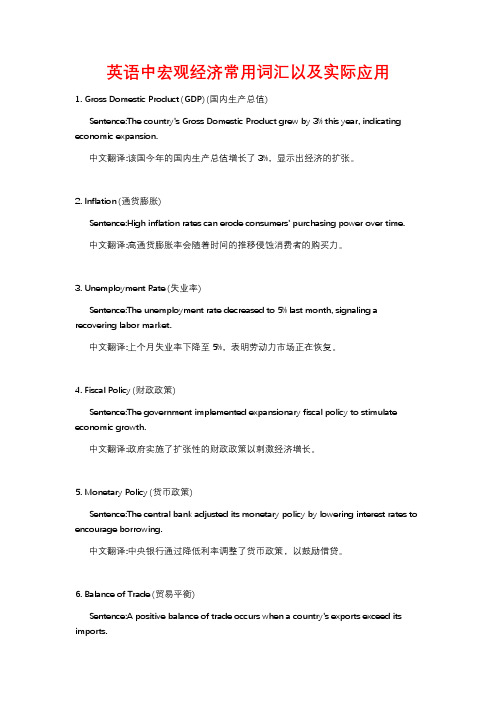
英语中宏观经济常用词汇以及实际应用1. Gross Domestic Product (GDP) (国内生产总值)Sentence:The country's Gross Domestic Product grew by 3% this year, indicating economic expansion.中文翻译:该国今年的国内生产总值增长了3%,显示出经济的扩张。
2. Inflation (通货膨胀)Sentence:High inflation rates can erode consumers' purchasing power over time.中文翻译:高通货膨胀率会随着时间的推移侵蚀消费者的购买力。
3. Unemployment Rate (失业率)Sentence:The unemployment rate decreased to 5% last month, signaling a recovering labor market.中文翻译:上个月失业率下降至5%,表明劳动力市场正在恢复。
4. Fiscal Policy (财政政策)Sentence:The government implemented expansionary fiscal policy to stimulate economic growth.中文翻译:政府实施了扩张性的财政政策以刺激经济增长。
5. Monetary Policy (货币政策)Sentence:The central bank adjusted its monetary policy by lowering interest rates to encourage borrowing.中文翻译:中央银行通过降低利率调整了货币政策,以鼓励借贷。
6. Balance of Trade (贸易平衡)Sentence:A positive balance of trade occurs when a country's exports exceed its imports.中文翻译:当一个国家的出口超过进口时,就会出现贸易平衡顺差。
宏观背景概述英语作文

宏观背景概述英语作文Title: Overview of Macroeconomic Background。
In understanding the macroeconomic landscape, it is imperative to analyze various key factors shaping the global economy. This essay provides a comprehensive overview of the current macroeconomic background, focusing on major economic indicators, trends, and challenges.Global Economic Performance:The global economy has experienced significant fluctuations in recent years, influenced by various factors such as geopolitical tensions, technological advancements, and the aftermath of the COVID-19 pandemic. Despite initial setbacks caused by the pandemic, many economies have shown resilience, albeit at varying paces of recovery.Growth and Output:Growth rates have been uneven across different regions. While some economies have demonstrated robust growth, others continue to grapple with sluggish recovery. China, for instance, has sustained its position as a key driver of global growth, albeit at a moderated pace compared to previous years. In contrast, advanced economies like the United States and European Union have witnessed moderate growth, hindered by supply chain disruptions andinflationary pressures.Inflation Dynamics:Inflation has emerged as a prominent concern in many economies. Supply chain disruptions, rising commodity prices, and increased demand have contributed toinflationary pressures globally. Central banks have responded by adopting various monetary policies to curb inflation while ensuring economic stability.Employment and Labor Markets:The labor market landscape has been shaped by evolvingwork patterns, including remote work and digitalization. While some sectors have witnessed job creation, others have faced challenges, leading to disparities in employment rates. Addressing skill mismatches and promoting workforce adaptability remain crucial for sustainable employment growth.Monetary Policy:Central banks worldwide have adopted accommodative monetary policies to support economic recovery. Interest rates have remained low, with some central banks implementing quantitative easing measures to stimulate lending and investment. However, concerns about inflation overshooting targets have prompted discussions about tightening monetary policy in the near future.Fiscal Policy:Governments have implemented expansive fiscal policies to mitigate the socio-economic impact of the pandemic. Stimulus packages, infrastructure investments, and socialwelfare programs have been pivotal in supporting households and businesses. However, concerns about mounting public debt and fiscal sustainability linger, necessitating prudent fiscal management strategies.Global Trade and Supply Chains:Global trade dynamics have been reshaped by supply chain disruptions, trade tensions, and shifts in consumer behavior. Protectionist measures and geopolitical tensions have hindered international trade flows, prompting callsfor greater multilateral cooperation and trade diversification strategies.Environmental and Social Considerations:The pursuit of sustainable development has gained prominence on the global agenda. Environmental challenges such as climate change and resource depletion underscore the need for green transitions and sustainable practices. Moreover, addressing social inequalities and promoting inclusive growth remain imperative for fostering long-termeconomic resilience.Conclusion:In conclusion, the macroeconomic landscape is characterized by a complex interplay of factors influencing global economic performance. While recovery efforts continue amidst lingering uncertainties, fostering resilience, sustainability, and inclusive growth remains paramount for navigating future challenges and fostering prosperity on a global scale.。
monetary policy restrictive -回复

monetary policy restrictive -回复该主题是“紧缩性货币政策(monetary policy restrictive)”,下面是一篇1500-2000字的文章来解答这个主题。
第一步:介绍货币政策和紧缩性货币政策货币政策是由中央银行制定和执行的一种政策,目的是通过控制货币供应量和利率来影响经济活动和通货膨胀水平。
紧缩性货币政策是其中一种,意味着中央银行采取措施来收紧经济,以控制通货膨胀和遏制过度经济增长。
第二步:紧缩性货币政策的工具紧缩性货币政策主要通过以下工具实施:1. 提高利率:中央银行可以提高政策利率,例如基准利率,从而提高借贷成本,减少个人和企业的借款和投资活动。
2. 减少货币供应量:中央银行可以通过减少银行存款准备金比率和出售国债等方式来减少货币供应量。
3. 调整外汇政策:中央银行可以调整汇率政策,以减少进口和增加出口,以抑制内需。
第三步:紧缩性货币政策的目标紧缩性货币政策的主要目标是控制通货膨胀水平。
当经济过热时,通货膨胀可能会加剧,导致物价上涨和失去购买力。
紧缩性货币政策通过提高利率和收紧货币供应量来抑制消费和投资需求,从而减缓通货膨胀压力。
第四步:紧缩性货币政策的优点1. 控制通货膨胀:紧缩性货币政策可以有效抑制通货膨胀,保持物价稳定,从而维持经济的可持续增长。
2. 遏制过度经济增长:当经济过热时,通货膨胀可能会增加,紧缩性货币政策可以通过收紧货币供应量和提高利率来抑制过度经济增长,防止经济泡沫的产生。
3. 促进投资稳定:通过提高利率,紧缩性货币政策可以减少虚假投资和资产泡沫,从而促进投资的稳定性和可持续性。
第五步:紧缩性货币政策的缺点1. 增加借款成本:紧缩性货币政策会导致借款成本上升,从而减少个人和企业的借贷活动,可能导致经济放缓和失业率上升。
2. 减少消费需求:通过提高利率和收紧货币供应量,紧缩性货币政策将减少人们的消费需求,对经济增长产生负面影响。
- 1、下载文档前请自行甄别文档内容的完整性,平台不提供额外的编辑、内容补充、找答案等附加服务。
- 2、"仅部分预览"的文档,不可在线预览部分如存在完整性等问题,可反馈申请退款(可完整预览的文档不适用该条件!)。
- 3、如文档侵犯您的权益,请联系客服反馈,我们会尽快为您处理(人工客服工作时间:9:00-18:30)。
For release on delivery5:00 p.m. EDTSeptember 24, 2015Inflation Dynamics and Monetary PolicyRemarks byJanet L. YellenChairBoard of Governors of the Federal Reserve SystematThe Philip Gamble Memorial LectureUniversity of Massachusetts, AmherstAmherst, MassachusettsSeptember 24, 2015I would like to thank Michael Ash for his kind introduction and the University of Massachusetts for the honor of being invited to deliver this year’s Philip Gamble Memorial Lecture.In my remarks today, I will discuss inflation and its role in the Federal Reserve’s conduct of monetary policy. I will begin by reviewing the history of inflation in the United States since the 1960s, highlighting two key points: that inflation is now much more stable than it used to be, and that it is currently running at a very low level. I will then consider the costs associated with inflation, and why these costs suggest that the Federal Reserve should try to keep inflation close to 2 percent. After briefly reviewing our policy actions since the financial crisis, I will discuss the dynamics of inflation and their implications for the outlook and monetary policy.Historical Review of InflationA crucial responsibility of any central bank is to control inflation, the average rate of increase in the prices of a broad group of goods and services. Keeping inflation stable at a moderately low level is important because, for reasons I will discuss, inflation that is high, excessively low, or unstable imposes significant costs on households and businesses. As a result, inflation control is one half of the dual mandate that Congress has laid down for the Federal Reserve, which is to pursue maximum employment and stable prices.The Federal Reserve has not always been successful in fulfilling the price stability element of its mandate. The dashed red line in figure 1 plots the four-quarter percent change in the price index for personal consumption expenditures (PCE)--the measure of inflation that the Fed’s policymaking body, the Federal Open Market Committee, orFOMC, uses to define its longer-run inflation goal.1 Starting in the mid-1960s, inflation began to move higher. Large jumps in food and energy prices played a role in this upward move, but they were not the whole story, for, as illustrated here, inflation was already moving up before the food and energy shocks hit in the 1970s and the early 1980s.2 And if we look at core inflation, the solid black line, which excludes food and energy prices, we see that it too starts to move higher in the mid-1960s and rises to very elevated levels during the 1970s, which strongly suggests that something more than the energy and food price shocks must have been at work.A second important feature of inflation over this period can be seen if we examine an estimate of its long-term trend, which is plotted as the dotted black line in figure 1. At each point in time, this trend is defined as the prediction from a statistical model of the level to which inflation is projected to return in the long run once the effects of any shocks to the economy have fully played out.3 As can be seen from the figure, this estimated trend drifts higher over the 1960s and 1970s, implying that during this period1 See the Federal Open Market Committee’s Statement on Longer-Run Goals and Monetary Policy Strategy, available on the Board’s website at/monetarypolicy/files/FOMC_LongerRunGoals.pdf.2 The first jump in energy prices in the 1970s reflected a rise in crude oil prices whose proximate cause was the so-called Arab oil embargo that followed the 1973 Arab-Israeli War; the first jump in food prices was caused by disease and poor harvests combined with low levels of inventories (particularly for grains) in many countries. The second energy price shock resulted from a jump in crude oil prices following the 1978-79 revolution in Iran and subsequent Iraqi invasion; the second food price shock was largely attributable to bad weather and disease. (See Blinder and Rudd, 2013, for an assessment of the effect that these and other special factors--including the imposition and removal of price controls over the 1971-74 period--had on consumer price inflation in the 1970s and 1980s.)3 The predicted long-run trend shown here updates an estimate made by Peneva and Rudd (2015), which uses a vector autoregression (VAR) with time-varying parameters and stochastic volatility to compute a stochastic trend for inflation (see that paper for additional details regarding model specification and data definitions). The estimation procedure for the VAR is similar to that used by Clark and Terry (2010), which in turn follows Cogley and Sargent (2005); see also Cogley and others (2010) and Ascari and Sbordone (2014) for related applications.there was no stable “anchor” to which inflation could be expected to eventually return--a conclusion generally supported by other procedures for estimating trend inflation.Today many economists believe that these features of inflation in the late 1960s and 1970s--its high level and lack of a stable anchor--reflected a combination of factors, including chronically overheated labor and product markets, the effects of the energy and food price shocks, and the emergence of an “inflationary psychology” whereby a rise in actual inflation led people to revise up their expectations for future inflation. Together, these various factors caused inflation--actual and expected--to ratchet higher over time. Ultimately, however, monetary policy bears responsibility for the broad contour of what happened to actual and expected inflation during this period because the Federal Reserve was insufficiently focused on returning inflation to a predictable, low level following the shocks to food and energy prices and other disturbances.In late 1979, the Federal Reserve began significantly tightening monetary policy to reduce inflation. In response to this tightening, which precipitated a severe economic downturn in the early 1980s, overall inflation moved persistently lower, averaging less than 4 percent from 1983 to 1990. Inflation came down further following the 1990-91 recession and subsequent slow recovery and then averaged about 2 percent for many years. Since the recession ended in 2009, however, the United States has experienced inflation running appreciably below the FOMC’s 2 percent objective, in part reflecting the gradual pace of the subsequent economic recovery.Examining the behavior of inflation’s estimated long-term trend reveals another important change in inflation dynamics. With the caveat that these results are based on a specific implementation of a particular statistical model, they imply that since the mid-1990s there have been no persistent movements in this predicted long-run inflation rate, which has remained very close to 2 percent. Remarkably, this stability is estimated to have continued during and after the recent severe recession, which saw the unemployment rate rise to levels comparable to those seen during the 1981-82 downturn, when the trend did shift down markedly.4 As I will discuss, the stability of this trend appears linked to a change in the behavior of long-run inflation expectations--measures of which appear to be much better anchored today than in the past, likely reflecting an improvement in the conduct of monetary policy. In any event, this empirical analysis implies that, over the past 20 years, inflation has been much more predictable over the longer term than it was back in the 1970s because the trend rate to which inflation was predicted to return no longer moved around appreciably. That said, inflation still varied considerably from year to year in response to various shocks.As figure 2 highlights, the United States has experienced very low inflation on average since the financial crisis, in part reflecting persistent economic weakness that has proven difficult to fully counter with monetary policy. Overall inflation (shown as the dashed red line) has averaged only about 1-1/2 percent per year since 2008 and is currently close to zero. This result is not merely a product of falling energy prices, as core inflation (the solid black line) has also been low on average over this period. Inflation CostsIn 2012 the FOMC adopted, for the first time, an explicit longer-run inflation objective of 2 percent as measured by the PCE price index.5 (Other central banks,4 Trend inflation estimates from univariate statistical models manifest somewhat less stability in recent years; see Clark and Bednar (2015).5 In contrast, the FOMC has determined that a number of considerations preclude it from setting a fixed numerical target for the other leg of its dual mandate, maximum employment. As discussed in itsincluding the European Central Bank and the Bank of England, also have a 2 percent inflation target.) This decision reflected the FOMC’s judgment that inflation that persistently deviates--up or down--from a fixed low level can be costly in a number of ways. Persistent high inflation induces households and firms to spend time and effort trying to minimize their cash holdings and forces businesses to adjust prices more frequently than would otherwise be necessary. More importantly, high inflation also tends to raise the after-tax cost of capital, thereby discouraging business investment. These adverse effects occur because capital depreciation allowances and other aspects of our tax system are only partially indexed for inflation.6Persistently high inflation, if unanticipated, can be especially costly for households that rely on pensions, annuities, and long-term bonds to provide a significant portion of their retirement income. Because the income provided by these assets is typically fixed in nominal terms, its real purchasing power may decline surprisingly quickly if inflation turns out to be consistently higher than originally anticipated, with potentially serious consequences for retirees’ standard of living as they age.7Statement on Longer-Run Goals and Monetary Policy Strategy (see note 1), the maximum level of employment is something that is largely determined by nonmonetary factors that affect the structure and dynamics of the labor market. Moreover, the maximum level of employment, the longer-run “natural” rate of unemployment, and other related aspects of the labor market are not directly observable, can change over time, and can only be estimated imprecisely. As a result, views vary about what labor market conditions would be consistent with a normal level of resource utilization.6 For a general survey of the costs of high inflation, see Briault (1995). English (1999) discusses costs associated with an increased need for cash management. For a discussion of costs that arise through interactions of inflation with the tax system, see Feldstein (1997, 1999) and Cohen and others (1999). Finally, high inflation may adversely affect the economy’s allocation of resources by increasing the magnitude of misalignments in relative prices that result because firms do not continually adjust all of their prices; for a discussion of such costs in the context of the new-Keynesian model of inflation, see Ascari and Sbordone (2014).7 More broadly, if inflation evolves in an unpredictable manner over many years, then even financially sophisticated households and firms may not be able to avoid significant forecasting errors with their attendant costs. Such costs can arise in a wide variety of situations; for instance, any firm, union, or other entity that engages in a multiyear nominal contract may be adversely affected by unexpected increases or decreases in inflation, although those on the other side of the contract might benefit.An unexpected rise in inflation also tends to reduce the real purchasing power of labor income for a time because nominal wages and salaries are generally slow to adjust to movements in the overall level of prices. Survey data suggest that this effect is probably the number one reason why people dislike inflation so much.8 In the longer run, however, real wages--that is, wages adjusted for inflation--appear to be largely independent of the average rate of inflation and instead are primarily determined by productivity, global competition, and other nonmonetary factors. In support of this view, figure 3 shows that nominal wage growth tends to broadly track price inflation over long periods of time.Inflation that is persistently very low can also be costly, and it is such costs that have been particularly relevant to monetary policymakers in recent years. The most important cost is that very low inflation constrains a central bank’s ability to combat recessions. Normally, the FOMC fights economic downturns by reducing the nominal federal funds rate, the rate charged by banks to lend to each other overnight. These reductions, current and expected, stimulate spending and hiring by lowering longer-term real interest rates--that is, nominal rates adjusted for inflation--and improving financial conditions more broadly. But the federal funds rate and other nominal interest rates cannot go much below zero, since holding cash is always an alternative to investing in securities.9 Thus, the lowest the FOMC can feasibly push the real federal funds rate is essentially the negative value of the inflation rate. As a result, the Federal Reserve has8 For more on this survey, see Shiller (1997).9 Because of the inconvenience of storing and protecting very large quantities of currency, some firms are willing to pay a premium to hold short-term government securities or bank deposits instead. As a result, several foreign central banks have found it possible to push nominal short-term interest rates somewhat below zero.less room to ease monetary policy when inflation is very low. This limitation is a potentially serious problem because severe downturns such as the Great Recession may require pushing real interest rates far below zero for an extended period to restore full employment at a satisfactory pace.10 For this reason, pursuing too low an inflation objective or otherwise tolerating persistently very low inflation would be inconsistent with the other leg of the FOMC’s mandate, to promote maximum employment.11 An unexpected decline in inflation that is sizable and persistent can also be costly because it increases the debt burdens of borrowers. Consider homeowners who take out a conventional fixed-rate mortgage, with the expectation that inflation will remain close to 2 percent and their nominal incomes will rise about 4 percent per year. If the economy were instead to experience chronic mild deflation accompanied by flat or declining nominal incomes, then after a few years the homeowners might find it noticeably more difficult to cover their monthly mortgage payments than they had originally anticipated. Moreover, if house prices fall in line with consumer prices rather than rising as expected, then the equity in their home will be lower than they had anticipated. This situation, which is sometimes referred to as “debt deflation,” would also confront all households with outstanding student loans, auto loans, or credit card debt, as well as businesses that10 For example, Curdia and others (2014) estimate that stabilizing the economy during the last recession would have required lowering the real federal funds rate to negative 10 percent for a time; by comparison, the average value of the real federal funds has been only negative 1-1/4 percent since early 2009. Of course, the FOMC was able to use other policy tools, such as large-scale asset purchases, to put additional downward pressure on long-term interest rates after the nominal funds rate was cut to near zero; however, those policies had potential costs and risks that made them an imperfect substitute for traditional interest rate policy. See Krugman (1998), Reifschneider and Williams (2000), and Eggertsson and Woodford (2003) for discussions of the effects that low inflation and the zero lower bound on nominal interest rates have on a central bank’s ability to stimulate the economy during economic downturns. In addition, see English, Lopez-Salido, and Tetlow (2015) and Engen, Laubach, and Reifschneider (2015) for model-based analyses of the effectiveness of the Federal Reserve’s large-scale asset purchases and forward guidance in mitigating the effects of the zero lower bound. Finally, for a discussion of the costs and benefits of employing large scale asset purchases, see Bernanke (2012) and Yellen (2013).11 For a further discussion of this point, see Mishkin (2007).had taken out bank loans or issued bonds.12 Of course, in this situation, lenders would be receiving more real income. But the net effect on the economy is likely to be negative, in large part because borrowers typically have only a limited ability to absorb losses. And if the increased debt-service burdens and declines in collateral values are severe enough to force borrowers into bankruptcy, then the resultant hardship imposed on families, small business owners, and laid-off workers may be very severe.13Monetary Policy Actions since the Financial CrisisAs I noted earlier, after weighing the costs associated with various rates of inflation, the FOMC decided that 2 percent inflation is an appropriate operational definition of its longer-run price objective.14 In the wake of the 2008 financial crisis,12 See Fisher (1933) for an early discussion of debt deflation and its effects on the economy.13 Very low inflation also can result in chronically higher unemployment by closing off an important way in which the labor market can respond to adverse shocks. In sectors where productivity is lagging or demand is slowing, declines in real wages might be necessary to avoid even worse outcomes, such as layoffs. For various reasons, however, employers often try to avoid nominal wage cuts. (Bewley (1999) suggests a number of reasons that firms find cutting nominal wages difficult, including the effect that such cuts have on employee morale. Inflation is therefore often said to “grease the wheels of the labor market” because it permits these required adjustments in real wages to occur through a combination of unchanged nominal wages and rising prices.) But when inflation falls to a very low level, this passive approach to wage reductions may no longer be viable for many firms, causing relatively more of the burden of adjustment to fall on employment.14 Blanchard, Dell’Ariccia and Mauro (2010), among others, have recently suggested that central banks should consider raising their inflation targets, on the grounds that conditions since the financial crisis have demonstrated that monetary policy is more constrained by the effective lower bound (ELB) on nominal interest rates than was originally estimated. Ball (2013), for example, has proposed 4 percent as a more appropriate target for the FOMC. While it is certainly true that earlier analyses of ELB costs significantly underestimated the likelihood of severe recessions and slow recoveries of the sort recently experienced in the United States and elsewhere (see Chung and others, 2012), it is also the case that these analyses did not take into account central banks’ ability to use large-scale asset purchases and other unconventional tools to mitigate the costs arising from the ELB constraint. In addition, it is not obvious that a modestly higher target rate of inflation would have greatly increased the Federal Reserve’s ability to support real activity in the special conditions that prevailed in the wake of the financial crisis, when some of the channels through which lower interest rates stimulate aggregate spending, such as housing construction, were probably attenuated. Beyond these tactical considerations, however, changing the FOMC’s long-run inflation objective would risk calling into question the FOMC’s commitment to stabilizing inflation at any level because it might lead people to suspect that the target could be changed opportunistically in the future. If so, then the key benefits of stable inflation expectations discussed below--an increased ability of monetary policy to fight economic downturns without sacrificing price stability--might be lost. Moreover, if the purpose of a higher inflation target is to increase the ability of central banks to deal with the severe recessions that follow financial crises, then a better strategic approach might be to rely on more vigorous supervisory and macroprudential policies to reduce the likelihood of such events. Finally, targetinghowever, achieving both this objective and full employment (the other leg of the Federal Reserve’s dual mandate) has been difficult, as shown in figure 4. Initially, the unemployment rate (the solid black line) soared and inflation (the dashed red line) fell sharply. Moreover, after the recession officially ended in 2009, the subsequent recovery was significantly slowed by a variety of persistent headwinds, including households with underwater mortgages and high debt burdens, reduced access to credit for many potential borrowers, constrained spending by state and local governments, and weakened foreign growth prospects. In an effort to return employment and inflation to levels consistent with the Federal Reserve’s dual mandate, the FOMC took a variety of unprecedented actions to help lower longer-term interest rates, including reducing the federal funds rate (the dotted black line) to near zero, communicating to the public that short-term interest rates would likely stay exceptionally low for some time, and buying large quantities of longer-term Treasury debt and agency-issued mortgage-backed securities.15 These actions contributed to highly accommodative financial conditions, thereby helping to bring about a considerable improvement in labor market conditions over time. The unemployment rate, which peaked at 10 percent in 2009, is now 5.1 percent, slightly above the median of FOMC participants’ current estimates of its longer-run normal level. Although other indicators suggest that the unemployment rate currently understates how much slack remains in the labor market, on balance the economy is no longer far awayinflation in the vicinity of 4 percent or higher would stretch the meaning of “stable prices” in the Federal Reserve Act.15 For a more complete listing of the Federal Reserve’s policy actions in recent years, see “The Federal Reserve’s Response to the Financial Crisis and Action to Foster Maximum Employment and Price Stability,” a webpage available on the Board’s website at/monetarypolicy/bst_crisisresponse.htm. Also see Engen, Laubach, and Reifschneider (2015) for an analysis of the combined macroeconomic effects of the FOMC’s asset purchases and guidance concerning the future path of the federal funds rate.from full employment. In contrast, inflation has continued to run below the Committee’s objective over the past several years, and over the past 12 months it has been essentially zero. Nevertheless, the Committee expects that inflation will gradually return to2 percent over the next two or three years. I will now turn to the determinants of inflation and the factors that underlie this expectation.Inflation DynamicsModels used to describe and predict inflation commonly distinguish between changes in food and energy prices--which enter into total inflation--and movements in the prices of other goods and services--that is, core inflation. This decomposition is useful because food and energy prices can be extremely volatile, with fluctuations that often depend on factors that are beyond the influence of monetary policy, such as technological or political developments (in the case of energy prices) or weather or disease (in the case of food prices). As a result, core inflation usually provides a better indicator than total inflation of where total inflation is headed in the medium term.16 Of course, food and energy account for a significant portion of household budgets, so the Federal Reserve’s inflation objective is defined in terms of the overall change in consumer prices.What, then, determines core inflation? Recalling figure 1, core inflation tends to fluctuate around a longer-term trend that now is essentially stable. Let me first focus on these fluctuations before turning to the trend. Economic theory suggests, and empirical analysis confirms, that such deviations of inflation from trend depend partly on the16 Several other approaches are commonly used to abstract from the short-term volatility of overall inflation and thereby better discern its medium-term direction. For example, one procedure removes the components of the total PCE price index with the largest or smallest price changes before computing the average price change, yielding the “trimmed mean” PCE index; another uses the median price change in a given period, rather than the mean change, to represent the overall inflation rate. In practice, simply using core inflation does about as well in predicting overall inflation over the coming year and beyond as these alternative procedures (see Detmeister, 2011, 2012).intensity of resource utilization in the economy--as approximated, for example, by the gap between the actual unemployment rate and its so-called natural rate, or by the shortfall of actual gross domestic product (GDP) from potential output. This relationship--which likely reflects, among other things, a tendency for firms’ costs to rise as utilization rates increase--represents an important channel through which monetary policy influences inflation over the medium term, although in practice the influence is modest and gradual. Movements in certain types of input costs, particularly changes in the price of imported goods, also can cause core inflation to deviate noticeably from its trend, sometimes by a marked amount from year to year.17 Finally, a nontrivial fraction of the quarter-to-quarter, and even the year-to-year, variability of inflation is attributable to idiosyncratic and often unpredictable shocks.18What about the determinants of inflation’s longer-term trend? Here, it is instructive to compare the purely statistical estimate of the trend rate of future inflation shown earlier in figure 1 with survey measures of people’s actual expectations of long-run inflation, as is done in figure 5. Theory suggests that inflation expectations--which presumably are linked to the central bank’s inflation goal--should play an important role in actual price setting.19 Indeed, the contours of these series are strikingly similar, which17 Another input cost that can affect core inflation is the price of energy; in recent decades, however, the pass-through of energy price changes to core inflation appears much smaller than in previous periods (see Hooker, 2002; Clark and Terry, 2010).18 Some of these idiosyncratic shocks are related to identifiable factors, such as changes in Medicare reimbursement rates or movements in the (imputed) price of holding a checking account. (Both of these factors are included in the services component of the PCE price index, but not the consumer price index (CPI).) However, not all idiosyncratic shocks can be reliably traced to specific factors, as a significant fraction represents unpredictable “noise.”19 Most theoretical versions of the Phillips curve suggest that inflation should depend on short-run inflation expectations, but, as an empirical matter, measures of long-run expectations appear to explain the data better.suggests that the estimated trend in inflation is in fact related to households’ and firms’ long-run inflation expectations.20To summarize, this analysis suggests that economic slack, changes in imported goods prices, and idiosyncratic shocks all cause core inflation to deviate from a longer-term trend that is ultimately determined by long-run inflation expectations. As some will recognize, this model of core inflation is a variant of a theoretical model that is commonly referred to as an expectations-augmented Phillips curve.21 Total inflation in turn reflects movements in core inflation, combined with changes in the prices of food and energy.An important feature of this model of inflation dynamics is that the overall effect that variations in resource utilization, import prices, and other factors will have on inflation depends crucially on whether these influences also affect long-run inflation expectations. Figure 6 illustrates this point with a stylized example of the inflation consequences of a gradual increase in the level of import prices--perhaps occurring in response to stronger real activity abroad or a fall in the exchange value of the dollar--that causes the rate of change of import prices to be elevated for a time.22 First, consider the20 See Clark and Davig (2008); see also Faust and Wright (2013), who make a related point in the context of inflation forecasting. Note that the question about expected inflation in the University of Michigan Surveys of Consumers is not phrased in terms of a specific measure of prices, so its level--as opposed to its contour--cannot be directly compared with a particular measure of inflation such as the change in the PCE price index.21 See Tobin (1972) and Friedman (1968) for early discussions of the theory underpinning the expectations-augmented Phillips curve. Theoretical descriptions of the inflation process remain an active area of research in economics. In recent years, many economic theorists have used a so-called new-Keynesian framework--in which optimizing agents are assumed to face constraints on price or wage setting in the form of adjustment costs or explicit nominal contracts--to model inflation dynamics (see Woodford, 2003, chapter 3, for a textbook treatment). Although these new-Keynesian inflation models can differ importantly in their specifics, they all tend to assign a central role to inflation expectations and resource utilization as drivers of inflation dynamics.22 In this exercise, we ignore any inflation effects that might arise because of shifts in resource utilization induced by the change in import prices, which are expressed relative to core prices.。