雅思流程图八大范文
雅思小作文范文-流程图
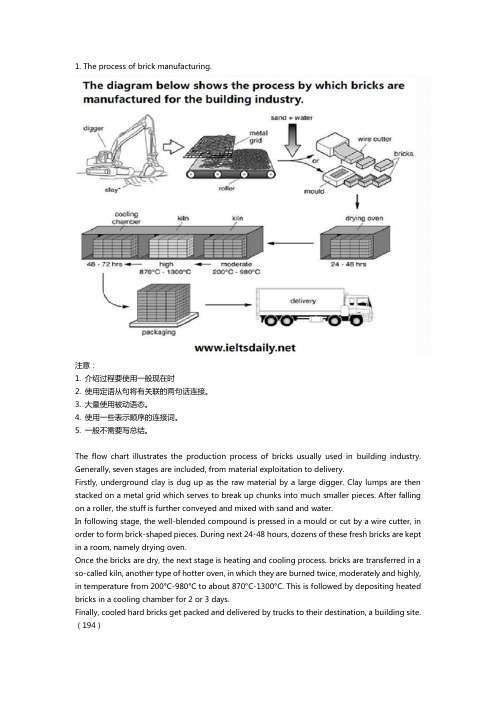
1. The process of brick manufacturing.注意:1. 介绍过程要使用一般现在时2. 使用定语从句将有关联的两句话连接。
3. 大量使用被动语态。
4. 使用一些表示顺序的连接词。
5. 一般不需要写总结。
The flow chart illustrates the production process of bricks usually used in building industry. Generally, seven stages are included, from material exploitation to delivery.Firstly, underground clay is dug up as the raw material by a large digger. Clay lumps are then stacked on a metal grid which serves to break up chunks into much smaller pieces. After falling on a roller, the stuff is further conveyed and mixed with sand and water.In following stage, the well-blended compound is pressed in a mould or cut by a wire cutter, in order to form brick-shaped pieces. During next 24-48 hours, dozens of these fresh bricks are kept in a room, namely drying oven.Once the bricks are dry, the next stage is heating and cooling process. bricks are transferred in a so-called kiln, another type of hotter oven, in which they are burned twice, moderately and highly, in temperature from 200°C-980°C to about 870°C-1300°C. This is followed by depositing heated bricks in a cooling chamber for 2 or 3 days.Finally, cooled hard bricks get packed and delivered by trucks to their destination, a building site.(194)2. The production of steam using a gas cooled nuclear reactor.1. 看懂基本过程和原理,定位流程的起点和终点。
雅思小作文流程图类题目范文及解析

雅思小作文流程图类题目范文及解析雅思小作文流程图类题目范文及解析,一起来学习一下吧,下面我就和大家共享,来观赏一下吧。
雅思小作文流程图类题目范文及解析雅思小作文流程图类题目范文及解析为大家带来雅思小作文当中一类较有难度的图表——流程图类的小作文的范文以及解析。
流程图顾名思义就是对某一有时间和步骤先后挨次的行为进行步骤的拆解,并配上相应的文字和解说而生成的图表。
我们在处理流程图类图表作文是应当怎么写,请看下文。
上图来自网络主题:家居设计题型:流程图The diagrams below show some principles of house design for cool and for warm climates.满分范文:The diagrams show how house designs differ according to climate.这些图表显示房子的设计因气候而不同。
The most noticeable difference between houses designed for cool and warm climates is in the shape of the roof. The designs also differ with regard to the windows and the use of insulation.为凉快和暖和气候设计的房子之间最明显的区分是屋顶的外形。
在窗户和保温材料的使用方面,设计也有所不同。
We can see that the cool climate house has a high-angled roof, which allows sunlight to enter through the window. By contrast, the roof of the warm climate house has a peak in the middle and roof overhangs to shade the windows. Insulation and thermal building materials are used in cool climates to reduce heat loss, whereas insulation and reflective materials are used to keep the heat out in warm climates.我们可以看到凉快的气候房子有一个高角度的屋顶,它允许阳光通过窗户进入。
雅思考试流程图作业
• 【流程图特点之二:大量使用定语从句,将有关联的两句 话连接,并少量结合其它从句。】
• 【流程图特点之三:大量使用被动语态,表客观性。】
beans fermented
• Firstly,when the pods are ripe, they are harvested, the beans are removed and they are fermented for several days in large wooden boxes. During the fermenting process, the beans turn brown.
Write at least 150 words.
【高分范文及深度点评】
• The diagram shows the stages in the process of making chocolate.
(The ten pictures demonstrates/ illustrates / exhibits / depicts / describes / gives information about the different stages of making liquid chocolate.)
Once SV…, SV… SV…once SV…
Once the cows have been milked, they are then returned to the field. The cows are returned to the field once they have been milked.
When SV…, SV… SV…when SV…
雅思流程图小作文
雅思流程图小作文The given diagram illustrates the process of how chocolate is produced, from the cacao bean to the final chocolate bar. Overall, it can be seen that there are several stages involved in the production of chocolate.To begin with, the process starts with the harvesting of cacao beans. These beans are then transported to the factory, where they undergo a thorough inspection to ensure that they are of high quality. Once the beans have been approved, they are then roasted at a high temperature to bring out the rich flavor of the cacao.Following this, the roasted beans are then cracked open to reveal the cacao nibs inside. These nibs are then ground into a thick, smooth paste known as chocolate liquor. It is important to note that this chocolate liquor contains both cocoa solids and cocoa butter.Next, the chocolate liquor is further processed toseparate the cocoa solids from the cocoa butter. This is achieved through a pressing process, which results in the creation of two separate products: cocoa powder and cocoa butter. The cocoa powder is then used in the production of various chocolate products, while the cocoa butter is utilized in the creation of chocolate bars and other confectionery items.Finally, the cocoa powder and cocoa butter are combined in precise proportions to create the desired type of chocolate. The mixture is then heated and stirred to ensure that the ingredients are thoroughly blended. Once the chocolate has reached the desired consistency, it is poured into molds and allowed to cool and solidify.In conclusion, the production of chocolate is a complex process that involves several stages, from the harvesting of cacao beans to the creation of the final chocolate bar. Each stage plays a crucial role in ensuring that the chocolate produced is of the highest quality. Overall, the process of chocolate production is a fascinating and intricate one that requires precision and expertise.。
雅思小作文流程图范文

雅思小作文流程图范文以下是一篇关于流程图的雅思小作文范文,字数为700字:The flowchart illustrates the process of making instant noodles. It is evident that there are six main steps in this process.To begin with, the production starts with the mixing of flour, water, and other necessary ingredients. After that, the dough is kneaded into a flat sheet, and then it is rolled by a machine until it is thin enough to be cut into noodles. In the next step, the noodles are steamed to remove any remaining moisture and make them more flexible.The noodles are then divided into small portions, and they are stretched with the help of machine-made negative pressure. Subsequently, these noodles are put into a boiling pot for a few minutes until they are cooked and ready to eat. Finally, they are quickly dried to extend their shelf life, and then they are packed in plastic packets and delivered to customers.Overall, the process of making instant noodles is quite simple. It involves mixing the ingredients, kneading and cutting the dough, steaming, stretching, boiling, drying, and packaging the noodles.In conclusion, the flowchart clearly demonstrates the process of making instant noodles. It can be seen that there are six main steps involved, from mixing the ingredients to packaging the final product.。
英语雅思流程图范文

英语雅思流程图范文Title: The Production Process of a Mobile Phone.The diagram illustrates the production process of a mobile phone, which begins with the concept stage and ends with the final assembly and testing. This entire processcan be divided into several key stages, each with its ownset of steps.The first stage is Research and Development (R&D),where the concept of the phone is born. Engineers and designers work together to create a prototype based on market research and consumer demand. This prototype is then tested for functionality, durability, and user-friendliness. Once the prototype meets the required standards, it moveson to the next stage.The second stage is Component Manufacturing. Here, various components such as the screen, battery, camera, and chipset are produced. Each component goes through its ownproduction process, which involves raw material procurement, processing, and quality control. For example, the screen is manufactured using special glass and coated with various layers to enhance visibility and touch sensitivity. The chipset, which is the brain of the phone, is produced using advanced semiconductor technology.The third stage is Assembly. In this stage, all the components are brought together and assembled into a complete phone. This process is highly automated and precise, as each component needs to be placed in the exact right position. The assembly line is equipped with robots and sensors to ensure accuracy and efficiency.Once the phone is assembled, it moves on to the next stage, which is Testing. Here, the phones are put through a series of rigorous tests to ensure they meet the required standards. These tests include functional testing,durability testing, and compatibility testing. Only phones that pass all the tests are considered ready for sale.The final stage is Packaging and Shipping. In thisstage, the phones are packaged in boxes or protectivecovers and shipped to distribution centers around the world. The packaging is designed to protect the phones duringtransit and ensure they arrive in perfect condition.Throughout the entire production process, qualitycontrol is a constant factor. At each stage, quality inspectors check the products to ensure they meet the required standards. This ensures that only the best quality phones reach the consumer.In conclusion, the production of a mobile phone is a complex process that involves multiple stages and steps. It requires meticulous planning and execution to ensure that each phone is produced to the highest standards. Thediagram illustrates this process clearly, showing the flow from concept to final product.。
雅思小作文-流程图
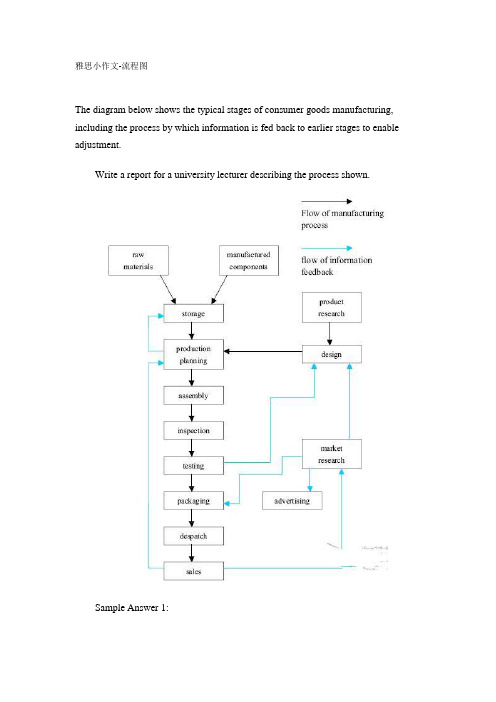
雅思小作文-流程图The diagram below shows the typical stages of consumer goods manufacturing, including the process by which information is fed back to earlier stages to enable adjustment.Write a report for a university lecturer describing the process shown.Sample Answer 1:The given diagram shows the stages of manufacturing and process adjustment of the consumer goods. As is observed from the flow chart, the goods manufacturing is a complex process which is done in several stages and information is sometimes fed back to earlier stages to make some adjustments.Firstly, raw materials and other components are stored together and production planning is done. There are two major process involves in the overall manufacturing process: one is manufacturing process itself and another one is the information feedback process with which the adjustment of the manufacturing is done. After the product research, the design part is done and this input is used in product planning stage. After the production planning is complete the assembly, inspection, testing and packaging stages are done sequentially. Feedback from testing phase is used in design stage and which led back to product planning stage. Again, the market research affects the design and advertising stages and inputs from the market research stage is used in packaging stage. The final two stages are dispatch and sales. The information flow stages gives feedback to other stages to refine and adjust the process.In summary, the consumer goods manufacturing process involves both themulti-staged manufacturing and research methods. The manufacturing stages involve the storage, assembly, inspection, packing to the sales methods whereas the research stages include market & product research, design and advertisement.(Approximately 231 words)Sample Answer 2:The given diagram shows the steps of consumer products manufacturing process, as is clearly show in the diagram that goods manufacturing is a complex process from collection of raw materials to the end product.As the process clearly shows the first stage of product development is collection and storage of raw materials and manufacturing components. The second stage is designing of the products and production planning and it’s a lengthy process which includes supervision and monitoring designing progress frequently, and before marketsurvey it is necessary to test the product to being aware the quality of the product. If the product is quality wise good then the next stage is packing of the products and make advertise for sale. In this production and manufacturing process there are mainly two types of process: flow of manufacturing process and flow of information feedback.In summary, it is value chain development process that starts from collection of raw materials to the end or final product for sale, in each stage of this manufacturing process value is added to products.(Approximately 176 words)。
雅思小作文范文--装置图 流程图 表格

小作文流程图The given graph indicates the procedures of glass bottle recycle by three main stages.According to the table, various glass bottles are gathered in the collecting site and then transported to the cleaning station at the very beginning. Then it comes to the second stage where the bottles are washed by the high pressured water, after which they are categorized into Brown, Green as well as clear groups based on their color. After that, bottles are delivered to the recycling plant where the prepared bottles are burned in furnace with high temperature into liquid glass for recycle. Next, the recycled liquid glass along with new liquid glass is shaped into bottles again through glass moulds. Finally, the newly produced glass bottles are launched into the customer supermarket, till this point, the process of glass recycle is finished completely.In summary, it is obvious that stage 2 is the most crucial and complex one during the whole recycling process.装置图The given table reveals how the water collecting set functions to gather water in the wild.At the very beginning, in order to prepare the set, it is necessary to find a hole on the ground which can receive sufficient sunshine and abound with plenty of green plants. Then a container used to collect water is placed in the center of the hole, and the hole is covered by a plastic sheet, fixed by stones on the edge. However, it is recommended to place a suitable stone in the middle of the sheet to ensure its lower position exactly above the water container.When the sun shines above the green plants, plants will generate water vapor owing to the photosynthesis, and the water vapor is condensed into water drops on the plastic sheet. Under the effect of gravity, the water drops increasingly gather in the lower point and fall into the container placed under the plastic sheet.组合图-C6T1The curve graph reveals the international water consumption during the entire 20th century, and water usage in Brazil as well as Congo in 2000 is illustrated in the second chart.According to the line chart, the global water used in agriculture(500 km³) considerably outweighed that in industry (50 km³) and household(20 km³) section were, and they lead a similarly slight increase in the first 50 years. However, since 1950, the agricultural water consumption witnessed a constantly dramatic rise, reaching the peak at exactly 3000 km³in 2000. On the other hand, industrial and domestic water usage rose moderately in the second half century, peaking at around 1300 and 400 km³respectively. In the second chart, we can clearly find that the water use of each person(359 m³) of Brazil in 2000, which possessed 176 million inhabitants and 26,500㎡irrigating lands, intensively surpassed that of Congo (8 m³), with only 5.2 million dwellers and 100㎡irrigating lands.In summary, the water worldwide was mainly consumed by agriculture field during the given 100 years, and Brazil’s average individual substantially overweighed that of Congo in 2000.柱状图-C7T3A glance at this bar chart reveals the changing average prices of house in five cities (New York, Madrid, Tokyo, Frankfurt and London)between 1990 and 2002 in comparison of that in 1989.According to the graph, during the first stage, from 1990 to 1995, the average house prices of New York, Tokyo and London suffered a dramatic fall compared with that 1989, with the percentage decreasing more than 5%. On the other hand, the housing prices in Madrid and Frankfurt experienced a slight increase less than 3%.Between 1996 and 2002, the average house prices of London and New York rose dramatically, especially London with a 12% increase which represented the largest ascent. Madrid and Frankfurt witnessed a slight increase (4% and 2% respectively). Oppositely, the house price in Tokyo still decreased (exactly 5%), even though it recovered a little than the first stage (8%).In conclusion, the average house prices in the given cities from 1990 to 2002 all increased correspondingly except Tokyo compared with 1989.The line curve illustrates the changes of fish and meat consumption in a European country during the year 1979 to 2004.装置图As can be seen from the chart, the consumption of beef stood the largest in 1979 with the data of around 220 grams for each person every week. However, after a fluctuation between 1979 and 1988, it dropped dramatically to the bottom at approximately 100 grams in 2004. Similarly, the lamb also declined constantly in the same period, ending up with about 60 grams in 2004. However, the figure of chicken experienced a significant rise from 140 grams in 1979 to over 250 grams in around 2002, which leveled off to exactly 250 grams in the end. As to the fish consumption, the figure maintained a long-term slight decrease tendency in the whole stage, remaining the least popular food option among the four.In conclusion, the chicken consumption witnessed a staggering increasing whilst other meats decreased to a certain degree in the given period.表格图-C5T4The graph describes data about the subway systems in London, Paris, Tokyo, Washington DC, Kyoto and Los Angeles.According to the table, London railway possesses the longest history among the six cities, which was opened in 19th century (1863), while that of Los Angeles was opened in the 21st century (2001), also the latest one. The other four underground systems were all built in 20 century. In terms of kilometers of route, London subway holds the first place with the length of 394km. The length of subway in Paris, Tokyo as well as Washington DC is between 100 and 200 kilometers. However, that of Kyoto and Los Angeles isbelow 100 kilometers, with Kyoto theshortest (only 11 kilometers). When it comes to the annual passenger transporting capability, Tokyo and Parisexceeds 1000 million, especially Tokyo the largest (1927 million), while Los Angeles and Kyoto transport fewer than 100 million per year, 50 and 45 million respectively. The number of the rest two cities lies between 100 and 1000 million.In conclusion, London railway ranks the first in terms of opening date and route length whereas Kyoto the least in route length as well as annual passenger transporting.。
- 1、下载文档前请自行甄别文档内容的完整性,平台不提供额外的编辑、内容补充、找答案等附加服务。
- 2、"仅部分预览"的文档,不可在线预览部分如存在完整性等问题,可反馈申请退款(可完整预览的文档不适用该条件!)。
- 3、如文档侵犯您的权益,请联系客服反馈,我们会尽快为您处理(人工客服工作时间:9:00-18:30)。
雅思流程图八大范文1.《蚕丝制作》Sample:As is displayed in the first diagram, the life cycle of the silkworm can be categorized into 4 main stages. First, the life of the silkworm starts from eggs propagated by the moth, and it takes 10 days for each egg to become a silkworm larva that feeds on mulberry leaves. Silkworm larva continues to grow in 4 to 6 weeks, then wrapping itself with silk thread to construct a cocoon in the next 3 to 8 weeks. A moth can be produced from the cocoon in 16 days. The life cycle begins again from then on.Focusing on the second diagram, it illustrates the 5 main steps of the procedure of producing silk cloth. Well generated cocoons will be selected firstly. Before the silk thread can be unwound, cocoons have to be boiled in hot water. One cocoon can produce approximately 300 to 900 metres of silk thread. The unwound thread will be dyed afterwards to be weaved into silk cloth.Overall, the two diagrams reveal the stage of producing cocoons in the life cycle of the silkworm can be used to make silk cloth through 5 simple steps.Cambridge IELTS 6 Version:The first diagram shows that there are four main stages in the life of the silk worm.First of all, eggs are produced by the moth and it takes ten days for each egg to become a silkworm larva that feeds on mulberry leaves. This stage lasts for up to six weeks until the larva produces a cocoon of silk thread around itself. After a period of about three weeks, the adult moths eventually emerge from these cocoons and the life cycle begins again.The cocoons are the raw material used for the production of silk cloth. Once selected, they are boiled in water and the threads can be separated in the unwinding stage. Each thread is between 300 and 900 metres long, whichmeans they can be twisted together, dyed and then used to produce cloth in the weaving stage.Overall, the diagrams show that the cocoon stage of the silkworm can be used to produce silk cloth through a very simple process.2. 《户外取水》The chart describes how water is obtained outdoors.According to the figure, the first step of obtaining water outdoors is to find a hole with green plants on its bottom. Next, remove the green plants in the middle and put a container there. Then, cover the hole with a plastic sheet and place two stones on both ends of it to secure its position. A third stone is laid on the middle of the plastic sheet so that the middle part is also the lowest part.When the sun shines on the green plants in the hole, water evaporates from these plants. The vapor rises up and then cools down to form water drops on the plastic sheet. When there is more and more water, it flows along the sheet to accumulate on the lowest part. Finally, water falls down into the container directly under the middle stone.Thus, water is collected successfully through evaporation from green plants.3.《房屋不同季节的构造》As is displayed in the flow chart, the principles of insulation in cool and warm climate respectively differ to a large extent.As to the situation of cool climate, we adopt the high-angled roof in order to be nearly parallel with the direction of the sun so that the direct exposition to the heat of sun is lessened as much as we can. By this, the temperature of the material won’t fluctuate within a large range. Meanwhile, thermal building material could enhance the heat storage insulation, preventing outflow, thus reduction of heat.Adversely, in warm climate, reflective building material is indispensable with overhands for shade. The direction of the roof is almost vertical to the direction of the sun to lead to external insulation reflection. By this, ventilation would result in the removal of heat storage rather than reduction.Through the different working principles of ventilation, we are fascinated by the masterpieces of modern science and technology.4.《超市建造地点选择》As is unfolded in the map, Place M and N have their unique pros and cons as to the place for building the supermarket.First of all, Place N is located in the urban area of the G town, which may have more population and business. This advantage is incomparable with Place M. What’s more, Main road runs across the center area with convenience in traffic and logistics for the market afterwards. However, the place is equally far away from the neighborhood and the suburb area and cannot attract the residents in the outskirts.As a double-edged sword, Place M is more specifically customer-oriented. In spite of its comparably remote location with Place N, it would attract more customers in the outskirts, for they are reluctant to make a long trip for shopping. On the other hand, the train line nearby will also bring convenience in traffic to the urban-dwellers. Situated to the north-west of Place N, Place M is near the A and B Town with total population of 23 million, far outnumbering the overall population of D and E town, with 12 million.What’s worthy of being mentioned is that fierce competition in Place N and probable monopoly in Place M should also be taken into account when building the supermarket.5.《玻璃的再生》As is displayed in the flow chart, the recycling process of glass is really a complex one.The overall process can be categorized into 3 stages. First, glass products in various forms are gathered in the Collection point, so that they are easily transported by special trucks or vans to the Cleaning plant, where they get sterilization by high-pressured water. There are three different channels in the Recycling plant, namely Brown, Green and Clear, which represent the colors of glass. After recycled in the furnace, glass products are melted into recycled liquid glass. Mixed with new liquid glass, the compound is finally moulded into solid glass, which, afterwards, will be sent to various customer supermarkets for selling. Thus, the glass will go to the customers for different purposes.Through a brief introduction of the circle of glass recycling, we come to realize that recycling plays a vital role in environmental protection and ecological preservation.6.《化肥的制作》As is shown in the flow chart, the process of recycling organic waste to produce compost is really a complex one.The whole process can be categorized into five stages. First of all, prepare a plastic container which has four holes for ventilating the air. There is a rule when putting waste into the container, food at the bottom within 15 centimeters high, grass at the middle and newspaper at the top within 15 centimeters high altogether, in order to make a optimum environment for different bacteria reproducing. In the following stage, we can witness nitrogen and water being put into the container. What's worth mentioning is that water is only added in a hot weather. Next, heat the waste and let the bacteria reproduce fastly, with which the organic waste can be decomposed and became garden fertiliser after 6 months. Subsequently, we can carry the compost out and move it to the garden, thus a new recycling can begin.In conclusion, using this way to turn the organic waste into garden fertiliser is environmentally friendly. By enlarging the number or volume of the container, we can dispose more waste at the same time.7.《美国黄石公园植被恢复》(暂无范文)8.《咖啡的制作》The diagram shows the stages in the process of making chocolate.Chocolate comes from the cacao tree, which is grown in parts of South America, Africa and Indonesia. The tree produces large red pods which contain white cocoa beans. Firstly, when the pods are ripe, they are harvested, the beans are removed and they are fermented for several days in large wooden boxes. During the fermenting process, the beans turn brown.Next, the brown beans are spread in the sun to dry. They are then put in large sacks and transported by train or lorry. After this, the beans are taken to a chocolate factory where they are roasted in an oven at temperatures of between 250 and 350 degree Celsius.After being roasted, the beans are crushed and the outer shell is removed. This part is not needed for making chocolate. Finally, the inner part of the bean is pressed and liquid chocolate is produced.9. 《砖块的制作》The process by which bricks are manufactured for the building industry can be outlined in seven consecutive steps. First the raw material, clay, whichwas just below the surface of soil in certain clay-rich areas has to be dug up by a digger.Then the lumps of clay are placed on a metal grid in order to break up the big chunks of clay into much smaller areas, which fall through the metal grid onto a roller, whose motion further segregates the bits of clay. Sand and water are added to make a homogenous mixture, which is then either formed in moulds or cut into brick-shaped pieces by means of a wire cutter.Those fresh bricks are then kept in a drying oven for at least 24 and a maximum of 48 hours, several dozens if not hundreds of bricks at a time. The dried bricks are then transferred to a so-called kiln, another type of high temperature oven. First they are kept at a moderate temperature of 200 ℃-1300 ℃ . This process is followed by cooling down the finished bricks for 48 to 72 hours in a cooling chamber.Once the bricks have cooled down and have become hard, they get packaged and delivered to their final destination, be it a building site or storage.。