Nanowire-Quantum Dot Hybridized Cell for Harvesting Sound and Solar Energies
石墨烯量子点简介
石墨烯量子点简介1、石墨烯量子点定义量子点(QuantumDot)是由有限数目的原子构成,属于准零维材料,即在三个维度上尺寸均呈现纳米级别。
外观恰似球形物或者类球形,其内部电子在各个方向的运动均会受到限制,因此量子限域效应非常明显。
石墨烯量子点(Graphene Quantum Dots)一般是横向尺寸在100nm以下,纵向尺寸可以在几个纳米以下,具有一层、两层或者几层的石墨烯结构,也就是特殊的非常小的石墨烯碎片。
它的特性来源于石墨烯以及碳点,表现出生物低毒性、优异的水溶性、化学惰性、稳定的光致发光、良好的表面修饰。
2、石墨烯量子点制备石墨烯量子点的合成可以看做是对碳纳米晶体合成方法的延伸和补充,仍旧分为:自上而下和自下而上的制备。
自上而下的方法是指通过物理或化学方法将大尺寸的石墨烯薄片切割成小尺寸的GQDs,包括水热法、电化学法和化学剥离碳纤维法等;自下而上的制备法则是指以小分子作前驱体通过一系列化学反应制备GQDs,主要是溶液化学法、超声波和微波法等。
3、石墨烯量子点发光机理荧光是种光致冷发光的现象,当某种常温物质经某种波长的入射光(通常是紫外线或x-ray)照射,吸收光能后进入激发态,且立即退激发并发出出射光,而荧光可在吸光激发后约10^-8秒内发光,其能量小于吸光的能量。
通常,若是把材料制成量子点大小,则电子容易受到激发而改变能阶,与电洞(空穴)结合后就会放出光。
石墨烯量子点由于边缘效应和量子尺寸效应,可表现出独特的光化学特质。
石墨烯除了具有碳量子点所具有的优点外,其荧光具有激发波长依赖性。
当激发波长从310nm 变成380nm时,荧光发射峰位置的相应从450nm移至510nm,光致发光强度迅速降低。
氧化石墨烯表现出宽谱的红光发射,取决于其含有的含氧官能团,而氧化石墨烯被还原之后由于含氧官能团减少以及结构的改变,主要呈现蓝光(第一性原理模拟推测其由碳空位缺陷引发)。
修饰类石墨烯具有相似的规律,发光光谱主要由两部分组成:蓝光发光峰位(不移动)、长波长发光(峰位移动),相对于没有经过修饰的石墨烯,其长波长发光显著增强。
introduction of quantum dot量子点技术介绍(附演讲稿)-半导体物理全英文展示

Introuction
Nanoscale crystals<=100nm Diameter of ≈10 to 50 atoms Contains 100 - 100,000 atoms
Introuction
Emission spectrum controlled by size Larger QDs emit longer wavelengths Smaller QDs emit shorter wavelengths
4. From our course, we know it’s nano scale size make quantum dots so special. The important point is Bohr diameter. These data is cited form our course slides. In this kind of single point, carriers are constrained strongly. So they have discrete, quantized energy levels, according to the laws of quantum theory. It is a bit like individual atoms, sometimes known as "artificial atoms."
Fluorescence mages for the detection of CEA
Conclusion
Nanocrystal Size controlling emission color Optical, biomedical research application
Quantum_Dot

定义量子点(quantum dot)是准零维(quasi-zero-dimensional)的纳米材料,由少量的原子所构成。
粗略地说,量子点三个维度的尺寸都在100纳米(nm)以下,外观恰似一极小的点状物,其内部电子在各方向上的运动都受到局限,所以量子局限效应(quantum confinement effect)特别显著。
研究历史现代量子点技术要追溯到上世纪70年代中期,它是为了解决全球能源危机而发展起来的。
通过光电化学研究,开发出半导体与液体之间的结合面,以利用纳米晶体颗粒优良的体表面积比来产生能量。
初期研究始于上世体80年代早期2个实验室的科学家:贝尔实验室的Louis E.Brus博士和前苏联Yoffe研究所的AlexanderEfros和A.I.Ekimov博士。
Brus博士与同事发现不同大小的硫化镉颗粒可产生不同的颜色。
这个工作对了解量子限域效应很有帮助,该效应解释了量子点大小和颜色之间的相互关系,也同时也为量子点的应用铺平了道路。
1997年以来,随着量子点制备技术的不断提高,量子点己越来越可能应用于生物学研究。
1995年,AlivisatosI.Z.]和Nie两个研究小组首次将量子点作为生物荧光标记,并且应用于活细胞体系,他们解决了如何将量子点溶于水溶液,以及量子点如何通过表面的活性基团与生物大分子偶联的问题,由此掀起了量子点的研究热潮。
主要性质(1)量子点的荧光寿命长。
有机荧光染料的荧光寿命一般仅为几纳秒(这与很多生物样本的自发荧光衰减的时间相当)。
而量子点的荧光寿命可持续数十纳秒(20ns一50ns),这使得当光激发后,大多数的自发荧光已经衰变子点荧光仍然存在,此时即可得到无背景干扰的荧光信号。
(2)生物相容性好。
量子点经过各种化学修饰之后,可以进行特异性连接,其细胞毒性低,对生物体危害小,可进行生物活体标记和检测。
(3)量子点具有很好的光稳定性。
量子点的荧光强度比最常用的有机荧光材料“罗丹明6G”高20倍,它的稳定性更是“罗丹明6G”的100倍以上。
基于氮掺杂碳量子点的水体氟离子选择性荧光开启检测
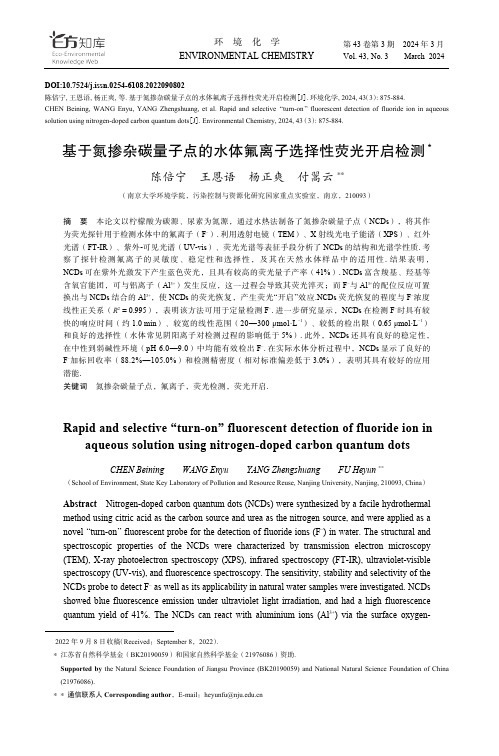
DOI:10.7524/j.issn.0254-6108.2022090802陈倍宁, 王恩语, 杨正爽, 等. 基于氮掺杂碳量子点的水体氟离子选择性荧光开启检测[J ]. 环境化学, 2024, 43(3): 875-884.CHEN Beining, WANG Enyu, YANG Zhengshuang, et al. Rapid and selective “turn-on ” fluorescent detection of fluoride ion in aqueous solution using nitrogen-doped carbon quantum dots [J ]. Environmental Chemistry, 2024, 43 (3): 875-884.基于氮掺杂碳量子点的水体氟离子选择性荧光开启检测 *陈倍宁 王恩语 杨正爽 付翯云 **(南京大学环境学院,污染控制与资源化研究国家重点实验室,南京,210093)摘 要 本论文以柠檬酸为碳源、尿素为氮源,通过水热法制备了氮掺杂碳量子点(NCDs ),将其作为荧光探针用于检测水体中的氟离子(F –). 利用透射电镜(TEM )、X 射线光电子能谱(XPS )、红外光谱(FT-IR )、紫外-可见光谱(UV-vis )、荧光光谱等表征手段分析了NCDs 的结构和光谱学性质. 考察了探针检测氟离子的灵敏度、稳定性和选择性,及其在天然水体样品中的适用性. 结果表明,NCDs 可在紫外光激发下产生蓝色荧光,且具有较高的荧光量子产率(41%). NCDs 富含羧基、羟基等含氧官能团,可与铝离子(Al 3+)发生反应,这一过程会导致其荧光淬灭;而F –与Al 3+的配位反应可置换出与NCDs 结合的Al 3+,使NCDs 的荧光恢复,产生荧光“开启”效应.NCDs 荧光恢复的程度与F –浓度线性正关系(R 2 = 0.995),表明该方法可用于定量检测F –. 进一步研究显示,NCDs 在检测F –时具有较快的响应时间(约1.0 min )、较宽的线性范围(20—300 μmol·L −1)、较低的检出限(0.65 μmol·L −1)和良好的选择性(水体常见阴阳离子对检测过程的影响低于5%). 此外,NCDs 还具有良好的稳定性,在中性到弱碱性环境(pH 6.0—9.0)中均能有效检出F –. 在实际水体分析过程中,NCDs 显示了良好的F –加标回收率(88.2%—105.0%)和检测精密度(相对标准偏差低于3.0%),表明其具有较好的应用潜能.关键词 氮掺杂碳量子点,氟离子,荧光检测,荧光开启.Rapid and selective “turn-on” fluorescent detection of fluoride ion inaqueous solution using nitrogen-doped carbon quantum dotsCHEN Beining WANG Enyu YANG Zhengshuang FU Heyun **(School of Environment, State Key Laboratory of Pollution and Resource Reuse, Nanjing University, Nanjing, 210093, China )Abstract Nitrogen-doped carbon quantum dots (NCDs) were synthesized by a facile hydrothermal method using citric acid as the carbon source and urea as the nitrogen source, and were applied as a novel “turn-on” fluorescent probe for the detection of fluoride ions (F –) in water. The structural and spectroscopic properties of the NCDs were characterized by transmission electron microscopy (TEM), X-ray photoelectron spectroscopy (XPS), infrared spectroscopy (FT-IR), ultraviolet-visible spectroscopy (UV-vis), and fluorescence spectroscopy. The sensitivity, stability and selectivity of the NCDs probe to detect F – as well as its applicability in natural water samples were investigated. NCDs showed blue fluorescence emission under ultraviolet light irradiation, and had a high fluorescence quantum yield of 41%. The NCDs can react with aluminium ions (Al 3+) via the surface oxygen-2022 年 9 月 8 日 收稿(Received :September 8,2022).* 江苏省自然科学基金(BK20190059)和国家自然科学基金(21976086)资助.Supported by the Natural Science Foundation of Jiangsu Province (BK20190059) and National Natural Science Foundation of China (21976086).* * 通信联系人 Corresponding author ,E-mail :***************.cn876环 境 化 学43 卷containing groups, which would quench the fluorescence emission of NCDs. Due to the strong coordination affinity, F– can compete with NCDs for Al3+ and thus recover the fluorescence of NCDs.There existed a good linear relationship between the recovery ratio of NCDs fluorescence and F–concentration (R2 = 0.995), suggesting the possibility of NCDs in F– quantification. The NCDs-based fluorescence method for F– detection exhibited a short response time (approximately1.0 min), wide linear range (20—300 μmol·L−1), low detection limit (0.65 μmol·L−1), good selectivity(influences of common ions below 5%), and satisfactory stability in environmentally relevant pH range (pH 6.0—9.0). Finally, the proposed method was successfully applied in the analysis of F– in real water samples with high recoveries (88.2%—105.0%) and precision (relative standard deviations lower than 3.0%).Keywords nitrogen-doped carbon dots,fluoride ion,fluorescent detection,turn-on.氟是常见的水体污染物,过量摄入会导致氟中毒,不但会损害人体骨骼和牙齿健康,还可能使人体肾脏受损和甲状腺激素紊乱[1 − 2]. 氟污染已对全球多个国家造成了严重威胁,全球有超过2亿人处于氟中毒的危险中,我国是氟中毒较为严重的国家之一[3 − 4]. 由于严重的毒副作用,世界卫生组织(WHO)规定饮用水中的氟离子(F–)浓度不得超过1.5 mg·L−1(ISBN 978-92-4-154995-0),我国《生活饮用水卫生标准》规定水中氟化物不应超过1.0 mg·L−1(GB 5749-2006). 因此,对水体中的F–进行监测和管理是保障水环境安全的重要内容,研究准确、快速、高灵敏度的水体F–检测方法十分必要.目前F–的检测方法主要包括离子选择电极法、离子色谱法、分子吸收光谱法、比色法和荧光检测法等[5 − 8]. 其中,荧光检测法因其灵敏度高、检测实时、操作简便等优点,近年来引起了研究者的广泛关注[8 − 11]. 荧光检测技术的关键是其探针,探针的性能很大程度上决定了方法的检测灵敏度、速度和选择性. 目前可用于F–检测的荧光探针以硅基/硼基/脲基有机合成小分子或聚合物、无机半导体量子点为主[8, 12 − 15]. 这些探针不但种类较为有限,还存在着合成过程复杂、F–响应时间长、检测限高,以及在水溶液中适用性较差等问题[12 − 14].碳量子点是一种新兴的零维荧光碳纳米材料,具有荧光性质可控、稳定性高、水溶性好、合成方法简单、毒性低等优点[16 − 20],在荧光检测领域显示了巨大的应用潜力. 在环境分析方面,碳量子点已被成功用于检测水体、血液等环境样品中的污染物[21 − 25]. 但目前关于碳量子点的荧光检测研究主要集中于重金属等阳离子型污染物[21 − 23],对F–等阴离子型污染物的研究相对较少.本文以柠檬酸为碳源、尿素为氮源,采用简单的水热法制备了掺氮荧光碳量子点(NCDs),并利用多种表征技术对其结构组成和光学性质进行了表征. NCDs与铝离子(Al3+)作用后会发生荧光淬灭,而F–与Al3+的配位反应可置换出与NCDs结合的Al3+,使NCDs荧光恢复. 利用荧光“开启”效应,建立了F–的快速检测方法,研究了方法的灵敏度、选择性和稳定性,以及其在实际水体样品中的应用性能.1 实验部分(Experimental section)1.1 化学试剂分析纯一水合柠檬酸(C6H8O7·H2O)、尿素(CH4N2O)、无水乙醇(C2H5OH)、氢氧化钠(NaOH)、盐酸(HCl)和硫酸(H2SO4)购自国药集团化学试剂有限公司. 分析纯六水合氯化铝(AlCl3·6H2O)、氟化钠(NaF)、氯化钠(NaCl)、溴化钠(NaBr)、硝酸钠(NaNO3)、溴酸钠(NaBrO3)、碳酸钠(Na2CO3)、氯化钾(KCl)、氯化镁(MgCl2)、氯化钙(CaCl2)购自上海Sigma-Aldrich公司. 生物试剂级硫酸奎宁购自上海阿拉丁生化科技股份有限公司.1.2 NCDs的制备利用水热法制备NCDs,具体制备过程如下:将0.21 g一水合柠檬酸和0.18 g尿素溶于5 mL去离子水中,超声至形成澄清溶液. 将上述溶液转移至含有聚四氟乙烯内衬的高压反应釜中,置于鼓风烘箱中加热,于160 ℃反应4 h. 离心收集反应产物,经乙醇洗涤、冷冻干燥后,得到固体NCDs样品.3 期陈倍宁等:基于氮掺杂碳量子点的水体氟离子选择性荧光开启检测877NCDs储备液配置于纯水中,并于4 ℃避光保存.1.3 NCDs的表征采用JEM-2100型透射电子显微镜(TEM,日本JEOL公司)观察NCDs形貌. 利用Vario MICRO cube型元素分析仪(德国Elementar公司)测定NCDs中碳、氮、氧、氢等元素含量. 使用NEXUS870型傅里叶变换红外光谱仪(FT-IR,美国Nicolet公司)解析NCDs的官能团性质. 利用PHI5000 VersaProbe型X射线光电子能谱仪(XPS,日本ULVAC-PHI公司)分析NCDs的表面元素组成和元素形态. 使用Zetasizer Nano ZS型纳米粒度电位仪(英国Malvern公司)测定NCDs的Zeta电位. 采用UV-2700型紫外-可见分光光谱仪(日本Shimadzu公司)和Aqualog型荧光光谱仪(日本Horiba公司)分别采集NCDs的紫外-可见吸收光谱(UV-vis)和荧光光谱. 以硫酸奎宁的H2SO4溶液为标准样品,采用参比法测定NCDs的荧光量子产率. 使用FLS-980型稳态瞬态荧光光谱仪分析(英国Edinburgh公司)测定NCDs的荧光寿命.1.4 NCDs对F–的荧光检测性能研究在10 mL离心管中加入适量NCDs溶液和AlCl3溶液,使溶液中NCDs浓度为1 mg·L−1、Al3+浓度为0—140 μmol·L−1,并用NaOH将溶液pH值调节为7.0. 溶液配置完成1 min后,采集上述溶液在激发波长(E x)为340 nm处的二维荧光光谱. 利用相同的方法配置NCDs、AlCl3和NaF的混合溶液(pH 7.0),使NCDs浓度为1 mg L−1、Al3+浓度为100 μmol·L−1、F–浓度范围为0—500 μmol·L−1,并在E x为340 nm处采集溶液的荧光光谱. 为研究NCDs荧光检测F–的稳定性和选择性,考察了光照、溶液pH值,以及常见水体阴阳离子对检测过程的影响. 在光稳定性实验中,持续采集NCDs、NCDs/Al3+、NCDs/Al3+/F–混合溶液在E x为340 nm、发射波长(E m)为440 nm处的荧光强度,采集时长为1 h,采集频率为每分钟1次. 在pH影响实验中,采用NaOH和HCl调节溶液pH值,pH值设定范围为4.0—9.0.在阴阳离子影响实验中,氯离子(Cl–)、溴离子(Br–)、硝酸根(NO3–)、硫酸根(SO42–)、溴酸根(BrO3–)、碳酸根(CO32–)、钾离子(K+)、镁离子(Mg2+)、钙离子(Ca2+)等离子的浓度为50 μmol·L−1和300 μmol·L−1.所有实验均设置3组平行样.2 结果与讨论(Results and discussion)2.1 NCDs表征结果2.1.1 NCDs的形貌和粒径图1a为NCDs的TEM图像,可以看出本研究所合成的NCDs具有类球形结构,且颗粒分散性良好、尺寸较为均一(粒径范围为1.5—5.0 nm). 对NCDs的粒径进行统计分析,得到平均粒径为3.4 nm.2.1.2 NCDs的元素组成和官能团性质元素分析结果显示,NCDs中氮质量分数高达40.80% wt.,证实了氮元素的成功掺杂. NCDs中其它主要元素分别为碳(35.18%)、氧(17.65%)和氢(6.37%). 图1b为NCDs的FT-IR图谱. NCDs在1580 cm−1处的C=C伸缩振动峰和1440、1400、1340 cm−1处的C—H弯曲振动峰来源于其碳骨架结构[26];1260 cm−1处的吸收峰对应于C—N的伸缩振动,验证了NCDs中氮元素及含氮官能团的存在[27];1690 cm−1和1180 cm−1处的峰分别来源于C=O和C—O的伸缩振动[26, 28],表明NCDs还具有羧基、羟基等含氧官能团.NCDs的XPS分析结果如图1c和d所示. 在NCDs的XPS全谱扫描图中出现了3个尖锐的特征结合能峰(图1c),分别对应于C1s(285 eV)、N1s(400 eV)和O1s(532 eV),表明NCDs表面富含碳、氮、氧元素. C1s峰可进一步分为4个子峰(图1d),对应于不同化学状态的碳原子,具体为:非氧化碳原子(C=C/C—C,结合能为284.5 eV)、与氮相连的碳原子(C—N,结合能为285.7 eV)、羟基/烷氧基中的碳原子(C—O,结合能为286.8 eV)和羰基/羧基中的碳原子(C=O,结合能为288.5 eV)[26, 28]. 结果与FT-IR表征结果一致,进一步证明了NCDs中存在含氮官能团以及羟基、羧基等含氧官能团.图 1 NCDs 的(a )TEM 图和粒径分布直方图(插图)、(b )FT-IR 光谱图、(c )XPS 全扫描谱图和(d )C1s 高分辨率谱图Fig.1 (a ) TEM image and histogram of particle size distribution, (b ) FT-IR spectrum, and (c ) full scan and (d ) C1s XPSspectra of NCDs2.1.3 NCDs 的光谱学性质图2a 为NCDs 的UV-vis 光谱图. 在低于230 nm 和300—380 nm 的波段范围内,NCDs 均具有明显光吸收;其中小于230 nm 的吸收峰归因于C=C 基团的π-π*跃迁,通常不产生强荧光信号[29];而峰值位于340 nm 处的吸收峰则可能伴随着荧光发射的产生. NCDs 的三维荧光光谱分析结果印证了这一点. 如图2b 所示,当E x 为300—380 nm 时,NCDs 产生了很强的荧光发射,E m 范围为400—500 nm.NCDs 的荧光峰值位于E x = 340 nm/E m = 440 nm 处,可能是产生于NCDs 表面态电子-空穴对的辐射复合[17]. 值得注意的是,当E x 在300 nm 至380 nm 之间变化时,NCDs 的E m 峰始终位于440 nm 左右,没有明显位移,说明NCDs 具有不依赖于E x 的荧光发射特性,这可能源于其较为均一的粒径和表面状态分布[17]. 碳量子点的荧光量子产率是衡量其发光性能的重要指标. 以硫酸奎宁为参比,根据NCDs 荧光强度与吸光度的关系,测定了NCDs 的荧光量子产率(图2c ),发现NCDs 的量子产率高达41%,表明其具有优异的荧光发射本领.图 2 NCDs 溶液的(a )UV-vis 光谱图和(b )三维荧光光谱图;(c )NCDs 荧光强度积分与吸光度的线性关系Fig.2 (a ) UV-vis absorption and (b ) 3D fluorescence spectra of NCDs aqueous solution; (c ) linear relationship betweenfluorescence intensity integral and absorbance of NCDs878环 境 化 学43 卷3 期陈倍宁等:基于氮掺杂碳量子点的水体氟离子选择性荧光开启检测8792.2 NCDs的F–检测性能2.2.1 检测灵敏度碳量子点通常带负电,故绝大多数基于碳量子点的荧光传感器被用于检测阳离子型污染物 [21 − 23] .研究显示,通过与碳量子点官能团的作用,金属等阳离子可引发量子点的荧光淬灭. 若能利用阴离子与金属的强配位作用,使金属离子从碳量子点脱附,则可恢复碳量子点的荧光,进而实现阴离子的荧光“开启”检测. Al3+作为一种环境友好的金属离子,与F–之间存在极强的配位能力. 基于此,以Al3+为介导离子,设计了NCDs检测F–的实验.首先研究了Al3+对NCDs荧光的影响. 如图3a所示,当Al3+的浓度从0逐渐增加至140 μmol·L−1时,NCDs的荧光强度逐渐降低,证实了Al3+对NCDs的荧光淬灭效应.图3b显示了加入F–后,NCDs/Al3+溶液(Al3+浓度为100 μmol·L−1)的荧光变化情况. 可以看出,随着F–浓度的升高,NCDs/Al3+溶液的荧光强度逐渐变强,表明F–确实能够恢复NCDs被Al3+淬灭的荧光.图 3 (a)Al3+和(b)F–对NCDs溶液荧光光谱的影响(E x= 340 nm);(c)不同浓度F–存在下NCDs在E x = 340 nm/E m = 440 nm处的荧光恢复率;(d)NCDs在E x = 340 nm/E m = 440 nm处的荧光恢复率与F–的相关关系Fig.3 Fluorescence spectra of NCDs solution at E x 340 nm upon the addition of (a) Al3+ and (b) F–; (c) fluorescence recovery efficiency of NCDs at E x = 340 nm/E m = 440 nm as a function of F– concentration; (d) relationship between fluorescence recovery efficiency of NCDs at E x = 340 nm/E m = 440 nm and F– concentration 根据NCDs荧光峰值处(E x = 340 nm,E m = 440 nm)的变化情况,可通过下式计算F–存在下NCDs的荧光恢复率:其中,F0为NCDs溶液的原始荧光强度,F Al和F分别为加入Al3+和F–后的NCDs荧光强度. 由图3c可以发现,NCDs荧光恢复率先随着F–浓度的升高而稳步上升,并在F–浓度超过300 μmol·L−1后逐渐平稳,说明已达NCDs荧光恢复的上限. 在20—300 μmol·L−1浓度范围内,NCDs的荧光恢复率与F–浓度具有很好的线性关系(R2 = 0.995,图3d),表明该NCDs/Al3+体系可用于定量检测水中的F–. 该方法对F–的检出限(LOD)为0.65 μmol·L−1(即0.012 mg L−1),远低于WHO和我国规定的饮用水F–浓度限值,也低于多数已报道F–荧光检测法的LOD值(见表1)[8, 10 − 12, 28 − 31],表明NCDs/Al3+方法具有良好的F–灵敏度.表 1 文献报道F–荧光检测法的分析性能Table 1 Analytical performances of reported fluorescence methods for F– detection探针Probe 检出限/(μmol·L−1)LOD线性范围/(μmol·L−1)Linear Range响应时间/minResponse time文献References基于内部电荷转移的荧光探针80500—2800025[8]基于Si—O键断裂的荧光探针180—100045[12]含有多面体低聚硅氧烷的纳米粒子1010—100 1.67[13]基于硼酸的荧光碳点1100—26700 5.0[14]蒽基荧光受体 2.02—120NA a[30]基于1,1’-联萘基支架的荧光探针 1.86 5.0—45.0200[31]基于壳聚糖凝胶的荧光碳点 6.6 6.6—50.6 2.0[32]基于羧酸桥联二铁络合物的荧光探针 6.70—30NA a[33] NCDs0.6520—300 1.0本论文 注:a “NA” 文中未提及. a “NA ” Not available.2.2.2 检测速度图4a显示了加入Al3+和F–后NCDs的荧光强度随时间的变化. 可以看出,Al3+淬灭NCDs荧光的速度极快,几乎在加入NCDs溶液的瞬时即达到淬灭平衡. F–恢复NCDs荧光的速度略慢于Al3+的淬灭速度,但也可在约1.0 min之内达到恢复平衡. 与文献报道的荧光方法相比(表1),NCDs/Al3+对F–的响应时间更短,具有更快的F–检测速度.图 4 NCDs的(a)荧光响应速度和(b)荧光稳定性随时间的变化;溶液pH值对NCDs的(c)荧光强度和(d)荧光恢复率的影响(Al3+浓度为100 μmol·L−1,F–浓度为300 μmol·L−1)Fig.4 Fluorescence intensity of NCDs solution in the presence of Al3+ (100 μmol·L−1) and/or F– (300 μmol·L−1) as a function of (a) incubation time and (b) irradiation time; effect of solution pH on NCDs (c) fluorescence intensity and (d) fluorescencerecovery efficiency by F–2.2.3 检测稳定性由于荧光探针是依靠荧光强度的改变来达到检测目的,因此探针在激发光下的荧光稳定性是其至880环 境 化 学43 卷3 期陈倍宁等:基于氮掺杂碳量子点的水体氟离子选择性荧光开启检测881关重要的性能指标. 如图4b所示,在激发光下连续照射1 h后,NCDs、NCDs/Al3+和NCDs/Al3+/F–溶液的荧光发射强度均未发生明显波动,表明该NCDs检测体系具有较强的荧光稳定性.图4c和d为溶液pH值对NCDs检测F–性能的影响. 在溶液pH4.0时,NCDs表现出较弱的荧光发射,这可能是由于NCDs表面的含氧官能团在酸性条件下解离程度较低,NCDs疏水性较高,易因聚集产生荧光淬灭[34]. 当溶液pH由4.0升至9.0时,随着NCDs表面官能团解离程度的提高,NCDs的荧光强度逐渐上升,并在中性至弱碱性pH范围内(6.0—9.0)保持稳定(图4c). 在此pH范围内,Al3+和F–对NCDs荧光的淬灭和恢复程度也基本相同(图4d),表明NCDs有良好的pH适应性,在中性至弱碱性环境中均能保持稳定的荧光性能.2.2.4 检测选择性进一步考察NCDs/Al3+体系对F–的选择性,研究了水体常见阴离子(Cl–、Br–、NO3–、SO42–、BrO3–、CO32–)和阳离子(K+、Mg2+、Ca2+)对F–检测的影响. 如图5a和c所示,在浓度相同的情况下,F–恢复NCDs荧光的效率明显高于其它离子. 例如,低浓度(50 μmol·L−1)和高浓度(300 μmol·L−1)F–分别将NCDs的荧光恢复了10%和60%,而除CO32–外的其它离子的恢复率不足2%和5%.CO32–在两个浓度下的恢复效率分别为5%和25%,稍高于其它干扰离子,这可能是因为CO32–能够与Al3+在溶液中发生双水解反应. 尽管如此,CO32–的荧光恢复效率仍明显低于F–. 研究了F–与相同浓度干扰离子共存时,NCDs的荧光恢复效率(图5b和d). 在低浓度共存条件下,F–对NCDs的荧光恢复仅受CO32–微量影响(恢复率由10%增至14%);而当共存浓度较高时,所有测试离子均不影响NCDs检测F–. 结果表明, NCDs/Al3+体系对F–具有优秀的选择性. 该体系的F–选择性主要源于F–远高于其它离子的Al3+配位能力,F–的存在更容易使Al3+从NCDs上脱附.图 5 (a)低浓度(50 μmol·L−1)和(c)高浓度(300 μmol·L−1)离子存在下NCDs的荧光恢复率;(b)低浓度(50 μmol·L−1)和(d)高浓度(300 μmol·L−1)干扰离子和F–共存时的NCDs荧光恢复率Fig.5 Fluorescence recovery efficiency of NCDs in the presence of different ions at (a) low (50 μmol·L−1) and (c) high concentrations (300 μmol·L−1), and in the coexistence of F– and other ions at (b) low (50 μmol·L−1) and (d) highconcentrations (300 μmol·L−1)2.3 NCDs的F–检测机制为探究NCDs对F–的检测机制,考察了Al3+和F–对NCDs荧光寿命的影响. 如图6a所示,NCDs、NCDs+Al3+、NCDs/Al3++F–的荧光衰减曲线几乎重叠,3个体系中NCDs的荧光寿命分别为7.01 ns、7.06 ns、7.02 ns,表明Al3+和F–对NCDs的荧光寿命无明显影响,二者不是通过能量转移过程影响NCDs荧光发光. 由此推测Al3+对NCDs荧光的淬灭机制为静态淬灭,即NCDs与Al3+发生相互作用,形成NCDs/Al3+静态复合物;当F–存在时,F–会与Al3+发生配位反应,使NCDs/Al3+复合物中的Al3+脱附,进而恢复NCDs荧光. 为了验证此假设,进一步分析了加入Al3+和F–后NCDs的表面电荷和FT-IR光谱变化. NCDs表面含有丰富含氧官能团,原始NCDs带负电,Zeta电位为-6.41 mV;加入Al3+后,由于Al3+与含氧官能团发生配位作用,因此NCDs的Zeta电位升至+1.40 mV;而加入F–后,F–与Al3+的配位导致NCDs表面的Al3+脱附,NCDs的Zeta电位又降至-3.97 mV. FT-IR光谱分析结果也印证了这一机制. 如图6b所示,与NCDs相比,NCDs/Al3+的FT-IR光谱在1120 cm−1处出现1个新强峰,对应于Al—OH的弯曲振动,证实了Al3+与NCDs的结合[35 − 36];加入F–后,Al—OH吸收峰的强度显著下降,表明F–的存在使Al3+从NCDs表面脱附.图 6 加入Al3+(100 μmol·L−1)和F–(300 μmol·L−1)前后NCDs的(a)荧光衰减曲线和(b)FT-IR光谱Fig.6 (a) Time-resolved fluorescence decay and (b) FT-IR spectra of NCDs solution in the absence and presence of Al3+(100 μmol·L−1) and/or F– (300 μmol·L−1)2.4 NCDs对实际水样中F–的检测性能为了评估NCDs/Al3+的可应用性,将其用于检测实际水体中的F–浓度. 所测试实际水样分别取自实验室自来水龙头和太湖,过0.45 μm滤膜后直接进行分析. 结果显示,两个水样中的F–浓度均低于方法的LOD值. 论文进一步开展了梯度加标回收实验(加标浓度为20、40、60、80、100 μmol·L−1,表2),测得F–回收率范围为88.2%—105.0%,与常规离子色谱法的检测回收率相当(91.4%—111.9%). 此外,NCDs/Al3+方法也具有较好的精密度,多次检测的相对标准偏差在2.67%以内(n=3),表明可利用NCDs检测实际水样中的F–.表 2 基于NCDs的荧光法对实际水样中F–的检测结果(%, n=3)Table 2 Analytical results for the determination of F– in real water samples加标浓度/(μmol·L−1)Spiked concentration自来水样加标回收率Tap water recoveries太湖水样加标回收率Taihu Lake water recoveries荧光法离子色谱法荧光法离子色谱法2088.2 ± 2.24111.7 ± 0.7688.5 ± 2.66111.9 ± 1.274092.1 ± 2.6398.5 ± 2.0694.7 ± 2.01107.2 ± 1.936095.7 ± 2.6794.0 ± 0.33105.0 ± 1.9799.9 ± 1.758096.9 ± 1.9092.0 ± 1.2197.3 ± 2.2094.7 ± 0.25100101.6 ± 1.5891.4 ± 1.13103.7 ± 2.0191.5 ± 1.053 结论(Conclusion)本文利用简单的水热法成功地制备了具有优异荧光性能的掺氮碳量子点(NCDs). 该量子点能够882环 境 化 学43 卷以铝离子(Al 3+)为介导,通过荧光“关闭”—“开启”模式选择性检测水体中的氟离子(F –). 与已报道的F –荧光检测方法相比,本论文基于NCDs 的检测体系具有更低的F –检测限(0.65 μmol·L −1)和更快的检测速度(F –响应时间约1.0 min ). 此外,NCDs 还具有优异的荧光稳定性和F –选择性,在实际水样的F –分析中也显示了良好的应用性能. 本论文的研究结果可为水体F –的快速检测提供技术支持,也有助于拓展碳量子点材料在荧光检测中的应用.参考文献(References)AOBA T, FEJERSKOV O. Dental fluorosis: Chemistry and biology [J ]. Critical Reviews in Oral Biology and Medicine:an OfficialPublication of the American Association of Oral Biologists, 2002, 13(2): 155-170.[ 1 ]AK S, BHATNAGAR M, VIG K, et al. Excess fluoride ingestion and thyroid hormone derangements in children living in Delhi,India [J ]. Fluoride, 2005, 38(2): 98-108.[ 2 ]AYOOB S, GUPTA A K. Fluoride in drinking water: A review on the status and stress effects [J ]. Critical Reviews in EnvironmentalScience and Technology, 2006, 36(6): 433-487.[ 3 ]刘东生, 陈庆沐, 余志成, 袁芷云. 我国地方性氟病的地球化学问题 [J ]. 地球化学, 1980, 9(1): 13-22.LIU D S, CHEN Q M, YU Z C, et al. Geochemical environment problems concerning the endemic fluorine disease in China [J ].Geochimica, 1980, 9(1): 13-22(in Chinese ).[ 4 ]DAY J K, BRESNER C, COOMBS N D, et al. Colorimetric fluoride ion sensing by polyborylated ferrocenes: Structural influences onthermodynamics and kinetics [J ]. Inorganic Chemistry, 2008, 47(3): 793-804.[ 5 ]MORÉS S, MONTEIRO G C, SANTOS F D S, et al. Determination of fluorine in tea using high-resolution molecular absorptionspectrometry with electrothermal vaporization of the calcium mono-fluoride CaF [J ]. Talanta, 2011, 85(5): 2681-2685.[ 6 ]LI Y H, DUAN Y, ZHENG J, et al. Self-assembly of graphene oxide with a silyl-appended spiropyran dye for rapid and sensitivecolorimetric detection of fluoride ions [J ]. Analytical Chemistry, 2013, 85(23): 11456-11463.[ 7 ]ZHU B C, YUAN F, LI R X, et al. A highly selective colorimetric and ratiometric fluorescent chemodosimeter for imaging fluoride ionsin living cells [J ]. Chemical Communications, 2011, 47(25): 7098-7100.[ 8 ]ZHOU Y, ZHANG J F, YOON J. Fluorescence and colorimetric chemosensors for fluoride-ion detection [J ]. Chemical Reviews, 2014,114(10): 5511-5571.[ 9 ]LIU W, DAI X, BAI Z L, et al. Highly sensitive and selective uranium detection in natural water systems using a luminescentmesoporous metal-organic framework equipped with abundant lewis basic sites: A combined batch, X-ray absorption spectroscopy, and first principles simulation investigation [J ]. Environmental Science & Technology, 2017, 51(7): 3911-3921.[10]LIU W, DAI X, WANG Y, et al. Ratiometric monitoring of thorium contamination in natural water using a dual-emission luminescenteuropium organic framework [J ]. Environmental science & technology, 2018, 53(1): 332-341.[11]CHENG X H, JIA H, FENG J, et al. “Reactive” probe for fluoride: “Turn-on” fluorescent sensing in aqueous solutionand bioimaging in living cells [J ]. Sensors and Actuators B:Chemical, 2014, 199: 54-61.[12]DU F F, BAO Y Y, LIU B, et al. POSS-containing red fluorescent nanoparticles for rapid detection of aqueous fluoride ions [J ].Chemical Communications, 2013, 49(41): 4631-4633.[13]SHAMSIPUR M, SAFAVI A, MOHAMMADPOUR Z, et al. Fluorescent carbon nanodots for optical detection of fluoride ion inaqueous media [J ]. Sensors and Actuators B:Chemical, 2015, 221: 1554-1560.[14]LIU J B, YANG X H, WANG K M, et al. A switchable fluorescent quantum dot probe based on aggregation/disaggregationmechanism [J ]. Chemical Communications, 2011, 47(3): 935-937.[15]SUN Y P, ZHOU B, LIN Y, et al. Quantum-sized carbon dots for bright and colorful photoluminescence [J ]. Journal of the AmericanChemical Society, 2006, 128(24): 7756-7757.[16]ZHU S J, SONG Y B, ZHAO X H, et al. The photoluminescence mechanism in carbon dots (graphene quantum dots, carbon nanodots,and polymer dots): Current state and future perspective [J ]. Nano Research, 2015, 8(2): 355-381.[17]ZHANG Y Q, MA D K, ZHUANG Y, et al. One-pot synthesis of N-doped carbon dots with tunable luminescence properties [J ].Journal of Materials Chemistry, 2012, 22(33): 16714-16718.[18]HU C, LI M Y, QIU J S, et al. Design and fabrication of carbon dots for energy conversion and storage [J ]. Chemical Society Reviews,2019, 48(8): 2315-2337.[19]傅鹏, 周丽华, 唐连凤, 等. 碳量子点的制备及其在能源与环境领域应用进展 [J ]. 应用化学, 2016, 33(7): 742-755.FU P, ZHOU L H, TANG L F, et al. Progress in preparation of carbon quantum dots and its application in the fields of energy and environment [J ]. Chinese Journal of Applied Chemistry, 2016, 33(7): 742-755(in Chinese ).[20]PENG D, ZHANG L, LIANG R P, et al. Rapid detection of mercury ions based on nitrogen-doped graphene quantum dots acceleratingformation of Manganese porphyrin [J ]. ACS Sensors, 2018, 3(5): 1040-1047.[21]3 期陈倍宁等:基于氮掺杂碳量子点的水体氟离子选择性荧光开启检测883LIU H, LI R S, ZHOU J, et al. Branched polyethylenimine-functionalized carbon dots as sensitive and selective fluorescent probes forN -acetylcysteine via an off-on mechanism [J ]. Analyst, 2017, 142(22): 4221-4227.[22]ZHENG M, XIE Z G, QU D, et al. On-off-on fluorescent carbon dot nanosensor for recognition of chromium(VI) and ascorbic acidbased on the inner filter effect [J ]. ACS Applied Materials & Interfaces, 2013, 5(24): 13242-13247.[23]CHEN B B, LIU M L, ZHAN L, et al. Terbium (III) modified fluorescent carbon dots for highly selective and sensitive ratiometry ofstringent [J ]. Analytical chemistry, 2018, 90(6): 4003-4009.[24]ZHANG Z, ZHANG D, SHI C, et al. 3, 4-Hydroxypyridinone-modified carbon quantum dot as a highly sensitive and selectivefluorescent probe for the rapid detection of uranyl ions [J ]. Environmental Science:Nano, 2019, 6(5): 1457-1465.[25]TANG L, JI R, LI X, et al. Deep ultraviolet to near-infrared emission and photoresponse in layered N-doped graphene quantumdots [J ]. ACS nano, 2014, 8(6): 6312-6320.[26]LI H, KONG W, LIU J, et al. Fluorescent N-doped carbon dots for both cellular imaging and highly-sensitive catechol detection [J ].Carbon, 2015, 91: 66-75.[27]QU D, ZHENG M, ZHANG L G, et al. Formation mechanism and optimization of highly luminescent N-doped graphene quantumdots [J ]. Scientific Reports, 2014, 4: 5294.[28]LI L B, YU B, YOU T. Nitrogen and sulfur co-doped carbon dots for highly selective and sensitive detection of Hg (Ⅱ) ions [J ].Biosensors and Bioelectronics, 2015, 74: 263-269.[29]HUANG W W, LIN H, CAI Z, et al. A novel anthracene-based receptor: Highly sensitive fluorescent and colorimetric receptor forfluoride [J ]. Talanta, 2010, 81(3): 967-971.[30]DONG M, PENG Y, DONG Y M, et al. A selective, colorimetric, and fluorescent chemodosimeter for relay recognition of fluoride andcyanide anions based on 1, 1'-binaphthyl scaffold [J ]. Organic Letters, 2012, 14(1): 130-133.[31]BARUAH U, GOGOI N, MAJUMDAR G, et al. β-Cyclodextrin and calix[4]arene-25, 26, 27, 28-tetrol capped carbon dots for selectiveand sensitive detection of fluoride [J ]. Carbohydrate Polymers, 2015, 117: 377-383.[32]ZHOU Y H, DONG X L, ZHANG Y X, et al. Highly selective fluorescence sensors for the fluoride anion based on carboxylate-bridgeddiiron complexes [J ]. Dalton Transactions, 2016, 45(16): 6839-6846.[33]WANG H, WANG Y, GUO J, et al. A new chemosensor for Ga 3+ detection by fluorescent nitrogen-doped graphitic carbon dots [J ].RSC Advances, 2015, 5(17): 13036-13041.[34]SHI L H, WANG Q, ZHANG C, et al. Tricolor emission carbon dots for label-free ratiometric fluorescent and colorimetric recognitionof Al 3+ and pyrophosphate ion and cellular imaging [J ]. Sensors and Actuators B:Chemical, 2021, 345: 130375.[35]LIU C S, SHIH K, GAO Y X, et al. Dechlorinating transformation of propachlor through nucleophilic substitution by dithionite on thesurface of alumina [J ]. Journal of Soils and Sediments, 2012, 12(5): 724-733.[36]884环 境 化 学43 卷。
美国研发新型超级电容 充电仅需200微秒

队与美 国威 斯康 星大 学 的研 究人 员合作 ,设计 出 了
这个不足4 纳米 宽 的光学设 备 ,新设 备使光子 同单个 分子或量子点一样大小 的物体相互作用成 为可能。
来 源 : 中 国机 械 网
在 安 静地 倾 听 。如 果将 很 多这 样 的分 子 “ 双胞 胎 ”
放 在一 个 房 间 内 ,物 以类 聚 ,谈 话 的分 子 会 靠 近 谈 话 的 分子 .而 倾 听 的 分 子会 接触 倾 听 的分 子 ,但 它 们 不
可能完全隔离开 ,而是分群聚集 在房 间的不 同角落 ,
之 前 的 预测 那 样 宽度 拉 伸 。这 样 的 发 现 有 助 于 改 善 锂
新型 的微传 感器揭 示 了细胞质 量 与细胞增 殖率 之 间 的关 系 。研究 结 果在 线 发 表在 《 国科 学 院院 刊》 美 (N S P A )杂 志上 。
“ 型微传 感 器 是微 型 工程 学 和 细胞 生 物学 技 新
使用 这种嵌 段共 聚物作 为原 始衬底 ,再 加上 新 研 发 的SS 术 ,就 能 形 成 具 有 不 同形 状 的材 料 I技
f 球 形 到 圆 柱 形 再 到 曲 面 ) 新 材 料 的 物 理 和 化 学 从 。
性 质 取决 于嵌 段 共 聚 物 的 化 学性 质 和结 构 如 何 与 A D 术 的化 学性 质相 互作 用 ,这使 得研 究人 员可 L技
术融 合 的产物 , ”伊 利诺 大 学微 纳 米 技术 工程 学 实 验室 的 主管B si : “ 丁具 将 推 动生 物 学 的发 ahr 新 说
展 , 帮 助 我 们 解 答 细 胞 生 物 学 、癌 症 研 究 及 组 织 工
可变电流激光离子束气相法 纳米硅
文章标题:探索可变电流激光离子束气相法在纳米硅制备中的应用在当今科技发展日新月异的时代,纳米材料已经成为科学研究的热门领域之一。
纳米硅作为一种重要的纳米材料,在光电、生物医学、化学等多个领域都有着广泛的应用前景。
作为文章写手,我将从可变电流激光离子束气相法在纳米硅制备中的应用这一主题出发,为您深度解读这一领域的知识。
1. 可变电流激光离子束气相法我们需要了解什么是可变电流激光离子束气相法。
这是一种先进的纳米材料制备技术,通过使用激光离子束对气相中的原料进行处理,从而合成出纳米材料。
与传统的制备方法相比,可变电流激光离子束气相法具有设备简单、制备周期短、产品纯度高等优势,因此在纳米材料制备领域备受关注。
2. 纳米硅的特性和应用接下来,让我们来了解一下纳米硅的特性和应用。
纳米硅具有较大的比表面积、优异的光电性能和独特的光学性质,使其在光电器件、催化剂、生物医学等领域有着广泛的应用。
纳米硅还具有较高的化学活性和表面能,可用于制备多功能纳米复合材料,拓展了其在材料科学领域的应用潜力。
3. 可变电流激光离子束气相法在纳米硅制备中的应用综合以上两个方面的知识,我们可以得出结论:可变电流激光离子束气相法在纳米硅制备中具有重要的应用前景。
通过调控激光离子束的能量和流量,可以精确控制纳米硅的形貌、尺寸和结构,从而实现对纳米硅材料性能的定制化设计。
可变电流激光离子束气相法还可以在制备过程中对原料进行原位掺杂、氧化或修饰,从而赋予纳米硅新的功能和应用价值。
4. 个人观点和理解在我的个人观点中,可变电流激光离子束气相法在纳米硅制备领域的应用前景非常广阔。
随着纳米材料在科学研究和工业应用中的重要性日益凸显,对纳米硅材料的精细化控制和定制化设计需求也越来越迫切。
而可变电流激光离子束气相法正是能够满足这一需求的先进制备技术,相信在未来的发展中将会有更多的突破和应用领域的拓展。
总结回顾通过本文的探讨,我们全面深入地了解了可变电流激光离子束气相法在纳米硅制备中的应用。
纳米孔测序 马达蛋白 纳米孔蛋白激活

纳米孔测序技术在基因组学领域具有革命意义,其应用于DNA和RNA的测序已经成为当前生物医学研究的热点之一。
而在纳米孔测序中,马达蛋白起着不可或缺的作用。
本文将详细介绍纳米孔测序技术、马达蛋白的功能和纳米孔蛋白激活的机制。
一、纳米孔测序技术纳米孔测序是一种基于纳米孔的高通量单分子测序技术。
其原理是将待测DNA或RNA分子通过纳米尺度的孔道,探测分子通过孔道时的电流变化从而获得序列信息。
纳米孔测序技术具有高速、单分子、实时测序等优势,因此受到广泛关注并逐渐应用于生物医学领域。
其应用在基因组测序、表观基因组测序、转录组测序等方面具有重要意义。
二、马达蛋白马达蛋白是一类具有蛋白质运动功能的蛋白质,在细胞活动过程中起着重要作用。
马达蛋白可以将化学能转化为机械能,驱动分子在细胞中进行运动。
在纳米孔测序中,马达蛋白被用作DNA或RNA的传输通道,通过其活性使得待测分子通过纳米孔,从而进行测序。
马达蛋白在纳米孔测序技术中的作用至关重要,其活性、稳定性和特异性直接影响着测序的准确性和效率。
三、纳米孔蛋白激活纳米孔蛋白激活是指通过一系列化学或生物学手段,使得纳米孔中的马达蛋白获得活性。
这一过程包括马达蛋白的激活、定向输送及固定以及其与纳米孔的相互作用等步骤。
其中,马达蛋白的激活是纳米孔测序中的关键步骤,直接影响着后续的测序过程。
通过激活纳米孔蛋白,使得其与待测分子之间的相互作用更加稳定,从而保证测序的准确性。
四、纳米孔测序马达蛋白的应用前景纳米孔测序马达蛋白的应用前景非常广阔。
在基因组测序领域,纳米孔测序技术已经能够对大规模基因组、表观基因组进行高通量单分子测序,为基因组学研究提供了新的手段和可能性。
在临床医学诊断方面,纳米孔测序技术还有望应用于个性化医疗、癌症早期诊断等领域。
在农业、环境监测等领域,纳米孔测序技术也将有着重要的应用价值。
纳米孔测序技术在生命科学领域具有革命性意义,而马达蛋白作为纳米孔测序中不可或缺的一部分,其激活过程对保证测序的准确性和稳定性起着至关重要的作用。
双钙钛矿量子点近红外发光
双钙钛矿量子点近红外发光是指在钙钛矿量子点中引入双配体,使其在近红外区域发出光。
这种发光材料在生物成像、医疗诊断、光电器件等领域具有广泛的应用前景。
制备双钙钛矿量子点时,需要选择合适的溶剂体系和合成条件,以保证量子点的尺寸、纯度和均匀性。
同时,需要选择合适的缓冲体系和表面活性剂,以调控量子点的光学性能和稳定性。
在掺杂稀土离子时,需要考虑离子的光谱特性和浓度效应,以优化发光的颜色和亮度。
双钙钛矿量子点的光学性能受到多种因素的影响,如量子点的尺寸、形状、组成、掺杂离子、环境介质等。
因此,需要不断优化制备条件和工艺参数,以获得具有优异性能的量子点材料。
此外,可以通过调节掺杂离子的浓度和类型,以及环境介质的性质,来调控量子点的发光颜色、亮度、稳定性和寿命等参数。
双钙钛矿量子点近红外发光的优势在于其波长较长,不容易受到生物组织中水分子的吸收和散射影响,因此具有较高的光学穿透能力。
此外,近红外光的能量与生物细胞的分子结构更匹配,有利于提高光子的利用效率和信号强度,降低背景噪声。
因此,双钙钛矿量子点近红外发光在生物成像、医疗诊断等领域具有广泛的应用前景。
在实际应用中,双钙钛矿量子点近红外发光需要与其他光学材料和器件相结合,如光纤、光学窗口、光栅等,以实现更高效、更可靠的信号传输和检测。
同时,需要进一步研究双钙钛矿量子点的生物相容性和毒性问题,以确保其在医疗诊断和生物成像中的应用安全可靠。
总之,双钙钛矿量子点近红外发光作为一种具有优异性能的光学材料,将在未来生物成像、医疗诊断、光电器件等领域发挥重要作用。
通过不断优化制备条件和工艺参数,以及深入研究其光学性能和生物安全性,将为双钙钛矿量子点的发展和应用奠定坚实的基础。
- 1、下载文档前请自行甄别文档内容的完整性,平台不提供额外的编辑、内容补充、找答案等附加服务。
- 2、"仅部分预览"的文档,不可在线预览部分如存在完整性等问题,可反馈申请退款(可完整预览的文档不适用该条件!)。
- 3、如文档侵犯您的权益,请联系客服反馈,我们会尽快为您处理(人工客服工作时间:9:00-18:30)。
Nanowire-Quantum Dot Hybridized Cell for Harvesting Sound and Solar Energies Minbaek Lee,†Rusen Yang,†Cheng Li,and Zhong Lin Wang* School of Material Science and Engineering,Georgia Institute of Technology,Georgia30332ABSTRACT We have demonstrated sound-wave-driven nanogenerators using both laterally bonded single wires and vertically aligned nanowire arrays for energy harvesting in the frequency range of35-1000Hz.The electricity produced by the single wire generator(SWG)is linearly proportional to the input acoustic energy,while the frequency does not affect the performance of the SWG in this study.By infiltrating CdS/CdT e quantum dots among vertical nanowires,we have fabricated a hybrid cell that simultaneously harvests both sound and solar energies.This demonstrates a possible approach for effectively harvesting available energies in our living environment with and without the presence of light.SECTION Energy Conversion and StorageI n addition to solar energy,enormous mechanical vibra-tional energy exists in our living environment with a large variation in amplitude and frequency,such as wind,sonic wave,hydraulic,and even noises.Harvesting this type of “random”energy can be a practical solution to power small mobile electronics for the future sensor network.1,2Great efforts have been made to efficiently convert solar,mechan-ical,and chemical energies into electricity,3-5but most of the technologies demonstrated are designed to harvest only one type of energy.As a future direction in energy research, simultaneous harvesting of multitype energy by a single device was first demonstrated for solar and mechanical energy6as well as chemical and mechanical energy,7which are referred to as hybrid energy cells.Acoustic waves,such as various sound noises from any living activities,car traffic,and the construction industry,are one of the most common mechanical vibrations in our surroundings.As for indoor mobile electronics,other types of energies are of equal or even more importance than solar energy.It is important to develop technologies that simulta-neously harvest multitype energies and use whatever is available.The previously demonstrated hybrid cell(HC)uti-lizes an ultrasonic wave with a fixed frequency of∼41kHz and irregular biomotion at∼10Hz or below.6-10Considering that,our living environment has abundant mechanical vibra-tions with various frequencies ranging from a few to thou-sands of Hz.A systematic study of the nanogenerator(NG)in various acoustic frequencies is needed for practical applica-tions of the NG.In this Letter,we first present the nanogenerators fabri-cated using both laterally bonded single wires and vertically aligned nanowire arrays for harvesting sound energy in the frequency range of35-1000Hz.The electricity produced by the single wire generator(SWG)is linearly proportional to the input acoustic energy,while the frequency does not affect the performance of the SWG in this study.Then,by infiltrating CdS/CdTe quantum dots11among vertical nanowires,we fabricated a“composite”type of HC that harvests both sound and solar energies in a complete single-volume layer rather than a stacked layer structure as we first demonstrated,6 which is a promising approach for potential driving of por-table electronics.This research is expected to inspire new research effort for developing the HC.Lateral Single Wire Generator for Harvesting Sound Energy. Traditional piezoelectric generator is based on a two-layer bender(or bimorph)-mounted cantilever beam,which pro-duces the maximum power when the driving frequency matches the resonance frequency of the cantilever.12In practice,a low-resonance-frequency resonator tends to have a large size/mass,which is too stiff to be driven by relatively weak sonic wave,while a small-size resonator has a high resonance frequency that is beyond the sonic wave frequency range,although it can be driven by small mechanical agita-tion.The cantilever-based piezoelectric generator is not the most effective choice for harvesting random sonic wave energy with a large variation in amplitude and frequency.Recently,piezoelectric ZnO nanowires(NWs)have been shown to be effective for harvesting small-magnitude mecha-nical energy.5,6,13-15The SWG is based on a single piezo-electric ZnO wire with its two ends bonded to a flexible polymer substrate,as reported previously.9The ZnO wire is stretched or compressed when the substrate is bent upward and downward under external excitation.The thickness of the substrate is much larger than the diameter of the ZnO NW. Consequently,the ZnO NWexperiences solely tensile strain or solely compressive strain,depending on the bending direc-tion of the substrate.The strain within the piezoelectric NW thereafter produces a piezoelectric field along the length of Received Date:August23,2010Accepted Date:September14,2010Published on Web Date:September17,2010the NW .The free charge carriers in the external circuit are driven to flow by the piezoelectric potential difference across two ends of the stressed NW ,while the Schottky contact at the interface can gate and regulate the current flow during the energy conversion process.7,9-10The mechanic -electric energy conversion of the NG relies on the transient current flow driven by the piezoelectric potential produced by the dynamic strain.A sound transducer was employed to generate acoustic vibration at a desired frequency.An alumina rod was firmly attached to the sound wave generator at one end,and its other end was placed directly on the top of the substrate on which a SWG was mounted,as shown in Figure 1a.The sound wave generated by the transducer was directly transmitted to the SWG.A high-sensitivity accelerometer (Wilcoxon Research,Model 736)was used to characterize the sound transducer and measure the magnitude of the vibration.The vibration of the end surface of the alumina rod was measured with the accelerometer .Figure 1b presents the impact velocity of the beam derived from the accelerometer when the transducer is excited at a frequency of 100Hz.The measurement of the accelerometer has a sinusoidal shape at a frequency of 100Hz,which agrees well with the sinusoidal exciting signal input to the acoustic transducer .The measurement of the accelerometer indicates a harmonic vibration from the sur-face.The impact velocity is about 0.78mm/sec at a frequency of 100Hz,and the acoustic power is proportional to the square of the impact velocity.Figure 1c and d present the open-circuit voltage and short-circuit current of the SWG driven by the acoustic vibration at 100Hz.Figure 1c shows that the voltage output from the SWG reaches about ∼4mV and the current reaches about ∼8pA.The fluctuation of the signal at the early stage of the vibration was mainly caused by the instability of the transducer as well as the fluctuation of the substrate.The signal became very stable in a 1s or less.Both the voltage and the current output from the SWG showed sinusoidal shapes,which is consistent to the harmonic vibration of the rod surface.In addition to the 100Hz,different frequencies from 35to 1000Hz were systematically tested,and a similar result was also observed.The sound transducer used in this experiment cannot remain at a fixed power output at a different excitation frequency.However,the power of the acoustic vibration is proportional to the impact velocity as induced by the transducer on the alumina rod,which can be derived from the accelerometer measurement.The measured NG output voltage divided by the impact velocity of the rod can be helpful to understand the performance of the NG at different frequencies,as illustrated in Figure 2a.The voltage output fluctuates much greater at lower frequency (<200Hz )than that at high frequency (>200Hz ).This is mainly due to the fluctuation of the transducer at low frequency.Overall,the voltage output is relatively uniform over the entire frequency range under investigation.In other words,the voltage output does not significantly depend on the fre-quency of the acoustic vibration.The relationship between the voltage output of the SWG and the impact velocity of the acoustic vibration at the end of the alumina rod is shown in Figure 2b.The relationship between the current output and the impact velocity of acous-tic vibration is shown in Figure 2c.Although each data point corresponds to the measurement at different frequencies,theFigure 1.(a )Schematic diagram showing the experimental setup for driving a SWG using a sonic wave.(b )Impact velocity at the tip of the alumina rod at 100Hz,showing the harmonic mechanical input to the nanogenerator.(c,d )Open-circuit voltage and the short-circuit current output from the SWG when it is triggered by a sound wave at 100Hz.The inset is an enlarged plot of the outputsignal.linear relationship is clearly revealed.The electric energy output is estimated as P electric =V 3I ,and the acoustic power at the end surface of alumina rod is estimated to be P acoustic =Z 3v 23A ,where V ,I ,Z ,v ,and A are the voltage output,current output,acoustic impedance (40.6Â106kg/(s 3m 2)for alumina ),impact velocity,and lateral cross section area of the ZnO wire,respectively.The ZnO wire is ∼800nm in diameter and ∼100μm in length.The acoustic power trans-ferred to the ZnO wire is significantly decreased due to the damping effect of the substrate and the reflection and absorp-tion at the interface.However ,the plot of P electric versus P acoustic in Figure 2d can still qualitatively reveal the perfor-mance of the SWG.The acoustic power varies over several orders of magnitude at different frequencies.The linear relationship between the NG output electric power and the acoustic power is clearly demonstrated in Figure 2d.Conse-quently ,the energy conversion can be realized over a wide range of frequencies and a wide range of stimuli magnitudes.Hybrid Cell for Concurrent Harvesting of Sound and Solar Energies.The next step for us is to demonstrate that a HC simultaneously harvests sound and solar energies.For the sound-driven NG to be used as the basic structure of the HC,we used aligned nanowires because they are easy to inte-grated with the structure of the solar cell (SC ).Our HC is based on a structure of vertical NW array integrated NG (VING )with the infiltration of QDs among the NW forest.The vertically aligned NWs are responsible for the harvesting of sound energy ,and the CdS (n -type )/CdTe (p -type )nanoparticles are responsible for harvesting solar energy .The vertically aligned NWs were grown by a solution-based approach at low temperature.16The nanoparticles were infiltrated by the spin-casting method.11Both scanning electron microscopy (SEM )and transmission electron microscopy (TEM )images (see also Figure S2in Supporting Information (SI ))clearly show the “composite ”structure of the NWs and the QDs (Figure 3a and b ).By the spin-casting method,we could obtain a relatively uniform QD layer,leaving the top end of ZnO NWs for the electric contact afterward (Figure 3b ).To fabricate the bottom Au electrode,the RF sputtering method was implemented with the shadow mask technique (see the details in Experimental Methods in SI ).Since our HC was composed of a pn-heterojunction of QDs and vertical NW arrays in contact with different metals such as ITO (top electrode )and Au (the bottom electrode ),the I -V curve was found to be asymmetric,with the lowest resistance of ∼0.1M Ω,as shown in Figure 3c.We first investigated acoustic-driven output from the VING.By applying a sound wave,a periodic force produced a short-circuit current or an open-circuit voltage.Figure 3d presents the short-circuit current and open-circuit voltage of the VING driven by the acoustic vibration at a frequency of 50Hz.It shows that the current output was from ∼22to 45nA and the corresponding generated voltage was ∼1.5-6.0mV.VING also followed the frequency of 50Hz (insets of Figure 3d ),which is the same as those of the applied acoustic wave.The linear superposition of both the current and voltage was conducted to rule out any artificial signal output and to examine large-scale integration for a practical application.17,18Figure 2.(a )Ratio of the SWG open-circuit voltage and the applied mechanical impact velocity as a function of the driving frequency.(b,c )Voltage and current output from the SWG which is driven by acoustic vibration at different impact velocity.(d )Electric power output from the SWG which is driven by acoustic vibration with different acousticpower.Since our hybrid devices with an average area of ∼0.25cm 2can vibrate in the same phase under identical acoustic waves with areas of ∼10cm 2,we could observe the integratedcurrent and voltage using two relatively small devices with areas of ∼0.5cm 2in parallel and serial connections,respec-tively .In the case of voltage superposition,the voltage outputFigure 3.(a )Scanning electron microscopy image of the as-grown vertical ZnO NW array on a PETsubstrate with an ITO conductive layer.(b )Scanning electron microscope image of ZnO NWs after infiltrating with CdS/CdT e quantum dots.The clustering of the nanowires is likely due to the surface tension in spin coating.(c )I -V characteristic of a hybrid device using ZnO nanowires and CdS/CdT e QDs,whose structure is shown in the inset.(d )Open-circuit voltage (bottom )and the short-circuit current (top )output from the VING when the acoustic wave is applied to the generator at a frequency of ∼50Hz.Insets show the details of generated wave shapes in current and voltage output.It matches well with acoustic vibration of the transducer.(e )Linear superposition test of open-circuit voltages in serial connection of two HCs.Cell 1(green curve )and Cell 2(red curve )show the peak-to-peak voltage outputs of ∼3and ∼7mV ,respectively.In serial connection of Cell 1and Cell 2,the peak-to-peak voltage output reaches ∼10mV .(f )Linear superposition test of short-circuit currents in parallel connection of two HCs.Cell 1(green curve )and Cell 2(red curve )show the peak-to-peak current outputs of ∼25nA and ∼48nA,respectively.In parallel connection of Cell 1and Cell 2,the peak-to-peak current output reaches ∼69nA.of each HC was measured individually under the same condi-tions;thereafter,each cell was connected in serial and testedagain.Figure3e shows the voltage outputs from our HC inindividual and serial connection.Cell1and Cell2showed peak-to-peak NG output voltages V of∼3and∼7mV in theopen circuit,respectively(Figure3e,green and red curve).After the two generators were connected in serial,the peak-to-peak output voltage added up to an average of∼10mV (Figure3e,black curve).Also,by connecting two individual cells in parallel,the output current exhibits a sum of the twocells(Figure3f).A single sound generator of Cell1showed peak-to-peak NG output current I of∼25nA in a short circuit, and the sound generator of Cell2gave a peak-to-peak current I of∼48nAunder the same acoustic wave.After two generators were connected in parallel,the peak-to-peak output current added up to an average of∼69nA(Figure3f,black curve).On the basis of superposition of the voltage and current signal outputs using two devices,our device can generate resonant signal outputs capable of being added up as long as the acoustic source is large enough to excite any of those devices in a synchronized manner.We also tested the concurrent-energy-harvesting perfor-mance of our composite HC under the both acoustic wave andsimulated solar illumination.The schematic diagram of our hybrid device is shown in Figure4a,depicting different incoming energy sources.Acoustic waves are applied to HC in the direction from the bottom Au electrode,while the light source illuminates the embedded pn-heterojunction based on CdS/CdTe QDs through the transparent PET layer(300μm) with conductive ITO electrode(50nm).All components that we need can be packaged in a single volume for efficient use of space.For simplicity,we can assume that the HC has two indivi-dual generators in parallel,as shown in the band diagram in Figure4b.SC and VING correspond to upper and lower diagrams,respectively.In the case of SC,it is supposed to generate direct current(DC)flow.Under sunlight illumination, the light passes through transparent upper structures of our HC as well as the CdS layer placed underneath(Figure4a and b). CdS QDs are known to be a transparent window against the sunlight with a wavelength around∼550nm because of its wide band gap of∼2.4-4eV depending on its dimen-sion.Considering its size of∼8nm used here(Figure S2in SI), it can be more transparent due to quantum confinement effects.19,20On the other hand,CdTe QDs have a narrower band gap of∼1.45eV21and have served as the light absorp-tion layer.22The absorbed photons generate electrons and holes in the conduction and valence bands of CdTe QDs, respectively.Due to the established built-in potential at the interface of the CdTe/CdS pn-junction,electrons and holes are forced to be separated completely and accumulated in CdS and CdTe QDs,respectively.A difference in Fermi levels at the two electrodes will drive the accumulated electrons in CdS QDs to flow toward the top ITO electrode,while accumulated holes in CdTe flow toward the bottom Au electrode.Therefore, a DC output is created under constant solar illumination.In case of VING,however,it generates alternating current (AC)output in synch with an external acoustic waveform,as we observed in Figure3d.Assume that the ZnO NW is under the compressive strain(Figure4b,red arrow and line).In this case,NWs have an elevated piezopotential near the bottomAu electrode.An elevated inner potential of NWs driveselectron flow toward the external load from the bottom Au electrode,with consideration of the presence of a Schottkybarrier at the interface.23When the NWs are under tensilestrain(Figure4b,blue arrow and line),the polarity of thepiezopotential is reversed,which drives electron flow toward the external load from the top ITO electrode.As a proof of concept,Figure4c shows the measuredcurrent signal with our HC.When the acoustic wave is applied through the bottom Au electrode,we can obtain AC outputwith a peak-to-peak current of∼24nA and voltage of∼1mV (see also Figure S3in SI)scavenged by VING in the HC.AC output can be understood by our explanation previouslypresented in the band diagram of VING(Figure4b,lowerband diagram).The output power density of VING can becalculated from the AC power(P=V rms2/R L oad)divided by the area of the device.First,the output power of VING is directly obtained from the measured voltage drop in an external load with a resistance of∼0.1MΩ(see Figure S4in SI).The measured voltage drop reaches∼0.5mV,representing the AC output power density of∼5pW/cm2.To measure the output signal of the SC in the HC structure(see Experimental Methods in SI),we utilized a solar simulator with an air mass 1.5global(AM1.5G).When simulated light illuminated our HC,DC output was observed,as we explained the detailed procedure previously(Figure4b,upper band diagram). According to the I-V curve under solar simulation(inset in Figure4c),the short-circuit current I SC and the open-circuit voltage V OC were found to be∼57nA and∼6mV,respec-tively.The DC power density from our SC exhibited∼97pW/ cm2,with a fill factor of∼0.29.We also measured the signal from VING under solar illumination to test its UV response, which can affect the output power of the SC in our hybrid device.It was found to be smaller signals compared to signals from SC(see Figure S5and S6in SI).Note that the perfor-mance of the VING and SC here are not optimum.However,as a proof of our concept,we could obtain the superimposed signal output by applying an acoustic wave concurrently with a sunlight illumination(Figure4c,yellow area).Concurrent output of SC(DC)and VING(AC)showed the sum-up of the two individual output signals.It indicates that two generators can work individually or simultaneously for harvesting one or two types of energy.The superimposed AC and DC output signals from the HCcan be separated.In this experiment,one capacitor was added right in front of the preamplifier,which allowed AC to pass through it,while the DC output was stored in it.First,the observation of the single AC signal from VING was tested in a capacitor-connected circuit.Four HCs were connected in parallel and showed an AC output of∼100nA under acoustic vibration(Figure4d).The AC signal passed the capacitor and showed almost the same amplitude as that before passing the capacitor(∼3300μF)(see also Figure S7in SI).To test the separation of AC and DC outputs,we applied the simulated sunlight together with acoustic vibration to the HC.When simulated sunlight illuminated the device,the generated DC charges started to be accumulated in the capacitor(7-17s inFigure4.(a)Schematic diagram depicting a hybrid device with two different incoming energy sources.Simulated sunlight illumination and acoustic vibration are delivered through the top PET/ITO layer and the bottom Au electrode,respectively.(b)The energy band diagram of the hybrid device shows electron flows under sunlight illumination and acoustic vibration.Upper and lower schemes correspond to SC and VING, respectively.(c)Short-circuit current output signal of the HC.Acoustic wave applied to the HC before/during/after solar illumination.Inset shows the I-V characteristic of a hybrid device under sunlight illumination.(d)Short-circuit current output signal of the HC after connecting a capacitor right in front of the preamplifier.A capacitor used here for demonstrating the separation of AC and DC output from the HC for their individual applications.From0to7s,the acoustic wave was on;over7-17s,it generated DC by HC and was stored in the capacitor;over17-22.5s,it filtered the AC output when the solar part was acting;from22.5to32.5s,the solar light was turned off resulting in the discharge curve of the capacitor for the stored DC charges;over32.5-40s,there was continuous AC output by the acoustic wave when the solar light was off.Figure4d,first blue area).While the DC power was charging the capacitor,we could obtain clean AC output from VING by the filtering of the capacitor(17-22.5s in Figure4d).The separated clean AC signal could be utilized as an energy source to power small electronics,as reported previously.18By turning off the simulated sunlight,we observed the discharging curve of the capacitor(22.5-32.5s in Figure4d,second blue area). Significantly,this simple demonstration implies that the AC and DC signals from our hybrid cell can be stored individually after their generation by the HC for different applications.It is important to note that the efficiency of the SC part here is not optimum,but our purpose is to demonstrate an approach for integrating SC and NG into a single device.Our goal is to explore the possible approaches that can achieve HCs.Therefore,in the near future,one can build a more sustainable energy-harvesting system that can harvest energy even in the absence of light.In summary,we have demonstrated a systematic study of energy conversion using the SWG driven by acoustic vibration in the frequency range of35to1000Hz,which is the common sound noise in human life.The electricity produced by the SWG is linearly proportional to the input acoustic energy, while the frequency does not affect the performance of the SWG in this study.By infiltrating CdS/CdTe quantum dots among vertical nanowires,we have fabricated a hybrid cell that harvests both sound and solar energies.Since our solar sound generator utilizes the two most common types of energy in our surroundings,it can be a promising approach for driving portable electronics.Furthermore,our composite strategy of NWs and QDs will give an insight into the design of a hybrid device for future applications.SUPPORTING INFORMA TION A VAILABLE Materials for supporting the conclusions and discussions presented in the main text,including the experimental methods,characterization of QDs, voltage,current,and power output,and response of VING and QDs under solar simulation.This material is available free of charge via the Internet at .AUTHOR INFORMATIONCorresponding Author:*To whom correspondence should be addressed.E-mail:zhong. wang@.Author Contributions:†These authors contributed equally. ACKNOWLEDGMENT Research was supported by BES DOE (DE-FG02-07ER46394),NSF(DMS0706436,CMMI0403671),National Institute For Materials,Japan(Agreement DTD1Jul.2008),and Korea Electronic Technology Institute(KETI).Z.L.W.acknowledges the partial support from the W orld Class University Program from UNIST,Korea. The authors thank Dr.Yong Ding for his help on TEM characterization of quantum dots.REFERENCES(1)Tian,B.;Zheng,X.;Kempa,T.J.;Fang,Y.;Yu,N.;Yu,G.;Huang,J.;Lieber,C.M.Coaxial Silicon Nanowires as SolarCells and Nanoelectronic Power Sources.Nature2007,449, 885–890.(2)Wang,Z.L.Self-Powered Nanotech.Sci.Am.2008,298,82–87.(3)Dresselhaus,M.S.;Thomas,I.L.Alternative Energy Techno-logies.Nature2001,414,332–337.(4)Wang,Z.L.Towards Self-Powered Nanosyatems:From Nano-generators to Nanopiezotronics.Adv.Funct.Mater.2008,18, 3553–3567.(5)Hong,K.-S.;Xu,H.;Konishi,H.;Li,X.Direct Water SplittingThrough Vibrating Piezoelectric Microfibers in Water.J.Phys.Chem.Lett.2010,1,997–1002.(6)Xu,C.;Wang,X.;Wang,Z.L.Nanowire Structured Hybrid Cellfor Concurrently Scavenging Solar and Mechanical Energies.J.Am.Chem.Soc.2009,131,5866–5872.(7)Hansen,B.J.;Liu,Y.;Yang,R.;Wang,Z.L.Hybrid Nanogen-erator for Concurrently Harvesting Biomechanical and Bio-chemical Energy.ACS Nano2010,4,3647–3652.(8)Wang,X.;Song,J.;Liu,J.;Wang,Z.L.Direct-Current Nano-generator Driven by Ultrasonic Waves.Science2007,316, 102–105.(9)Yang,R.;Qin,Y.;Dai,L.;Wang,Z.L.Power Generation withLaterally-Packaged Piezoelectric Fine Wires.Nat.Nanotech-nol.2009,4,34–39.(10)Yang,R.;Qin,Y.;Li,C.;Zhu,G.;Wang,Z.L.ConvertingBiomechanical Energy into Electricity by a Muscle-Movement-Driven Nanogenerator.Nano Lett.2009,9,1201–1205. (11)Gur,I.;Fromer,N.A.;Geier,M.L.;Alivisatos,A.P.Air-StableAll-Inorganic Nanocrystal Solar Cells Processed from Solu-tion.Science2005,310,462–465.(12)Roundy,S.;Leland,E.S.;Baker,J.;Carleton,E.;Reilly,E.;Lai,E.;Otis,B.;Rabaey,J.M.;Wright,P.K.;Sundararajan,V.Improving Power Output for Vibration-based Energy Scaven-gers.IEEE put.2005,4,28–36.(13)Wang,Z.L.;Song,J.Piezoelectric Nanogenerators Based onZinc Oxide Nanowire Arrays.Science2006,312,242–246.(14)Wang,X.;Liu,J.;Song,J.;Wang,Z.L.Integrated Nanogen-erators in Biofluid.Nano Lett.2007,7,2475–2479.(15)Qin,Y.;Wang,X.;Wang,Z.L.Microfibre-Nanowire HybridStructure for Energy Scavenging.Nature2008,451,809–813.(16)Vayssieres,L.Growth of Arrayed Nanorods and Nanowires ofZnO from Aqueous Solutions.Adv.Mater.2003,15,464–466.(17)Yang,R.;Qin,Y.;Li,C;Dai,L.;Wang,Z.L.Characteristics ofOutput Voltage and Current of Integrated Nanogenerators.Appl.Phys.Lett.2009,94,022905.(18)Xu,S.;Qin,Y.;Xu,C.;Wei,Y.;Yang,R.;Wang,Z.L.Self-PoweredNanowire Devices.Nat.Nanotechnol.2010,5,366–373. (19)Singh,V.P.;Singh,R.S.;Thompson,G.W.;Jayaraman,V.;Sanagapalli,S.;Rangari,V.K.Characteristics of Nanocrystal-line CdS Films Fabricated by Sonochemical,Microwave and Solution Growth Methods for Solar Cell Applications.Sol.Energy Mater.Sol.Cells2004,81,293–303.(20)Alivisatos,A.P.Perspectives on the Physical Chemistry ofSemiconductor Nanocrystals.J.Phys.Chem.1996,100, 13226–13239.(21)Britt,J.;Ferekides,C.Thin-Film CdS/CdTe Solar Cell with15.8%Efficiency.Appl.Phys.Lett.1993,62,2851–2852. (22)Singh,V.P.;McClure,J.;Lush,G.B.;Wang,W.;Wang,X.;Thompson,G.W.;Clark,E.Thin Film CdTe-CdS Heterojunc-tion Solar Cells on Lightweight Metal Substrates.Sol.Energy Mater.Sol.Cells1999,59,145–161.(23)Wang,Z.L.Piezotronic and Piezophototronic Effects.J.Phys.Chem.Lett.2010,1,1388–1393.。