香港地区社会经济发展统计年鉴指标数据:13.13 医院管理局专职医疗服务的统计数字(2008-2018)
合集下载
中国统计年鉴2020香港特区社会经济发展指标:26-42 货币供应量

26-42 货币供应量
单位:亿港元(年底数字) 项目
2015
2016
2017
2018
法定纸币及硬币的流通量 由商业银行发行 由政府发行 总计
由认可机构持有的法定纸币 及硬币 由公众持有的法定纸币及 硬币 货币供应量:就外币掉期存 款作出调整 货币供应量 M1
港元 外币 总计 货币供应量 M2 港元① 外币② 总计 货币供应量 M3 港元① 外币② 总计 货币供应量:未就外币掉期 存款作出调整 货币供应量 M2 港元 外币 总计
72624.51 70856.08 143480.59
57787.72 58762.47 116550.19
62926.66 62586.65 125513.31
70245.14 67793.24 138038.37
72843.22 71193.67 144036.88
57655.01 58529.40 116184.41
62801.87 62279.40 125081.27
70102.79 67449.77 137552.55
72624.26 70856.33 143480.59
货币供应量 M3 港元 外币 总计
57787.25 58762.95 116550.19
62926.22 62587.08 125513.31
3601.65 116.61
3718.26
4077.95 122.53
4200.48
4557.15 124.39
4681.54
4838.45 128.45
4966.90
224.86
295.78
294.00
301.51
3493.40
3904.70
中国统计年鉴2019香港社会经济发展指标:支出法本地生产总值

67 40649
8183 5817 25095 344179
2016
16499 2480 5352 4
38929 40226
7648 5781 24906 339478
16915 2542 5595 5
39575 40936
7897 5933 25641 349498
注:① 货物出口及进口与服务 出口及进口数字,是根据《2008
及转手商贸活动编制而 成的。
②以环比物量计算的本地生 产总值及其组成部分的参照年,
不会影响其变动率。整体 物量数值与其组成部分相加的总
2017
2018
17855 2615 5760 110
42128 43913
8129 6055 26628 360247
26-13 支出法本地生产总值
单位:亿港元,另有注明除外 本地生产总值组成部分
2014
按当年价格计算 私人消费开支 政府消费开支 固定资本形成总额 存货增减 货物出口(离岸价)① 减:货物进口(离岸价)① 服务出口① 减:服务进口①
本地生产总值 人均本地生产总值(港元) 按2017年环比物量计算②
私人消费开支 政府消费开支 固定资本形成总额 存货增减 货物出口(离岸价)① 货物进口(离岸价)① 服务出口① 服务进口① 本地生产总值 人均本地生产总值(港元)
17855 2615 5760 110
42128 43913
8129 6055 26628 360247
19426 2810 6116 59
44613 47156
8914 6353 28429 381544
18836 2724 5877 72
43664 46076
8526 6194 27428 368110
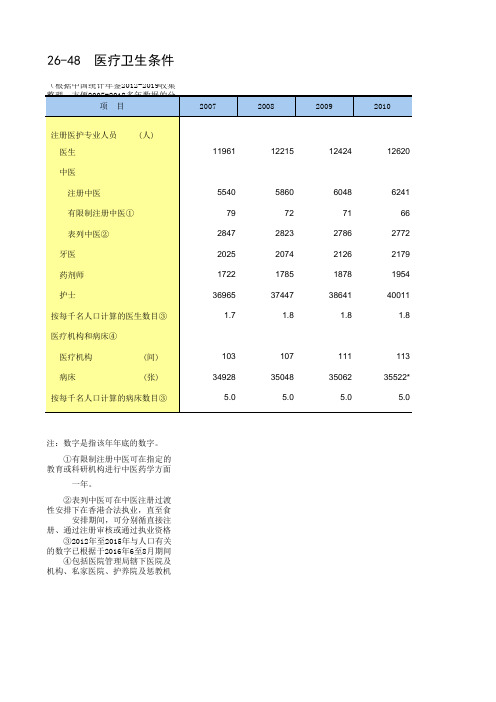
26-48 香港统计年鉴数据处理:医疗卫生条件(便于2007-2018多年数据分析对比)
6743 61
2715 2310 2285 45846
1.8
127 36720
5.1
13417
6898 64
2693 2343 2390 48047
1.8
130 37322
5.1
13726
7071 55
2661 2382 2504 50461
1.9
133 38287
5.2
2016
2017
2018
14013
107 35048
5.0
111 35062
5.0
113 35522*
5.0
注:数字是指该年年底的数字。
①有限制注册中医可在指定的 教育或科研机构进行中医药学方面
一年。
②表列中医可在中医注册过渡 性安排下在香港合法执业,直至食
安排期间,可分别循直接注 册、通过注册审核或通过执业资格
③2012年至2015年与人口有关 的数字已根据于2016年6至8月期间
11961
12215
12424
12620
5540 79
2847 2025 1722 36965
1.7
5860 72
2823 2074 1785 37447
1.8
6048 71
2786 2126 1878 38641
1.8
6241 66
2772 2179 1954 40011
1.8
103 34928
5.0
④包括医院管理局辖下医院及 机构、私家医院、护养院及惩教机
2011
2012
2013
2014
2015
12818
6414 70
2746 2215 2050 41310 1.8#
香港地区社会经济发展统计年鉴指标数据:9.11 按房屋类型划分的家庭住户数目(2008-2018)

(2) 數字包括私人房屋、香港房屋協會的市區改善計 劃下興建的屋宇單位、別墅/平房/新型村屋、 簡單磚石蓋搭建築物及非住宅樓宇內的屋宇單 位。可在公開市場買賣的資助出售單位亦包括在 內。
(3) 臨時房屋包括公營臨時房屋及私營臨時房屋。
Notes : Figures are compiled based on data collected in the General Household Survey from January to December of the year concerned as well as the mid-year population estimates.
(2) Figures include private housing blocks, flats built under the Urban Improvement Scheme of the Hong Kong Housing Society, villas/bungalows/modern village houses, simple stone structures and quarters in non-residential buildings. Subsidised sale flats that can be traded in open market are also put under this category.
(1) Subsidised home ownership housing includes flats built under the Home Ownership Scheme, Middle Income Housing Scheme, Private Sector Participation Scheme, Green Form Subsidised Home Ownership Scheme, Buy or Rent Option Scheme and Mortgage Subsidy Scheme, and flats sold under the Tenants Purchase Scheme of the Hong Kong Housing Authority. It also includes flats built under the Flat-for-Sale Scheme, Sandwich Class Housing Scheme and Subsidised Sale Flats Projects of the Hong Kong Housing Society; and flats in Urban Renewal Authority Subsidised Sale Flats Scheme. Subsidised sale flats that can be traded in open market are excluded.
香港地区社会经济发展统计年鉴指标数据:4.14 国际收支平衡:经常账户(2008-2018)

9,374
-4,066,527
234,603 808,948 230,876 280,227
10,143
-4,022,579
186,733 764,839 218,687 254,962
11,218
-4,391,306
207,431 812,937 237,426 259,817
11,050
93,425 101,528 -565,399 -198,365 -128,948 -125,326
3,986,769 226,388
79,553 5,982,280
-5,902,727 -177,302
3,889,225 216,757
98,664 5,941,701
-5பைடு நூலகம்843,037 -129,693
3,892,886 220,974
123,900 6,460,687
-6,336,787 -178,532
表
國
4T
際B
a
a
標 經 常貸
方 借 方貨
物貸 方其 中 活 借淨
服方 務貸
方運 輸 旅 遊 保 險 金服 融 其
借他 方製
造 運 輸 旅 遊 保 險 金服 融 其 他 初 次貸 方投 資直 接 證 券 其 他 儲 僱備 借員 方投 資直 接 證 券 其 僱他 二員 次貸 方借 方
註釋: 根據編製國際收支平衡的會計常規,經常賬戶差額的正Notes:Inacordancewitheacountigrulesadoptedincompilng 數值顯示盈餘而負數值則顯示赤字。 BalnceofPayments,apositvealueforthebalncefigureinthe
香港社会经济发展统计数据:13.8 已呈报的传染病的呈报率及死亡率(2008-2018)

Notes :
Notification rate refers to the number of no disease cases known to the Department of He per 100 000 population of that year.
0.12
0.01
60.59
0.43
0.62
3.63
0.69
–
* 229.79
*
表
已
1T
((c續on)t’ 呈N
a
d)
o
病 類死 亡
水 社區型耐甲氧西林
金黃葡萄球菌感染 克 腸 食 物 乙型流感嗜血桿菌感染
(侵入性) 侵 日 退 李 瘧 腦 新 鸚 狂 豬 結 傷 斑 病 總
Disease Death Rate
風疹(德國麻疹)及 猩先天性風疹綜合症 紅 產 志
豬 鏈 破 傷 結 核 傷 寒 斑 疹 病 毒 百 日 寨 卡 總 計
D
iN
oA
mB
aB
oC
hC
hC
hC
o CStaphylococcus aureus infection
rD
eE
P
Haemophilus influenzae type b Hinfection (invasive) aI nJ aL eL eL eL iM aM eM e M uN oP aP sQ fR a
C Community-associated methicillin-
Staphylococcus aureus infection C EF
o Haemophilus influenzae type b
infection (invasive) I J L L M M N P R S T T T V T
- 1、下载文档前请自行甄别文档内容的完整性,平台不提供额外的编辑、内容补充、找答案等附加服务。
- 2、"仅部分预览"的文档,不可在线预览部分如存在完整性等问题,可反馈申请退款(可完整预览的文档不适用该条件!)。
- 3、如文档侵犯您的权益,请联系客服反馈,我们会尽快为您处理(人工客服工作时间:9:00-18:30)。
109 162 35 226 73 936
115 932 35 753 80 179
122 292 36 954 85 338
213 126 149 092
64 034
282 941 208 659
74 282
309 800 232 059
77 741
342 875 262 520
80 355
373 386 285 967
99 803 7 293
87 419
394 831 306 554
88 277
46 279 9 433
36 846
69 846 8 347
61 499
75 555 9 231
66 324
86 387 11 165 75 222
90 505 11 130 79 375
97 195 11 672 85 523
73 248 8 759
PO rT
o I
SO pT
o I
CO li T
o I
DO iT
o I
PO oT
o I
AO uT
o I
OO pT
o I
OO rt T
o I
MO eT
o I
JO oT
o
2008
2013
2014
2015
2016
2017
3 177 054 3 698 719 3 866 719 4 029 634 4 228 420 4 423 321 2 144 705 2 474 646 2 615 343 2 722 563 2 867 875 3 002 980 1 032 349 1 224 073 1 251 376 1 307 071 1 360 545 1 420 341
2018
4 581 316 3 148 716 1 432 600
2 394 071 1 847 401
546 670
217 227 97 130
120 097
301 512 243 4பைடு நூலகம்1
58 111
130 562 39 475 91 087
409 493 315 738
93 755
108 669 14 178 94 491
(1) 數字不包括視光及視覺矯正部與醫生會診的個 案。
(2) 醫務社工服務的門診病人人次不包括跟進個案。
(1) Figures exclude joint clinical consultations provided by the Optometry and Orthoptics Department and doctors.
64 489
82 934 7 454
75 480
82 853 8 419
74 434
85 442 7 812
77 630
90 564 8 126
82 438
93 227 7 731
85 496
38 758 2 305
36 453
77 653 2 901
74 752
83 816 2 860
80 956
1 528 883 1 912 925 1 996 686 2 079 097 2 206 937 2 288 760 1 186 414 1 445 897 1 515 682 1 579 986 1 690 711 1 764 360
342 469 467 028 481 004 499 111 516 226 524 400
(2) Outpatient attendance figures for medical social service exclude follow-up consultations.
資料來源: 醫院管理局
Source : Hospital Authority
索引 Index
就診人次 Number of
178
註釋: 住院病人人次包括日間住院病人人次。
Notes : Inpatient attendances include day inpatient attendances.
門診病人人次不包括日間醫院病人人次。
Outpatient attendances exclude day hospital patient attendances.
90 450 2 745
87 705
91 632 2 658
88 974
99 249 2 566
96 683
37 788 653
37 135
42 618 933
41 685
46 096 846
45 250
48 569 806
47 763
46 542 553
45 989
50 140 399
49 741
(2) Outpatient attendance figures for medical social service exclude follow-up consultations.
資料來源: 醫院管理局
Source : Hospital Authority
案。 (2) 醫務社工服務的門診病人人次不包括跟進個案。
44 499
217 984 170 154
47 830
245 181 191 821
53 360
271 696 214 126
57 570
289 419 231 547
57 872
61 155 19 562 41 593
95 652 32 905 62 747
99 953 33 378 66 575
438 771 333 041 105 730
398 759 295 942 102 817
395 062 292 189 102 873
424 927 309 664 115 263
435 671 304 710 130 961
443 343 303 943 139 400
103
96
126
67
60
100 430 34 955 65 475
142 134 51 306 90 828
152 509 55 685 96 824
170 711 68 479
102 232
194 373 83 045
111 328
206 384 91 584
114 800
152 202 118 840
33 362
202 867 158 368
表
醫
1T
院St
a
ati
物 理就
診住 院 門
職診 業就
診住 院 門
義診 肢就
診住 院 門
言診 語就
診住 院 門
臨診 床就
診住 院 門
營診 養就
診住 院 門
足診 病就
診住 院 門
聽診 力就
診住 院 門
視診 光就
診住 院 門
視診 覺就
診住 院 門
醫診 務就
診住 院 門
專診 職門
診
P hT
o I
OO cT
o I