大学物理演示实验-英文版
大物演示实验之飞机升力 英文版
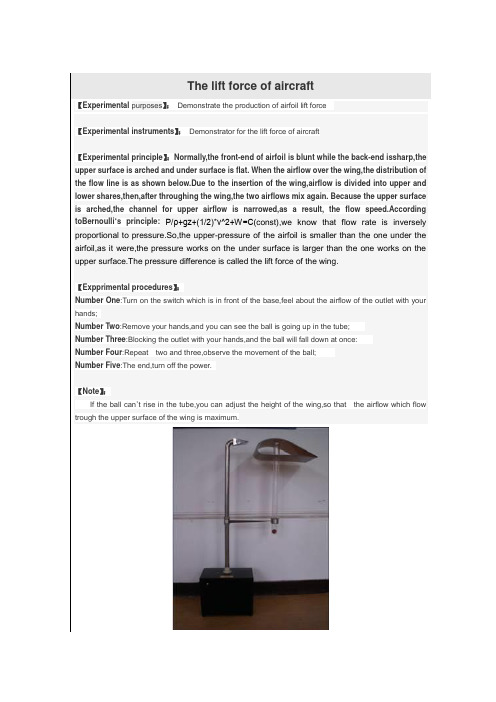
The lift force of aircraft【Experimental purposes】:Demonstrate the production of airfoil lift force【Experimental instruments】:Demonstrator for the lift force of aircraft【Experimental principle】:Normally,the front-end of airfoil is blunt while the back-end issharp,the upper surface is arched and under surface is flat. When the airflow over the wing,the distribution of the flow line is as shown below.Due to the insertion of the wing,airflow is divided into upper and lower shares,then,after throughing the wing,the two airflows mix again. Because the upper surface is arched,the channel for upper airflow is narrowed,as a result, the flow speed.According toBernoulli’s principle:P/ρ+gz+(1/2)*v^2+W=C(const),we know that flow rate is inversely proportional to pressure.So,the upper-pressure of the airfoil is smaller than the one under the airfoil,as it were,the pressure works on the under surface is larger than the one works on the upper surface.The pressure difference is called the lift force of the wing.【Expprimental procedures】:Number One:Turn on the switch which is in front of the base,feel about the airflow of the outlet with your hands;Number Two:Remove your hands,and you can see the ball is going up in the tube;Number Three:Blocking the outlet with your hands,and the ball will fall down at once:Number Four:Repeat two and three,observe the movement of the ball;Number Five:The end,turn off the power.【Note】:If the ball can’t rise in the tube,you can adjust the height of the wing,so that the airflow which flow trough the upper surface of the wing is maximum.。
大学物理课件英文版课件,现代物理An Aperitif of Modern Physics
3
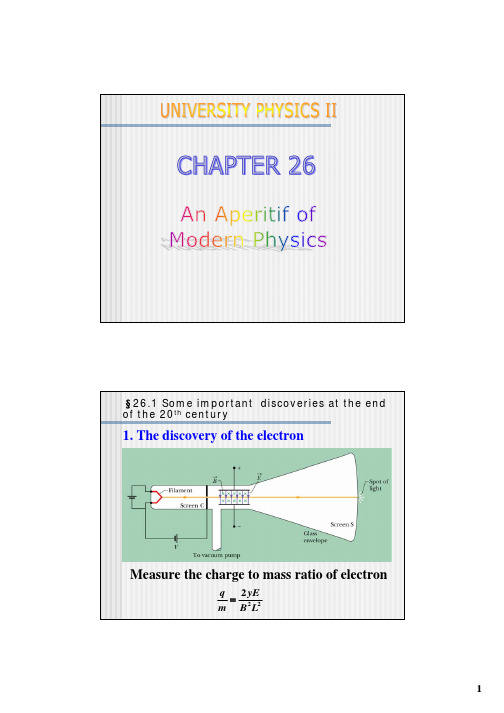
§26.1 Some important discoveries at the end of the 20th century
2. The discovery of X-rays
§26.1 Some important discoveries at the end of the 20th century
J. J. Thomson’s original tube
2
§26.1 Some important discoveries at the end of the 20th century
a. Measured the charge of the cathode rays; b. Make a static electric deflection of the cathode rays; c. Measured the charge to mass ratio of the cathode rays; d. Prove the universal existence of the electron. The charge to mass ratio of electron
Radioactivity occur naturally and have with us on the earth from the very beginning. Henri Becquerel discovered Uranium, Marie Curie discovered Polonium and Radium Ernest Rutherford found that the substances emit several distinct types of radiations. One is a penetrating radiation, dubbed α, that propagates through several centimeters in air and can even penetrate very thin metal foils. Another less penetrating radiation, dubbed β, is easily stopped by even a sheet of paper. Another type, called γ, was discovered in 1900 and is much more penetrating than even the α radiation.
大学物理实验的英语教材
大学物理实验的英语教材University Physics Laboratory: English TextbookIntroduction:The aim of this English textbook is to provide comprehensive guidance and instructions for university physics laboratory experiments. The textbook covers a wide range of topics, including fundamental laws and principles, experimental techniques, data analysis, and safety precautions. By following this textbook, students will enhance their laboratory skills, develop a deeper understanding of physics concepts, and improve their English proficiency.Chapter 1: Introduction to Laboratory Equipment1.1 Laboratory Safety1.2 Basic Laboratory Equipment1.2.1 Glassware and Containers1.2.2 Measuring Instruments1.2.3 Electrical Equipment1.2.4 Advanced EquipmentChapter 2: Measurement Techniques2.1 Units and Dimensions2.2 Uncertainty and Error Analysis2.3 Measurement Tools and Techniques2.3.1 Length Measurement2.3.2 Time Measurement2.3.3 Mass Measurement2.3.4 Temperature Measurement2.3.5 Other Important MeasurementsChapter 3: Experiments on Mechanics3.1 Introduction to Mechanics3.2 Experimental Procedures for Newton's Laws3.2.1 Experiment 1: Force and Motion3.2.2 Experiment 2: Frictional Forces3.3 Experiment on Gravitation3.3.1 Experiment 3: Gravitational Force and Acceleration due to Gravity 3.4 Experiment on Simple Harmonic Motion3.4.1 Experiment 4: Pendulum MotionChapter 4: Experiments on Optics4.1 Introduction to Optics4.2 Experiments on Geometrical Optics4.2.1 Experiment 5: Reflection4.2.2 Experiment 6: Refraction4.3 Experiments on Wave Optics4.3.1 Experiment 7: Interference of Light4.3.2 Experiment 8: Diffraction of LightChapter 5: Experiments on Electricity and Magnetism 5.1 Introduction to Electricity and Magnetism5.2 Experiments on DC Circuits5.2.1 Experiment 9: Ohm's Law and Resistors5.2.2 Experiment 10: Kirchhoff's Laws and DC Circuits 5.3 Experiments on Magnetism and Electromagnetism 5.3.1 Experiment 11: Magnetic Fields and Forces5.3.2 Experiment 12: Electromagnetic Induction Chapter 6: Experiments on Modern Physics6.1 Introduction to Modern Physics6.2 Experiments on Atomic and Nuclear Physics6.2.1 Experiment 13: Radioactivity and Half-Life6.2.2 Experiment 14: Atomic Spectra and Energy Levels 6.3 Experiments on Quantum Mechanics6.3.1 Experiment 15: Wave-Particle Duality6.3.2 Experiment 16: Photoelectric EffectChapter 7: Data Analysis and Error Propagation7.1 Data Collection and Recording7.2 Data Analysis Techniques7.3 Graphing and Curve Fitting7.4 Error Propagation and ReportingChapter 8: Laboratory Reports and Presentation8.1 Structure of a Laboratory Report8.2 Writing Style and Language8.3 Presenting Experimental Results8.4 Peer Review and FeedbackConclusion:This English textbook for university physics laboratory experiments offers a comprehensive guide for students to conduct practical experiments effectively. With a strong emphasis on safety, accurate measurements, data analysis, and clear reporting, the textbook equips students with the necessary skills to excel in the laboratory. By using this textbook, students will enhance their understanding of physics concepts, improve their English proficiency, and become adept researchers in the field of physics.。
Lab-report-物理实验报告(英文)
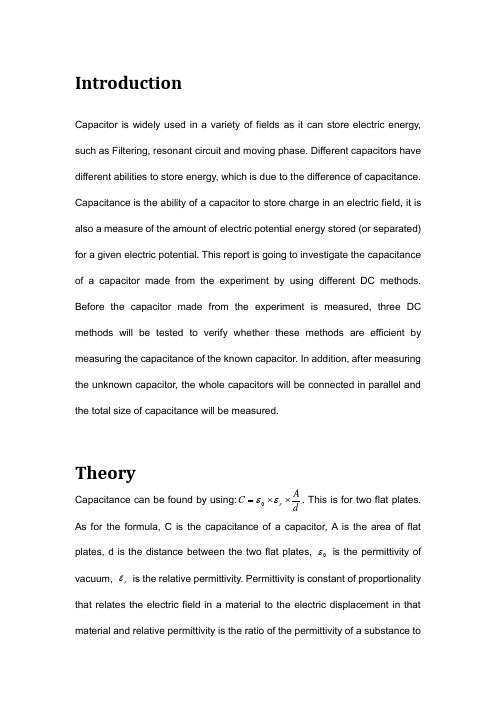
IntroductionCapacitor is widely used in a variety of fields as it can store electric energy, such as Filtering, resonant circuit and moving phase. Different capacitors have different abilities to store energy, which is due to the difference of capacitance. Capacitance is the ability of a capacitor to store charge in an electric field, it is also a measure of the amount of electric potential energy stored (or separated) for a given electric potential. This report is going to investigate the capacitance of a capacitor made from the experiment by using different DC methods. Before the capacitor made from the experiment is measured, three DC methods will be tested to verify whether these methods are efficient by measuring the capacitance of the known capacitor. In addition, after measuring the unknown capacitor, the whole capacitors will be connected in parallel and the total size of capacitance will be measured.Theory Capacitance can be found by using:dA C r ⨯⨯=εε0. This is for two flat plates. As for the formula, C is the capacitance of a capacitor, A is the area of flat plates, d is the distance between the two flat plates, 0ε is the permittivity of vacuum, r ε is the relative permittivity. Permittivity is constant of proportionality that relates the electric field in a material to the electric displacement in that material and relative permittivity is the ratio of the permittivity of a substance tothat of free space or vacuum. Different materials have different relative permittivity, the behind table includes the relative permittivity of some different material:Source: (The Engineering Tool Box, 2011.) When two capacitors are placed in series, the charge on each plate is of equalof charges on plate and V is the voltage across the capacitor). When ais the initial voltage adding on the capacitor, e is a constant and it is 2.718, R is resistance, C is capacitance and 0I is the initial current flowing through the capacitor). Analogously, when a capacitor is discharged, it flows RC t e V V -=0and RC t eI I -=0.MethodsApparatus :Power supply, leads, ruler, calipers, clips, known capacitor, aluminum foil,。
大学物理实验报告英文版--温度传感器
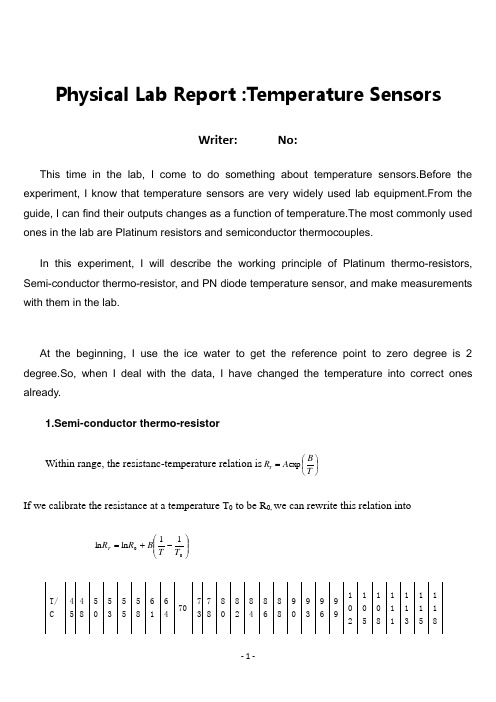
Physical Lab Report :Temperature SensorsWriter: No:This time in the lab, I come to do something about temperature sensors.Before the experiment, I know that temperature sensors are very widely used lab equipment.From the guide, I can find their outputs changes as a function of temperature.The most commonly used ones in the lab are Platinum resistors and semiconductor thermocouples.In this experiment, I will describe the working principle of Platinum thermo-resistors, Semi-conductor thermo-resistor, and PN diode temperature sensor, and make measurements with them in the lab.At the beginning, I use the ice water to get the reference point to zero degree is 2 degree.So, when I deal with the data, I have changed the temperature into correct ones already.1.Semi-conductor thermo-resistorWithin range, the resistanc-temperature relation is ⎪⎭⎫⎝⎛=T B A R T expIf we calibrate the resistance at a temperature T 0 to be R 0, we can rewrite this relation into⎪⎪⎭⎫⎝⎛-+=0011ln ln T T B R R TAfter I change the unit of temperature into K, I use computer to make a linear fit and get a graph as follows:The slope of the line is equal to 1555.6, it means B=1555.6 K.which is a little bit smaller than the reference.2.Platinum thermo-resistorsA platinum resistor has a temperature-resistance relation of ()201TB AT R R T ++=R/Ω 4000 37023473 3106 2868 2544 2303 2101 1744 1569 1343 1282 1212 1146 1089 118967 896 838 773 724 668 624 586 561 538 505T/C27 30 33 36 39 42 45 48 51 54 57 60 63 66 69 72 75 78 83 88 93 98U/ V 0.1150.11830.12120.12350.1260.12830.13030.13210.13410.13620.1380.13970.14130.1430.14460.14650.14790.14940.15160.15410.15620.1583T/C 14 11 8 5 2 0 -2 -4 -6 -7 -8U/V 0.1064 0.10570.10490.10440.10360.1030.10240.10180.10120.10080.1003From the graph ,I get the coefficient of x2 is B=2.8*10-7 o C-2,the coefficient of x is A=6*10-4 C-13.PN diode temperature sensorT/C 35 38 42 45 47 51 53 55 57 59 61 64 66 98 99 101 103U/V 0.470.4620.450.44140.43660.42460.42010.41380.40750.40170.39580.38840.38350.29610.29290.28840.283T/C 69 72 74 76 78 80 83 85 87 88 90 92 94 96 105 106 110Semiconductor diodes begin conducting electricity only if a certain threshold voltage or cut-in voltage is present in the forward direction.The voltage drop across a forward-biased diode varies only a little with the current, and is a function of temperature; this effect can be used as a temperature sensor.Within a given range of temperature, the resistance varies linearly with temperature.U=-0.0025T+0.5425, as the I=100μA,so,R=-25T+5424,the temperature is 25Error analysis:1.The temperature is tested indirectly, so the measured temperature is a little slower or higher than the correct one,If not precise, then our result of the coefficient is not that correct.2.The ice-water is made by human, even its temperature is near 0, however, there still exists some worry weather it is 0 degree.。
英语作文物理电学实验报告

英语作文物理电学实验报告Physics Experiment Report on Electric Circuits。
Introduction。
Electric circuits are important in our daily lives as they form the basis of all electrical devices. In this experiment, we investigated the behavior of electric circuits, including Ohm's law, Kirchhoff's laws, and the behavior of resistors in series and parallel.Materials。
Power supply。
Ammeter。
Voltmeter。
Resistors (varying values)。
Wires。
Breadboard。
Procedure。
1. Set up the circuit as shown in the diagram below, using a breadboard to connect the components.2. Measure the voltage across the resistor using the voltmeter and record the value.3. Measure the current flowing through the resistor using the ammeter and record the value.4. Repeat steps 2-3 for different values of resistors.5. Connect resistors in series and parallel and measure the voltage and current across each resistor.Results。
大学物理实验教案英文版PhysicsManual

⼤学物理实验教案英⽂版PhysicsManualCONTENTSHealth & Safety/Rules i General Introduction ii Marking Scheme iii Writing up your lab report ivSelf Assessment Check-list vIntroductory Lab vi1st Semester ExperimentsExperiment 1-1Newton’s Second Law (16)Experiment1-2Viscosity (20)Experiment1-3Archimedes’ Principle (24)Experiment1-4Acceleration due to gravity (28)Experiment 1-5Young’s Modulus (32)Experiment 1-6Simple Harmonic Motion (36)Experiment1-7 Radioactive Decay (40)Experiment 1-8Freefall (45)Experiment 1-9Centripetal Force (47)Experiment 1-10Transit of Venus to measure 1AU (50)Experiment 1-11The Classification of Stellar Spectra (57)2nd Semester ExperimentsExperiment 2-1Melde’s Experiment (58)Experiment 2-2Sound Waves (63)Experiment 2-3 Wheatstone Bridge (68)Experiment 2-4 Alternating Current (72)Experiment 2-5Basic Electricity (76)Experiment 2-6Grating Spectrometer (80)Experiment2-7Lenses (84)Experiment2-8A Digital Spectrometer.......... .. (90)Experiment2-8B Beta Absorption.......... . (100)Experiment2-9Resonance (104)Appendices 1-6 Background Information ................ . (108)Health and Safety statement for 1st Year LabThe safety of everyone working in the undergraduate laboratories is of prime importance and your co-operation in this matter is obligatory. Laboratories are potentially dangerous environments but the dangers can be minimised and safety ensured if all working there behave in a mature and responsible manner.The Department of Experimental Physics has prepared our own local safety statement, documenting hazards, risks, risk control measures and arrangements, and resources for ensuring a safe and healthy working environment. This document is available in the laboratory to all students, staff and visitors, and you can download this document in pdf format from http://physics.nuim.ie/SafetyStatement.shtml.At the beginning of the first laboratory session, an outline will be given of the material contained in the Department of Experimental Physics Safety Statement. Students should contact the lab supervisor if they did not attend training or if they have any questions in regard to Health & Safety. Please observe the following rules.Be aware of the location of Emergency Exits, Fire Extinguishers and First Aid kits and keep access to these items clear. If the fire alarm is activated there will be a continual ringing of bells throughout the building. Please evacuate the laboratory in an orderly manner and comply with all directions of staff. All staff, students, visitors and contractors in Experimental Physics are required to assemble at Assembly Point G, situated across the road from the entrance closest to Arts Building.Eating, drinking and smoking are strictly forbidden in all laboratories.A penalty of -50% in lab mark for that day will be invoked for failure to comply with instructions in regard to no food/drink in the labAlways co-operate with staff on duty in the laboratory.All accidents, however trivial must be reported to a member of staff immediately who will inform the Head of Department. The University accident report form must be completed without delay and all persons must co operate with the University in any subsequent investigation.Please report any breakages, faulty equipment or any other hazards you may become aware of immediately to the demonstrator or any member of staff.Never use an item of equipment until you know how to operate it. If you are unsure, always ASK a member of staff.Turn off and disconnect electrical equipment from the mains or the 12 V supply when you are finished working. Always leave the apparatus and your workplace, in a safe and tidy condition before leaving the laboratory.Always wash your hands after laboratory work and before eating.Unsupervised work in the laboratories is forbidden. Undergraduate students have no access to laboratories except during scheduled practicals or tutorials.Do not run or play about in laboratories. Anyone not behaving in a mature and responsible manner will be asked to leave and may be excluded from the laboratory.Any student who shows persistent disregard for matters of safety is warned that this is a disciplinary offence, and the matter will be reported to the Laboratory Supervisor and Year Coordinator.Derek Gleeson (Safety Officer) Dept. of Exp Physics, September 2018Laboratory RulesAttendance is mandatory. If you cannot attend a laboratory session, you should notify the year course coordinator/Lab Supervisor — if possible in advance, otherwise as quickly as possible afterwards.You are not allowed to leave the laboratory without showing your final results and analysis to your demonstrator. At the end of the session you should leave your bench tidy for the next user. Switch off and disconnect all apparatus.If your partner is absent you have to do the experiment on your own or speak to demonstrator.Stick to assigned timetableStrictly no eating, drinking, or smoking in the laboratory, but you are allowed to takea brief break during the laboratory session. A penalty of -50% in lab mark for that daywill be invoked for failure to comply with instructions in regard to no food/drink in the labBags must be left at the wall close to the doors to avoid tripping hazard on the floor & to keep the benches clear.Ethical behaviourEvery student is expected and requiredto respect the rights of fellow students and the authority of the University academic and other staff in the performance of their dutiesto observe the rules and regulations of the Universityto conduct themselves in a manner conducive to the academic environment of the University and the promotion of its objectives.PlagiarismPlagiarism is the representation of another person’s work as one’s own, and includes unacknowledged use of material from books or periodicals, from the internet, from teachers and tutors, or from other students, without full acknowledgement of the sources.At all times, and in particular in relation to written reports and assignments, students are expected to comply with the statement on Plagiarism in the NUI Maynooth Calendar: https://www.maynoothuniversity.ie/sites/default/files/assets/document/Plagiarism%20Sept%202015_0.pdfFor the lab, your Continuous Assessment mark is based on your experimental report written in each lab session. Even though you work with a lab partner to carry out the experiment your report should be an independent piece of work written by you and should not be the same report your partner writes. Your conclusions/remarks on the experiment are required and should differ from your partner.GENERAL INTRODUCTIONThe purpose of a laboratory course is:To explore interesting and important physical phenomenato obtain an increased understanding of physical principlesto become familiar with laboratory instrumentsto acquire skill in the manipulation of apparatusto develop skills in observation and in the accurate recording and reporting of resultsExperimentation is the cornerstone of scientific knowledge. A full appreciation of many of the concepts you meet in lectures can only be achieved by exploring their consequences in laboratory experiments. This manual contains detailed instructions for carrying out each experiment; read the section on your next experiment before each session. Some students may have considerable experience of laboratory work, and will feel at home in the lab. In contrast, other students may not have any previous experience at all of doing their own experiments. Those students may find the first few weeks a learning curve: they may have some difficulty completing their experiments in the allotted time, or may find near the end of an experiment that they have misinterpreted the instructions etc. Remember that such ‘disasters’ do not necessarily mean a bad mark for that experiment. Every allowance will be made for initial inexperience and genuine oversight. No allowance will be made for attempts to cover up mistakes or failure to admit mistakes. If you pluck the “right answer” out of thin air you immediately arouse our suspicion. In fact, there is rarely a “right answer”,only well or badly executed experiments. You should make use of the laboratory demonstrators but do not rely on them totally - use your own brains to think your way out of a problem, and ask for help only when you cannot solve the problem yourself. Remember: the lab is a learning experience, not an examination.A good experimental outcome achieved through frequent recourse to the demonstrators will not merit a good mark - it is your contribution that is marked, not that of the demonstrators. Bear in mind that showing steady improvement during the year is the best sign that you are learning. You are not expected to do your experiments perfectly at the beginning of the year but you are expected to improve as the year passes. The appendices contain details on the preparation of a written report for each experiment. Additional information is included there on units and dimensions, graphs, errors and certain items of laboratory equipment.This is an opportunity for every student to obtain a significant continuous assessment mark before entering the examination hall at the end of the term. With diligent effort and steady work, every student should be able to do well in the laboratory.Dr. Neil Trappe First Year Course Director September 2018Writing Up Your Lab Report1. Preparation for each Practical Session(a) Read the laboratory manual and consult the recommended texts beforecoming to the laboratory. Make notes and bring those with you.2. Practical Report(a)The report should be prepared in an A4 hard-backed notebook with lined paperon one side and graph paper on the other supplied by the Department.(b)The report should be submitted on the Monday following the lab by 1pm in theassociated slot outside the first year laboratory(b) The record for each experiment should start on a fresh page. The followingtopics should be covered in the reportDate, Title, and Aim.Brief overview and context of the experiment and main related theory(Show you understand what ideas are being tested and how it is done and what you expect to show)Tables of Results - the results of your experiments should be recorded in ink immediately they are made. The laboratory manual suggests how the tablesof results might be laid out. Give yourself plenty of room in the layout.Clarity is very important. If you have cause to re-measure a certain quantity,record this fact below the table of results. Record the ‘experimentaluncertainties’ as you enter each item on the table.Any relevant graphs should be drawn on the graph paper in the notebook using pencil.Calculations - give the relevant formula and show how you arrived at your answer. Do not hold on to unjustifiable decimal places in your results. Usescientific notation e.g. write 7.43 10-3 instead of 0.00743.Error analysis is only required in 2nd term. Relevant calculations to estimate the accuracy of the experiment must be written in you laboratory notebook.Conclusions (not more than 100 words)-Summarise the aim and method of the experiment.State your main resultsComment on how your results compare with the expectedvalues and explain any discrepanciesSELF ASSESSMENT CHECK-LISTTo help you write a good report, the following questions try to guide you through the items you should include and also avoid common mistakes. Always write all data into your hardback note book not on your lab manual or on scraps of paper!1. Have you written the title and date of the experiment?2. Have you stated the aim of the experiment with a shortdescription of the procedure and apparatus used? (don’ttranscribe manual procedure, just summarise what you did briefly . (Most marks are for results/graphs/calculations and conclusions)3. Is your report written in a clear manner maybe with asimple clear diagram (if required)4. Have you written a good overview of the experiment?(Should be brief & concise)5. Your experimental results.Have you reported a full set of results? Yes No Are they presented clearly with correct units? Yes No Have you checked significant figures of results reported? Yes No5 Graphs (always on graph paper side of book) Do you need a graph to present data? Yes No Are the axes labelled and of correct scale? Yes No Have you drawn a best fit line? (see page 81 manual) Yes No Did you need to calculate a slope? Yes No6 Calculations Did you write down the formula you used? Yes NoDoes your calculation make physical sense – Think! Yes No Have you checked significant figures calculated? Yes NoHave you calculated what was asked for? Yes NoDoes the result seem sensible? Yes No7 Error analysis/UncertaintyHave you calculated error/uncertainty associated with experiment? Yes No Does this look reasonable? (Think of possible sources) Yes No8 Conclusions (100 words or so)Did you summarise the aim and method of experiment? Yes NoDid you state your main results Yes NoWas your experiment successful? Yes No Have you commented on accuracy of results? Yes No Have you stated discrepancies and possible sources of error? (less important in TERM I) Yes NoIntroductory Lab Experiment 1st Lab Session Reading Vernier scalesThe Vernier caliper is a precision instrument that can be used to measure internal and external distances extremely accurately. It is a very ingenious device for obtaining accuracy of a greater order than that obtainable by eye-estimation was invented by P. Vernier (1580 - 1637), and is known by his name. The example shown below is a manual caliper. Measurements are interpreted from the scale by the user. This is more difficult than using a digital Vernier caliper which has an LCD digital display on which the reading appears. The manual version has both an imperial and metric scale. How do we correctly read a Vernier scale? This is often an issue for 1st year students so let’s look at the method to read the Vernier scales and a few examples. The main scale works just like a ruler: the 0 mark on the vernier is compared to a main scale and the result is written down. Use the mark next to the zero, not the mark next to the edge of the vernier. Be sure to record the value of the main scale mark that is just to the left of the vernier zero mark.To take a reading:Look where the zero mark on the Vernier scale meets the main scale. This gives us our course reading, between 1.3 and 1.4cm (13 – 14 mm) in the example below.Now look to find the mark on the Vernier scale which most closely meets a mark on the main scale. In this example it is the 21st mark along (not counting the zero mark), which gives us our value for the most precise digit, in this case 0.42mm.The thickness is 13.42 mm in this example. Each small division of the Vernier scale is 0.02mmAnswer = ____________Answer = ____________Example:Main ScaleVernier ScaleReading A: 9 mmReading B: 0.26mmTotal: 9.26mmNotice that ‘B’ represents thirteen 0.02mm divisions on the vernier scale.Vernier circular scales (consider when required)The same concept can be applied to a circular scale. In the image below, the main outer scale is graduated in intervals of 30 minutes. Each interval on the vernier scale has an arc measure of 29 minutes. Again, count graduations up to the point at which a mark aligns with one on the lower scale. This will show the number of minutes to add to the direct reading.This scale is a bit more complex because the older-style instruments could read angles either right or left. There are two sets of numbers on the outside, stationary scale. The top numbers give the angle right, which is actually read to the left. This may be counterintuitive, but from this perspective the vernier moves to the left as the instrument turns to the right. There was a time (never to return) when I could read a one-minute scale without a magnifying glass. Verniers have also been used for a least-count precision of 30, 20, or 15 seconds. The scale is read with a magnifying glass, often attached to the instrument itself.The Micrometre Screw Gauge.The Micrometre Screw Gauge is an instrument which can measure accurately to ±0.001mm. However, it is limited to objects less than 25mm in size. This instrument also has a ‘vernier scale’.Close the micrometre fully using the ‘rachet stop’ (also known as the friction drive) to avoid over-tightening. Generally, the micrometre will not read zero and this ‘zero correction’ must be added to, or subtracted from the final reading as appropriate. Place the object to be measured between the ‘anvil’ and ‘spindle’. Tighten the micrometre using the ‘rachet stop’ (friction drive). An example is given below of how to read the micrometre. Adjust this reading for the ‘zero correction’.Read the barrel 8.500 mmRead the thimble 0.050 mmRead the vernier 0.008 mm8.558 mmIntroductory Lab Experiment Calculating DENSITY1. AimTo gain experience with Vernier scales in determining the densities of varioussubstances using samples of regular shape and a quick examination of the uncertainty in taking measurements in a lab. 2. TheoryREAD: Cutnell and Johnson - Chapter 11.1. The quantity of density is a measure of how much mass (“stuff”) is contained in a certain volume (length breath height) of a material. For example, Styrofoam would have a low density compared to a metal like gold or iron. Its formula is given by Density Mass in kg Volume in mkg /m 333. ProcedureThere are a number of example materials available in this lab to be analysed:-a rectangular block of wood (oak) an aluminium cylinder a steel ball bearing a brass welding rodEach sample should be weighted on the electronic balance - ‘zero’ the balance by pressing the appropriate button - select the relevant mass scale (200 grams for these samples) and place the sample on the pan. Determine the dimensions of the sample using either the Vernier calipers or the Micrometer Screw Gauge - the micrometer is the more accurate instrument but can only measure up to 25 mm (0.25 10-1 m).See the appendices for details on how to use these instruments. Calculate the volume using one of the formulae:-Rectangular shape - Length Breadth HeightCylindrical shape - (Diameter) Height4Spherical shape -Diameter 2 36Fill out the various rows in the table below which apply to your sample under study. Calculate the various densities for the materials you use.4. Error Analysis (for you information at this stage)Before we go into details of error analysis later in the term it is important to understand the meaning of errors in physics. Error in a scientific measurement does not mean a mistake or blunder. Instead, the terms "error" and "uncertainty" both refer to unavoidable imprecision inmeasurements – the inherent small uncertainty that exists when taking measurements.Density ()Mass () Volume ()M VThe % error in density ( %) is related to the % errors in mass ( M %) and volume ( V %) as follows:-% = M % + V %M %.0011010013Mass in kg The electronic balance on the ‘200gram’ scale is accurate to 001103. kg.V % depends on the shape - using L for length, B for breadth, H for height and D for diameter, calculate V % as follows:-RectangularV L B H %%%% Cylindrical V H D %%% 2 SphericalV D %% 3L0021010013.Length in metres Similarly for B and H (measured with the Vernier calipers whose accuracyis 0022105. mm or m).D 00011010013.Diameter in metresThe Micrometer Screw Gauge is accurate to 0001106. mm (m). Note that the % error in D , the diameter, is doubled for a cylinder and tripled for a sphere.EXPERIMENT 1 – 1 NEWTON’S SECOND LAW____________________________________________________________________ 1.Aim- To verify Newton’s Second Law of Motion.2.TheoryREAD: Cutnell and Johnson – Chapter 4.3When a net external force F is applied to an object of mass m, the acceleration a that results is directly proportional to the net force and has a magnitude that is inversely proportional to the mass. The direction of the acceleration is the same as the direction of the net force. F and a are vector quantities, while m is a scalar quantity.F = m aF is measured in newtons (N), a is measured in metres per second squared (m/s2) and m is measured in kilograms (kg).3.Procedure4. Experimental MethodThe air-track arrangement is similar to that shown above. Unhook the Mass Holder from the Glider and level the track carefully using the adjustable feet. With the air-blower turned on, the Glider will sit on a level track without moving in either direction. Transfer 100 grams from the weight box onto the Mass Holder. Record the mass of the Mass Holder and the added mass as m a. The gravitational force due to m a causes the gilder to be accelerated. This acceleration can be measured electronically using the Smart Timer.Turn on the Smart Timer with the photogate connected to plug 1 on the Smart Timer. Set the Smart Timer to acceleration and to linear pulley. Pressing the start/stop button will make a star appear on the screen. This star indicates that the timer is ready for a measurement to be made.Pull the Glider approximately 90cm from the pulley allowing the mass holder to hang up to about 30cm below the pulley. Turn on the air supply. When the Glider is in place with the air supply on, the start/stop button can be pressed and the Glider released. Press the Start/Stop button such that the star appears and simultaneously release the glider so that it runs the track for an accurate result.Record the figure on the screen of the Smart Timer as the acceleration in cm/s2 due to the combined mass of the 100 g mass and the Mass Holder. Repeat this measurement five times until a consistent set of results is obtained, making sure that the Total Mass of the system remains constant.The Glider does not need to travel the length of the whole track to take the reading and should be stopped manually once a figure appears on the screen and before hitting the damper at the pulley.(Ensure that the laser photogate is accurately being interrupted by the spokes of the wheel pulley by observing the blinking red LED as the glider travels the system)The table below should be copied into your lab notebook and used to record your results. The value of the acceleration due to gravity is g = 9.81m/s2Weigh the Mass Holder, the Glider and the added masses and record this as M T., the total mass of the system.5. Experimental Results:Mass transferred from the Glider to the Mass HolderRunnumber100 grams 90 grams 80 grams 70 grams 60 grams 50 grams1.2.3.averageTransfer another 10 g from the Mass Holder to the Glider and repeat the measurements taken above. Continue to transfer 10 g masses from the Mass Holder to the Glider untilyou have measured the average acceleration caused by having a 100, 90, 80, 70, 60, 50 gon the Mass Holder.M T – Total system mass = ________ (kg)Total mass of Mass Holder & added masses –m a (kg) Average acceleration causedby the total mass recorded incolumn 1.a (m/s2)Gravitational force due tototal mass recorded incolumn 1 .F a = m a × 9.81 N(This is the ‘applied force’referred to below.)6. Calculations:Draw a graph of the applied force, F a , versus the average acceleration a of the whole system (Glider plus added masses plus Mass Holder), i.e. plot F a on the y axis and a on the x axis.Since Newton’s Second Law states that the acceleration is proportional to the applied force, i.e., F = m a, your data points should lie on a straight line.Measure the slope of your graph and compare your measured slope to the expected value, which is the total mass of the system, M T.7. ConclusionsIn no more than 100 words write a succinct summary of what you have done. State the goal and method of the experiment. State your main results, i.e., Did you find that the acceleration is proportional to the applied force, or not? What value did you get for the constant of proportionality ? Are your results consistent with Newton’s Second Law? If your results are not consistent with Newton’s Second Law, can you suggest why not?8. Sample ConclusionsA horizontal air track apparatus was used to measure the acceleration of a mass of450grams in response to an applied force. The applied force was due to gravity acting on part of the 450 grams. We have found that the acceleration of the mass is indeed proportional to the applied force and that the slope of a graph of force versus acceleration gave a straight line with slope 0.440 kg. This is close to the expected value of 450 grams, and in reasonable agreement with Newton’s Second Law.。
大学物理教案英文版简谐振动Simple harmonic oscillation
+A +A
+ ωA − ωA
+ω2 A +ω2 A
φ=0
d 2 x( t ) a( t ) = dt 2 = − Aω 2 cos(ωt + φ )
x = + xm v = 0 a = −am x = 0 v = −v m a = 0 x = − xm v = 0 a = +am
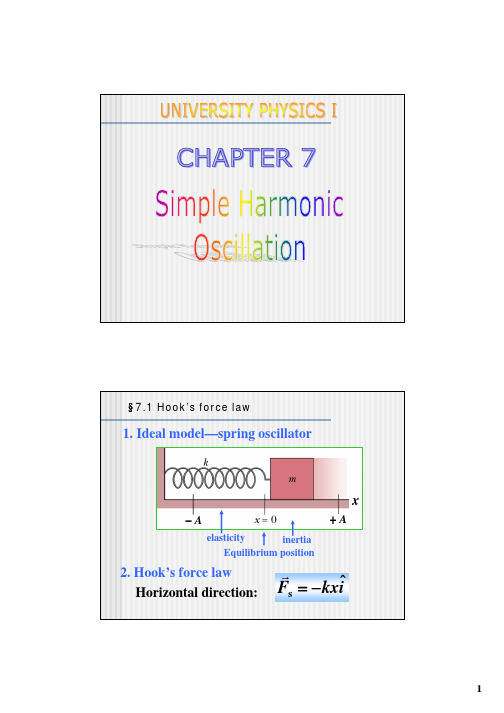
§7.2 Simple harmonic oscillation
r A
ϕ
ω
r A1
ω
x
x 1 = A1 cos( ω t + ϕ 1 )
x 2 = A2 cos( ω t + ϕ 2 )
ϕ2
ϕ1
x = x1 + x 2
x2
x1
x
r r r A = A1 + A 2
= A cos( ω t + ϕ )
A=
2 A12 + A2 + 2 A1 A2 cos(ϕ 2 − ϕ 1 ) A1 sinϕ1 + A2 sinϕ 2 ϕ = arctg A1 cosϕ1 + A2 cosϕ 2
§7.4 simple harmonic motion and the uniform circular motion
ωA
A
x ( t ) = A cos(ωt + φ )
v ( t ) = − Aω sin(ωt + φ )
9
§7.4 simple harmonic motion and the uniform circular motion
1
§7.2 Simple harmonic oscillation
- 1、下载文档前请自行甄别文档内容的完整性,平台不提供额外的编辑、内容补充、找答案等附加服务。
- 2、"仅部分预览"的文档,不可在线预览部分如存在完整性等问题,可反馈申请退款(可完整预览的文档不适用该条件!)。
- 3、如文档侵犯您的权益,请联系客服反馈,我们会尽快为您处理(人工客服工作时间:9:00-18:30)。
Build a Raft Powered by Surface TensionAbstractHave you ever wondered why a water strider can walk on water? Or how detergent can clean your dishes? If you observe carefully, you can find dozens of similarly interesting phenomena that are all linked to the surface tension of water. This science project will help you understand and measure the properties of water surface tension.ObjectiveIn this science project, you will:1.Develop an understanding of water surface tension,2.Understand changes in water surface tension under various conditions,3.Make measurements to estimate the net water surface tension.IntroductionIf you've ever blown up a balloon, you know it's pretty easy to blow up without becoming out of breath when it's made of soft, stretchy rubber. That's because the balloon offers little resistance to becoming stretched out as it is blown up. But for a balloon made of thicker or stiffer rubber, more energy is required to blow it up. The balloon offers more resistance to stretching. Think of a balloon as a model for surface tension. How "stretchy" the balloon material is determines how much resistance (surface tension) must be overcome by the energy of your blowing in order to inflate the balloon. Surface tension is defined as the energy required to increase the surface area by a unit amount.Liquids also experience surface tension. The molecules (small individual particles) of the liquid experience intermolecular attractions, which simply means the molecules are pulling and pushing away from each other, just like magnets both attract and repel each other. In the case of a water molecule surrounded on all sides by other water molecules, every pulling force is balanced by a pushing force. The net (which means overall) effect is no change. But at the surface, where air and water meet, that isn't true. The water molecules at the surface experience more pulls downward toward the other water molecules below them than upward toward the air. This is the surface tension of the water. You can see it at work when you fill a glass. Even if the water is at the rim of the glass, you can add just a few more drops so that the water is slightly taller than the rim. Don't believe it? Look at the picture below and then try it yourself!Figure 1. Because of surface tension, the top of this full glass of water curves outward. If more water is added, it will eventually spill over the side of the glass. Note the edge of the glass, and how far the water curves over it.In this science project, you'll make a small raft from a clear plastic sheet (a transparency), and see if you can propel it by taking advantage of the surface tension of water.Terms, Concepts, and Questions to Start Background Research •Resistance•Surface tension•Molecule•Velocity•Kinetic energy•Mass•AccelerationBibliographyThese websites are good introductions to surface tension:•Massachusetts Institute of Technology. (n.d.). Introduction to Surface Tension.Retrieved August 12, 2010, from•Exploratorium. (n.d.). Sticky Water. Retrieved August 12, 2010, fromThis website offers an explanation of velocity:•Physics4Kids. (n.d.). Velocity, Speed, and Motion...Oh My! Retrieved August 12, 2010, fromThis website explains kinetic energy:•Zobel, E.A. (n.d.). Kinetic Energy. Retrieved August 12, 2010, fromMaterials and Equipment•Transparencies, like those used on an overhead projector (1 box); available at your local office supply store•Marker•Ruler, metric•Scissors•Kitchen sponges (1 package)•Tape•Lab notebook•Liquid laundry detergent•Eye dropper; available at your local pharmacy•Stopwatch, accurate to 0.01 second (sec)•Scale, one that can detect small masses in grams (g). A good kitchen scale will work.Alternatively, try a postal scale. You might be able to use the one at your local post office, or your school might have a triple-beam balance.•Liquid hand soap•Toothpaste•Toothpicks (1 box)•Water•Large basin or sink to hold the water and your transparency raft in early trials o It should be large enough that the raft can travel a short distance within it.o Make sure it can be easily emptied, as you will be filling and re-filling it with fresh water often.•Bath tub for later trials•Volunteer•8-inch (in.) x 10-in. picture frame, plastic or wood (the frame will get wet)•Disposable plastic cups, small (4)•Zip ties or twist tiesExperimental ProcedureExploring the Existence of Surface Tension1.Think of a shape for your raft and draw the shape onto the transparency.a.The raft should be symmetric.b.The raft should be small enough that it can travel a short distance in yourbasin or sink, but still be large enough to hold the sponge piece.c.You will need to cut a space in the back of the raft where the sponge will be.It should be slightly larger than the size you'll be cutting your sponge (whichwill be in step 3).d.The length of the raft is quite flexible, but we suggest an initial size of 3–5 cmlong, and a width that is approximately half of the length you choose. Recordthe size in your lab notebook.e.See Figure 2 for an example of the raft design.Figure 2. Example of a raft design. Note the way in which the small piece of sponge isattached to the transparency to prevent it from moving and sinking.2.Cut out the raft.3.Cut the sponge into small, identically sized pieces. The sponge should fit into thespace cut in the back of the raft.4.Run a toothpick horizontally through one of the small sponge pieces so enough of thetwo ends of the toothpick can rest on the transparency, then attach the toothpickends with tape so that the sponge is attached to the small space at the back of theraft. See Figure 2, above. Record the size of the raft and the sponge in your labnotebook.5.Fill a basin or sink with tap water.6.Put the raft onto the water surface and let it float.ing an eye dropper, put a drop of detergent onto the sponge at the end of the raft.If one drop isn't enough, put one or two more. The raft doesn't require muchdetergent to start moving.8.Observe the motion. Record all observations in your lab notebook.9.Repeat step 7 with the same raft and sponge, continuing to add detergent adropperful at a time, in order to become familiar with the effects of the change insurface tension that detergent creates.a.Note: After a few trials, the water will have too much detergent in it for itssurface tension to change if more is added. When this happens, you will needto replace your water with new water. This will be fairly often.10.From your background research, you should know that detergents decrease thesurface tension of water. How can this help to explain your results?Exploring Other Substances as Surface-Tension “Motors” for Your Raft1.Fill up the basin or sink with fresh water.2.Replace the sponge on the raft with a fresh sponge.3.Put the raft onto the water surface and let it float.4.Put a drop of soap onto the sponge at the end of the raft. You could carefully pumpone drop, or unscrew the pump lid and let one drop fall from the tube that is attached to the pump onto the sponge.5.Observe the motion and compare it to the first raft, which used detergent. Recordyour observations in a data table, like the one below.6.Repeat steps 1–5. Make sure that you use the same raft for every test, and that youreplace the water with new water for every different substance you test. You can try all sorts of substances: vegetable oil, corn starch, salt, and even vinegar! Try outanything that you think might move the raft.a.Be sure you have three trials for each substance. This will ensure your resultsare accurate and repeatable. Record all results in your data table.7.Which substances worked as a "motor"? Which ones didn't? Which substance was thebest motor? Can you relate your findings back to surface tension?Exploring the Effect of Shape on the Motion of Your Raft1.Now test different raft shapes. Design another shape for your raft and draw the shapeonto the transparency.a.You might want to try an asymmetric shape.b.You might want to experiment with different sizes, or different basic shapes.2.Cut out the raft, leaving a space for a small piece of sponge, and insert the sponge atthe end of the raft. Again, record all measurements in your lab notebook.3.Prepare fresh water in the basin or sink.4.Put the raft onto the water surface and let it float.5.Put one drop of the substance that worked best in the previous section onto thesponge at the end of the raft.6.Observe the motion and compare it to the other rafts. Use the same substance foryour surface-tension motor for each trial. Record your observations in a data table, such as the one below.a.Be sure you have three trials for each substance. This will ensure your resultsare accurate and repeatable. Record all results in your data table.Large circleSmall circleMeasuring Net Surface Tension1.Prepare a new raft with a shape similar to the one in Figure 3 below. You will betesting the raft within an 8-in. x 10-in. picture frame, so the raft size is suggested tobe 3–5 cm long, and a width approximately half of this length.Figure 3. Try making a boat with this arrowhead shape. Does it perform better than other shapes you have tested?2.3.Weigh the raft using a scale, in grams. This is the boat's mass.4.You might need more room for your raft to travel this time, so fill a bath tub with tapwater.5.Now build a channel—a barrier sitting at the surface of the water—that will only allowthe boat to travel in one direction. The point of the channel is to have a controlledpath for the boat to travel along, so you can accurately measure how far it goes. Itwill travel along the 10-in. length of an 8-in. x 10-in. picture frame. Decide which endwill be the launching point, and make marks on the frame that are 25 cm away fromthe launch point.6. A perfect object to use for this is an 8-in. x 10-in. picture frame made of plastic orwood. You only want the frame, so remove the glass, backing, etc. Next, tightlyconnect four small, disposable plastic cups at the corners of the frame using zip ties(or twist ties, as in Figure 4, below). These will be your anchors for your channel,because you want it to remain stationary while the raft travels within the frame. If theframe simply floated at the surface of the water, then it could move around,especially since you will be changing the surface tension.Figure 4. Use a picture frame anchored by filled cups to keep the channel stationary in your bath tub.7.8.Place the channel in your bath tub and fill it so that the frame is at the surface of thewater. To keep the channel anchored, fill each cup with water.9.Set the raft in motion using the substance that propelled your rafts the best from theExploring Other Substances as Surface-Tension "Motors" for Your Raft section anduse a ruler and a stopwatch to measure the time it takes for the raft to travel about25 cm. You might need extra help for the following steps, so ask a volunteer to holdthe ruler while you watch the boat and run the stopwatch.10.Put the raft at one end of the channel and put one drop of detergent onto the spongeat the end of the raft.11.Measure the time required for the raft to travel 25 cm inside the channel.12.Calculate the velocity and the kinetic energy of the boat. Take a look at theBibliography section to study up on velocity and kinetic energy. The formula forvelocity is:Equation 1:V =d to V = Velocityo d = Distance, in centimeters (cm) ot = Time, in seconds (s)13. Now you need to calculate kinetic energy. You will need your mass to be in kilograms(kg), so convert your grams measurement to kilograms by dividing by 1,000 (for example: if your mass is 2 g, divide by 1,000 to get 0.002 kg). You will also need your velocity to be in meters per second (m/s), so convert your centimeters/second to meters/second by dividing by 100 (for example: if you have 5 cm/s, divide by 100 to get 0.05 m/s). Equation 2:KE = (1/2) x m x V 2o KE = Kinetic energy, in joules (J) o m = Mass, in kilograms (kg) oV = Velocity, in meters/second (m/s)14. Repeat steps 7–11 two more times so you have three trials. You will want to performthree trials per amount of mass you test. Record all data in your data table:13.Increase the mass of the raft by adding more pieces of transparency. Record the newweight in your lab notebook.14.Repeat the measurements and calculations for several different weights of the raft.pare the measured values.Variations•How would changing the temperature affect surface tension?•Try making boats with other materials to see if surface tension is powerful enough to propel bigger objects.•Try using oil instead of water for the experiment to investigate the surface tension of oil.•Is the sponge necessary? Try the experiment again, except this time, simply place a transparency raft in water without a sponge in the back, and drop some detergent behind the raft. Does the raft move forward? Is this a more efficient means ofpropelling the raft, or a less efficient means?•For another science project on surface tension that includes a more direct measurement of the forces involved, see: Measuring the Surface Tension of Water.•For a science project on the chemistry of surface tension, see: Measuring Surface Tension of Water with a Penny.•For more science project ideas in this area of science, see Physics Project Ideas. CreditsAuthor: David ChungEditors: Andrew Olson and Justin Spahn, Science Buddies。