T11-11.2-06
EN 13597-2003 铁路应用 橡胶悬挂元件 空气悬挂弹簧橡胶模板(中文版)
T
T
11 产品的认可及合格 .................................................................. 42
T
T
12 检验与质量监督 .................................................................... 43
T
T
9 可追溯性 ........................................................................... 42
T
T
10 供货方生产计划资格 ................................................................ 42
T
T
附录A (资料性附录) 膜 板 类 型 ..................................................... 44
T
T
附录B (规范性附录) 由膜板上制取试件 ................................................ 46
T
T
1 范围 ................................................................................ 1
T
T
2 规范性引用文件 ...................................................................... 1
T
T
6.5 功能特性 ......................................................................... 15
Chomerics Premier EMI 防舰面板说明书

TEST REPORTCHOMERICSPREMIER™ EMI Shielding ThermoplasticFace Plate Shielding EffectivenessPrepared by: CHOMERICS R&D84 DRAGON COURTWOBURN, MA 01801Date: May 2006Test Report Number: TR 1011 EN05/06Chomerics Approved Signatory:This report shall not be reproduced except in full without the written approval of Chomerics.The user, through its own analysis and testing, is solely responsible for making the final selection of the system and components and assuring that all performance, endurance, maintenance, safety and warning requirements of the application are met. The user must analyze all aspects of the application, follow applicable industry standards, and follow the information concerning the product in the current product catalog and in any other materials provided from Parker or its subsidiaries or authorized distributors.CHOMERICS and SOFT-SHIELD are registered trademarks of Parker Hannifin Corporation. PREMIER is a trademark of Parker Hannifin Corporation. Other trademarks may be the property of their respective owners.© May 2006. All rights reserved.1.0 INTRODUCTIONThis document is written to report test results of shielding effectiveness tests performed in accordance with the IEEE-STD-299 procedure. The face p late Assembly was tested for electric field shielding effectiveness from 600kHz to 10GHz.The test samples consisted of face plates injection molded from Chomerics PREMIER A220-FR, A230-FRHF, A240-FRHF material, compared to standard aluminum face plates. All parts tested were supplied by Chomerics R&D. The aluminum face plates were fabricated by Chomerics machine shop to duplicate the mechanical configuration of the PREMIER face plates. Array (vertically) using Chomerics2.0 TEST REQUIREMENTSDevelopment.3.0 TEST SETUPFigures 1 illustrates theshielding effectiveness testsetup.The shielded enclosure wasmanufactured by SpragueShielding Corporation.Attenuation tests havedemonstrated that the shieldedenclosure meets theattenuation requirements ofIEEE-STD-299. The shieldedenclosures are comprised oftwo separate rooms separatedby a wall where the accesspanel (test fixture) is located.6GHz.room.The Rack Face Plate System was installed in a test fixture designed and fabricated byChomerics. The test fixture was designed to hold a series of eleven face plate pieces.All face plates were mounted to the test fixture using the standard latch and screw assembly.During the shielding effectiveness test, the test samples were mounted to the center wall of the shielded enclosure which separates the two rooms. The test fixture was attached to theshielded room wall using twenty (20) 1/4" bolts to hold the test fixture on the wall. A flat spring finger gasket was placed between the test fixture and the shielded room wall. The seam was additionally covered with copper tape.4.0 R ADIATED E LECTRIC F IELD S HIELDING T ESTSTests for radiated field were performed in accordance with IEEE-STD-299. The following list includes the equipment which was used to perform the radiated electric field and plane wave tests:Test Equipment Asset #Serial #Cal Date X HP 83640A Signal Generator 38 3009A00188 4/06X AR 30W1000M7 Amplifier 480 15657 NCRX Logimetrics A300/S-08 Amplifier 133 3016 NCRX Logimetrics A300/C-08 Amplifier 132 3012 NCRX Logimetrics A300/IJ Amplifier 134 3094 NCRX Agilent 4440A Spectrum Analyzer 704 US41421236 1/06X Emco 3109 Biconical Antenna 87 2123 1/06X Emco 3109 Biconical Antenna 82 2054 1/06X Emco 3106 Horn Antenna 117 2213 1/06X Emco 3106 Horn Antenna 120 2212 1/06X EMCO 3115 Double Ridge Guide Antenna 375 2174 1/06X EMCO 3115 Double Ridge Guide Antenna 376 2175 1/06X EMCO Parallel Element Antenna 336 3107 NCRX ENI Amplifier 138 510L NCRX EMCO Passive Rod Antenna 280 3303 1/06The Electric Field test was performed at frequencies of 600kHz, 800kHz, 1MHz, 10MHz, 20MHz, 30MHz, 40MHz, 60MHz, 80MHz 100MHz, 200MHz, 400MHz, 600MHz and 800MHz. The Plane wave test was performed at frequencies of 1GHz, 2GHz, 4GHz, 6GHz, 8GHz, 10GHz, 12GHz, 14GHZ, 16GHz and 18GHz.Antenna orientation was vertical for all tests in the same orientation as the longest length of the face plates. Preliminary tests done in both horizontal and vertical polarizations determined that the vertical polarization was worst case. The worst case was defined as the polarization that produced the lowest shie lding effectiveness values.The shielded effectiveness test was performed in accordance with the IEEE-STD-299 procedure.The transmit and receive antennas were placed two feet from each other on opposite sides of the test plate. The open reference was taken by transmitting and receiving the test signalthrough the open aperture on the test plate where the face plates would be located. The closed reference was taken by transmitting the test signal through the test fixture with the face plates in place.The difference between the closed reference and the open reference is the shieldingeffectiveness. Below is a sample calculation.Open Reference - Closed Reference = Shielded Effectiveness+14dBm - -100dBm = 114dB5.0 OVERALL TEST RESULT SThe test results are illustrated on the attached graph.APPENDIX B SET UP PHOTOGRAPHSC USTOMER:N/AD ATE:02/14/06E QUIPMENT:R ACKF ACE P LATE S YSTEM T EST N UMBER:O NE (1)T ESTED B Y:B.C OUTURE C OUPLING D EVICE:P ASSIVE R OD A NTENNAO PERATING M ODE:N/A T EST S PEC:IEEE-STD-299Photograph Description: Test set-up using the Passive Rod antenna 500kHz to 20MHz.FORM CTS-PHOTOC USTOMER:N/AD ATE:02/14/06E QUIPMENT:R ACKF ACE P LATE S YSTEM T EST N UMBER:O NE (1)T ESTED B Y:B.C OUTURE C OUPLING D EVICE:B ICONICAL A NTENNAO PERATING M ODE:N/A T EST S PEC:IEEE-STD-299Photograph Description: Open reference test setup with Biconical antenna 20MHz to 1GHz.FORM CTS-PHOTOC USTOMER : N/AD ATE : 02/14/06E QUIPMENT : R ACKF ACE P LATE S YSTEM T EST N UMBER : O NE (1)T ESTED B Y : B. C OUTURE C OUPLING D EVICE : H ORN A NTENNAO PERATING M ODE :N/AT EST S PEC : IEEE-STD-299Photograph Description: Open reference test setup with Horn antenna 200MHz to 1GHz.FORM CTS-PHOTOPhotograph Description: Open reference test setup with Horn antenna 1GHz to 18GHz.FORM CTS-PHOTOC USTOMER : N/AD ATE : 02/14/06E QUIPMENT : R ACKF ACE P LATE S YSTEM T EST N UMBER : O NE (1)T ESTED B Y : B. C OUTURE C OUPLING D EVICE : H ORN A NTENNA O PERATING M ODE : N/AT EST S PEC : IEEE-STD-299C USTOMER:N/AD ATE:02/14/06E QUIPMENT:R ACKF ACE P LATE S YSTEM T EST N UMBER:O NE (1)T ESTED B Y:B.C OUTURE C OUPLING D EVICE:N/AO PERATING M ODE:N/A T EST S PEC:IEEE-STD-299Photograph Description: Test set-up with Face Plates installed in test fixture.FORM CTS-PHOTOC USTOMER:N/AD ATE:02/14/06E QUIPMENT:R ACKF ACE P LATE S YSTEM T EST N UMBER:O NE (1)T ESTED B Y:B.C OUTURE C OUPLING D EVICE:H ORN A NTENNAO PERATING M ODE:N/A T EST S PEC:IEEE-STD-299Photograph Description: Test set-up of transmit side of test fixture using Horn antenna.FORM CTS-PHOTOTEST LOGC USTOMER : N/AP ROGRAM : F ACE P LATE A SSEMBLY E QUIPMENT : F ACE P LATET ESTED B Y : B. C OUTUREDateCommentsP r e -T e s t C h e c k l i s t2/14/06Test Plan/Procedure: IEEE STD 299 Test Specification: IEEE STD 299 Chomerics Procedure: CHO TP08EUT Power Requirement Verified: N/AVoltage Frequency Phase Voltage Frequency PhaseEUT Functional Operational Check: [ ] Pass [ ] Fail Environmental: Bonding/Grounding: N/A Safety Issues: N/ADateTest # Test TypeTest Equipment Calibrated Test Performed Properly – Data Accepted EUT Set-up Check/ Operational Check EUT Pass/ Fail 2/14/06 1 SE Yes Yes N/AN/A 2/23/06 2 SE Yes Yes N/A N/A 3/2/06 3 SE Yes Yes N/A N/A I n -P r o c e s s T e s t C h e c k l i s tP o s t T e s t C h e c k l i s tDate: 3/2/06EUT Functional Operation Check:[ X ] Pass [ ] Fail_________________ __________________ Test Engineer/Tech Approved SignatoryFORM CTS-010。
盗贼t1-t11套装
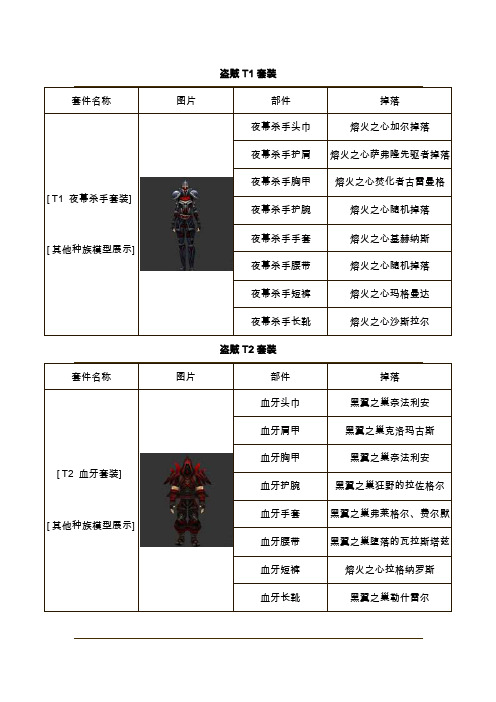
]]盗贼T2套装]]盗贼T4套装]]]]盗贼T6套装]盗贼T7套装]]盗贼T8套装]]盗贼T9套装]]]盗贼T10套装]盗贼T11套装]教你如何用WORD文档(2012-06-27 192246)转载▼标签:杂谈1. 问:WORD 里边怎样设置每页不同的页眉?如何使不同的章节显示的页眉不同?答:分节,每节可以设置不同的页眉。
文件――页面设置――版式――页眉和页脚――首页不同。
2. 问:请问word 中怎样让每一章用不同的页眉?怎么我现在只能用一个页眉,一改就全部改了?答:在插入分隔符里,选插入分节符,可以选连续的那个,然后下一页改页眉前,按一下“同前”钮,再做的改动就不影响前面的了。
简言之,分节符使得它们独立了。
这个工具栏上的“同前”按钮就显示在工具栏上,不过是图标的形式,把光标移到上面就显示出”同前“两个字来。
3. 问:如何合并两个WORD 文档,不同的页眉需要先写两个文件,然后合并,如何做?答:页眉设置中,选择奇偶页不同与前不同等选项。
4. 问:WORD 编辑页眉设置,如何实现奇偶页不同比如:单页浙江大学学位论文,这一个容易设;双页:(每章标题),这一个有什么技巧啊?答:插入节分隔符,与前节设置相同去掉,再设置奇偶页不同。
5. 问:怎样使WORD 文档只有第一页没有页眉,页脚?答:页面设置-页眉和页脚,选首页不同,然后选中首页页眉中的小箭头,格式-边框和底纹,选择无,这个只要在“视图”――“页眉页脚”,其中的页面设置里,不要整个文档,就可以看到一个“同前”的标志,不选,前后的设置情况就不同了。
6. 问:如何从第三页起设置页眉?答:在第二页末插入分节符,在第三页的页眉格式中去掉同前节,如果第一、二页还有页眉,把它设置成正文就可以了●在新建文档中,菜单―视图―页脚―插入页码―页码格式―起始页码为0,确定;●菜单―文件―页面设置―版式―首页不同,确定;●将光标放到第一页末,菜单―文件―页面设置―版式―首页不同―应用于插入点之后,确定。
黑龙江工伤停工留薪目录包括职业病分类目录
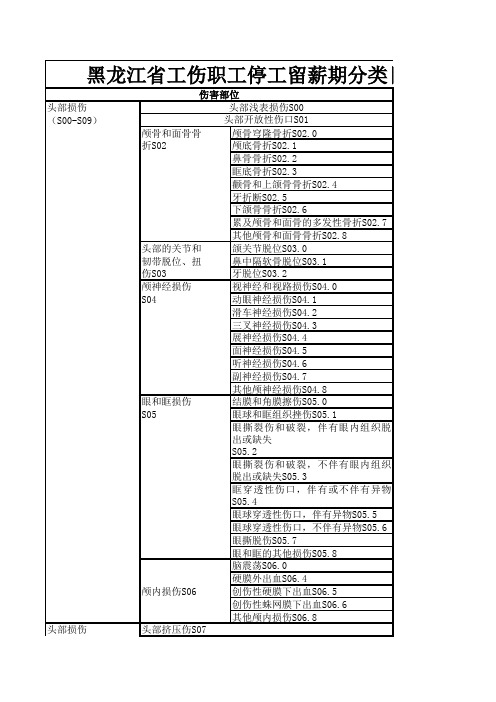
头部损伤(S00-S09)颅骨和面骨骨颅骨穹隆骨折S02.0折S02颅底骨折S02.1鼻骨骨折S02.2眶底骨折S02.3颧骨和上颌骨骨折S02.4牙折断S02.5下颌骨骨折S02.6累及颅骨和面骨的多发性骨折S02.7其他颅骨和面骨骨折S02.8头部的关节和颌关节脱位S03.0韧带脱位、扭鼻中隔软骨脱位S03.1伤S03牙脱位S03.2颅神经损伤视神经和视路损伤S04.0S04动眼神经损伤S04.1滑车神经损伤S04.2三叉神经损伤S04.3展神经损伤S04.4面神经损伤S04.5听神经损伤S04.6副神经损伤S04.7其他颅神经损伤S04.8眼和眶损伤结膜和角膜擦伤S05.0S05眼球和眶组织挫伤S05.1眼撕裂伤和破裂,伴有眼内组织脱出或缺失S05.2眼撕裂伤和破裂,不伴有眼内组织脱出或缺失S05.3眶穿透性伤口,伴有或不伴有异物S05.4眼球穿透性伤口,伴有异物S05.5眼球穿透性伤口,不伴有异物S05.6眼撕脱伤S05.7眼和眶的其他损伤S05.8脑震荡S06.0硬膜外出血S06.4创伤性硬膜下出血S06.5创伤性蛛网膜下出血S06.6其他颅内损伤S06.8头部损伤颅内损伤S06头部挤压伤S07伤害部位头部浅表损伤S00头部开放性伤口S01黑龙江省工伤职工停工留薪期分类目录(S00-S09)头的部分创伤头皮撕脱S08.0性切断S08耳创伤性切断S08.1头部其他部位的创伤性切断S08.8头部未特指部位的创伤性切断S08.9头部其他和未特指的损伤头部血管损伤S09.0S09头部肌肉和肌腱损伤S09.1耳鼓膜创伤性破裂S09.2头部多发性损伤S09.7颈部损伤(S10-S19)第一颈椎骨折S12.0第二颈椎骨折S12.1颈部脊柱多发性骨折S12.7颈部其他部位的骨折S12.8颈部水平的关颈部椎间盘创伤性破裂S13.0节和韧带脱位颈椎脱位S13.1、扭伤S13颈部多发性脱位S13.3颈部扭伤S13.4甲状腺区扭伤S13.5颈部水平的神颈部脊髓的震荡和水肿S14.0经和脊髓损伤颈部脊柱神经根的损伤S14.2S14臂丛神经损伤S14.3颈部周围神经损伤S14.4颈部交感神经损伤S14.5颈动脉损伤S15.0颈部多处血管的损伤S15.7胸部损伤乳房挫伤S20.0(S20-S29)胸部挫伤S20.2胸部多处浅表损伤S20.7胸椎骨折S22.0胸部脊柱多发性骨折S22.1胸骨骨折S22.2肋骨骨折S22.3肋骨多发性骨折S22.4骨性胸廓其他部位骨折S22.8胸部损伤胸部椎间盘创伤性破裂S23.0(S20-S29)胸椎脱位S23.1胸部脊柱扭伤S23.3肋骨和胸骨扭伤S23.4胸部脊髓的震荡和水肿S24.0胸部脊柱神经根损伤S24.2胸部周围神经损伤S24.3颈部骨折S12颈部浅表损伤S10颈部开放性伤口S11胸部水平的神经和脊髓损伤S24胸部的关节和韧带脱位、扭伤S23胸部开放性伤口S21肋骨、胸骨和胸部脊柱骨折S22胸部浅表损伤S20颈部水平的血管损伤S15颈部挤压伤S17胸部交感神经损伤S24.4心脏损伤S26创伤性气胸S27.0创伤性血胸S27.1创伤性血气胸S27.2肺的其他损伤S27.3支气管损伤S27.4胸部气管损伤S27.5胸膜损伤S27.6其他胸内器官损伤S27.8胸部挤压伤S28.0胸的部分创伤性切断S28.1腹部、下背、腰椎和骨盆损伤(S30-腹部、下背和下背和骨盆挫伤S30.0S39)骨盆浅表损伤S30腹壁挫伤S30.1外生殖器挫伤S30.2下背和骨盆开放性伤口S31.0腹壁开放性伤口S31.1外生殖器开放性伤口S31.2腰部椎骨骨折S32.0骶骨骨折S32.1尾骨骨折S32.2髂骨骨折S32.3髋臼骨折S32.4耻骨骨折S32.5腰椎间盘创伤性破裂S33.0腰椎脱位S33.1骶髂关节和骶尾关节的脱位S33.2腰部脊柱扭伤S33.5腰部脊柱和骨盆其他和未特指部位的扭伤S33.7腹部、下背腰部脊髓的震荡和水肿S34.0、腰椎和骨腰部和骶部脊柱神经根损伤S34.2盆损伤马尾损伤S34.3(S30-S39)腰骶丛损伤S34.4腰部、骶部和骨盆交感神经损伤S34.5腰部、下背和骨盆周围神经损伤S34.6部水平的神经和脊髓损伤S24腹部、下背和骨盆开放性伤口S31腰部脊柱和骨盆骨折S32腰部脊柱和骨盆的关节和韧带脱位、扭伤S33胸部其他和未特指的损伤S29胸部血管损伤S25胸部挤压伤和胸的部分创伤性切断S28其他和未特指的胸内器官损伤S27腹部、下背和骨盆水平的神经和腰部脊髓损伤S34脾损伤S36.0肝或胆囊损伤S36.1胰损伤S36.2胃损伤S36.3小肠损伤S36.4结肠损伤S36.5直肠损伤S36.6多个腹内器官损伤S36.7其他腹内器官损伤S36.8肾损伤S37.0输尿管损伤S37.1膀胱损伤S37.2尿道损伤S37.3卵巢损伤S37.4输卵管损伤S37.5子宫损伤S37.6其他盆腔器官损伤S37.8外生殖器挤压伤S38.0外生殖器创伤性切断S38.2肩和上臂损伤(S40-S49)锁骨骨折S42.0肩胛骨骨折S42.1肱骨上端骨折S42.2肱骨干骨折S42.3肱骨下端骨折S42.4肩和上臂其他部位的骨折S42.8肩胛带的关节和韧带脱位、肩关节脱位S43.0扭伤S43肩锁关节脱位S43.1胸锁关节脱位S43.2肩关节扭伤S43.4肩和上臂损伤(S40-肩胛带的关节S49)和韧带脱位、扭伤S43胸锁关节扭伤S43.6肩和上臂水平的神经损伤上臂水平的尺神经损伤S44.0S44上臂水平的正中神经损伤S44.1腹部、下背和骨盆水平的血管损伤S35腹内器官损伤S36腹部、下背和骨盆的部分挤压伤和创伤性切断S38腹部、下背和骨盆其他和未特指的损伤S39肩和上臂浅表损伤S40盆腔器官损伤S37肩和上臂开放性伤口S41肩和上臂骨折S42肩锁关节扭伤S43.5上臂水平的挠神经损伤S44.2上臂水平的其他神经损伤S44.8肩关节处创伤性切断S48.0肩和肘之间水平的创伤性切断S48.1肘和前臂损伤(S50-S59)尺骨上端骨折S52.0桡骨上端骨折S52.1尺骨干骨折S52.2桡骨干骨折S52.3尺骨和桡骨两者骨干的骨折S52.4桡骨下端骨折S52.5尺骨和桡骨两者下端的骨折S52.4肘关节和韧带脱位、扭伤桡骨头脱位S53.0S53肘关节脱位S53.1桡侧副韧带创伤性破裂S53.2尺侧副韧带创伤性破裂S53.3肘关节扭伤S53.4前臂水平的尺神经损伤S54.0前臂水平的正中神经损伤S54.1前臂水平的挠神经损伤S54.2前臂神经的其他神经损伤S54.8肘切断S58.0肘和腕之间切断S58.1腕和手损伤(S60-S69)手舟骨骨折S62.0其他腕骨骨折S62.1第一掌骨骨折S62.2其他掌骨骨折S62.3拇指骨折S62.5其他手指骨折S62.6肩和上臂的血管损伤S45肩和上臂的肌肉和肌腱损伤S46肩和上臂挤压伤S47前臂水平的神经损伤S54前臂骨折S52肩和上臂创伤性切断S48肩和上臂其他和未特指的损伤S49前臂浅表损伤S50前臂开放性伤口S51前臂创伤性切断S58前臂其他和未特指的损伤S59腕和手浅表损伤S60腕和手开放性伤口S61前臂水平的血管损伤S55前臂水平的肌肉和肌腱损伤S56前臂挤压伤S57腕和手水平的骨折S62腕关节脱位S63.0指关节脱位S63.1腕和腕关节韧带创伤性破裂S63.3掌指和指间关节处的手指韧带创伤破裂S63.4腕关节扭伤S63.5手指关节扭伤S63.6腕和手水平的尺神经损伤S64.0腕和手水平的正中神经损伤S64.1腕和手水平的桡神经损伤S64.2拇指的指神经损伤S64.3其他手指的指神经损伤S64.4腕和手水平的其他神经损伤S64.8拇指切断S68.0其他单个手指切断S68.1多个手指切断S68.2手指伴有腕和手其他部分的创伤性切断S68.3腕关节切断S68.4髋和大腿损伤(S70-S79)股骨颈骨折S72.0经大转子骨折S72.1转子下骨折S72.2股骨干骨折S72.3股骨多发性骨折S72.7髋脱位S73.0髋扭伤S73.1髋和大腿损伤(S70-S79)膝和小腿损伤(S80-S89)腕和手挤压伤S67腕和手水平的神经损伤S64腕和手水平的血管损伤S65腕和手水平的肌肉和肌腱损伤S66腕和手水平的关节和韧带脱位、扭伤S63小腿开放性伤口S81股骨骨折S72髋的关节和韧带脱位、扭伤S73髋和大腿水平的神经损伤S74髋和大腿水平的血管损伤S75髋和大腿的肌肉和肌腱损伤S76髋和大腿挤压伤S77髋和大腿创伤性切断S78小腿浅表损伤S80腕和手创伤性切断S68髋和大腿浅表损伤S70髋和大腿开放性伤口S71髌骨骨折S82.0胫骨上端骨折S82.1胫骨骨干骨折S82.2胫骨下端骨折S82.3腓骨骨折S82.4内踝骨折S82.5外踝骨折S82.6小腿多发性骨折S82.7髌骨脱位S83.0膝关节脱位S83.1半月板撕裂S83.2膝关节软骨撕裂S83.3膝的多处结构的损伤S83.7膝切断S88.0膝和踝之间的切断S88.1跟骨骨折S92.0距骨骨折S92.1其他跗骨骨折S92.2跖骨骨折S92.3拇趾骨骨S92.4其他趾骨折S92.5足多发性骨折S92.7踝关节脱位S93.0足趾脱位S93.1踝和足水平的韧带破裂S93.2足的其他部位脱位S93.3踝扭伤S93.4足趾扭伤S93.5踝和足损伤(S90-足底外侧神经损伤S94.0S99)足底内侧神经损伤S94.1踝和足水平的腓深神经损伤S94.2踝和足水平的皮感觉神经损伤S94.3踝和足水平的多神经损伤S94.7踝和足水平的其他神经损伤S94.8小腿骨折,包括踝S82小腿水平的肌肉和肌腱损伤S86小腿挤压伤S87小腿创伤性切断S88膝的关节和韧带脱位、扭伤S83小腿水平的神经损伤S84小腿水平的血管损伤S85踝和足水平的神经损伤S94踝和足水平的血管损伤S95踝和足损伤(S90-S99)踝和足浅表损伤S90踝和足开放性伤口S91足骨折,除外踝S92踝和足水平的关节和韧带脱位、扭伤S93踝和足水平的肌肉和肌腱损伤S96累及身体多个部位的损伤头和颈的浅表损伤T00.0(T00-07)胸并伴有腹、下背和骨盆的浅表损伤T00.1上肢多个部位的浅表损伤T00.2下肢多个部位的浅表损伤T00.3上肢和下肢多个部位的浅表损伤T00.4其他复合部位的浅表损伤T00.8头和颈的开放性伤口T01.0胸并伴有腹、下背和骨盆的开放性伤口T01.1上肢多个部位的开放性伤口T01.2下肢多个部位的开放性伤口T01.3上肢和下肢多个部位的开放性伤口T01.4其他复合部位的开放性伤口T01.8头和颈的骨折T02.0胸并伴有腹、下背和骨盆的骨折T02.1上肢多个部位的骨折T02.2下肢多个部位的骨折T02.3上肢和下肢多个部位的骨折T02.4其他复合部位的骨折T02.8头和颈的脱位、扭伤T03.0胸并伴有腹、下背和骨盆的脱位、扭伤T03.1上肢多个部位的脱位、扭伤T03.2下肢多个部位的脱位、扭伤T03.3上肢和下肢多个部位的脱位、扭伤T03.4其他复合部位的脱位、扭伤T03.8头和颈的挤压伤T04.0胸并伴有腹、下背和骨盆的挤压伤T04.1上肢多个部位的挤压伤T04.2下肢多个部位的挤压伤T04.3上肢和下肢多个部位的挤压伤T04.4胸并伴有腹、下背和骨盆及四肢的挤压伤T04.7其他复合部位的挤压伤T04.8累及身体多个部位的损伤(T00-双手创伤性切断T05.0及身体多个部位的创伤性切断T05累及身体多个部位的挤压伤T04累及身体多个部位的脱位、扭伤T03累及身体多个部位的骨折T02踝和足挤压伤S97踝和足创伤性切断S98累及身体多个部位的浅表损伤T00累及身体多个部位的开放性伤口T01T07)一只手和另一臂创伤性切断T05.1双臂创伤性切断T05.2双足创伤性切断T05.3一只足和另一腿创伤性切断T05.4双小腿创伤性切断T05.5上肢和下肢任何组织创伤性切断T05.6躯干、四肢或身体未特指部位的损伤(T08-T14)躯干浅表损伤,水平未特指T09.0躯干开放性伤口,水平未特指T09.1躯干未特指关节和韧带的脱位、扭伤和劳损T09.2脊髓损伤T09.3躯干未特指神经、脊神经根和神经丛损伤T09.4躯干未特指肌肉和肌腱损伤T09.5躯干创伤性切断,水平未特指T09.6上肢浅表损伤,水平未特指T11.0上肢开放性伤口,水平未特指T11.1上肢未特指关节和韧带的脱位、扭伤和劳损T11.2上肢未特指神经的损伤T11.3上肢未特指血管的损伤T11.4上肢未特指肌肉和肌腱的损伤T11.5上肢创伤性切断T11.6下肢浅表损伤,水平未特指T13.0下肢开放性伤口,水平未特指T13.1下肢未特指关节和韧带的脱位、扭伤和劳损T13.2下肢未特指神经的损伤T13.3下肢未特指血管的损伤T13.4下肢未特指肌肉和肌腱的损伤T13.5下肢创伤性切断T13.6通过自然腔口进入异物的效应(T15-角膜异物T15.0T19)结合膜囊异物T15.1外眼其他和多处部位内异物T15.8耳内异物T16鼻窦内异物T17.0鼻孔内异物T17.1咽内异物T17.2下肢的其他损伤,水平未特指T13下肢骨折,水平未特指T12累及身体多个部位的创伤性切断T05脊柱骨折,水平未特指T08脊柱和躯干的其他损伤,水平未特指T09上肢骨折,水平未特指T10上肢的其他损伤,水平未特指T11外眼异物T15呼吸道内异物T17喉内异物T17.3气管内异物T17.4支气管内异物T17.5呼吸道其他和多处部位内异物T17.8烧伤和腐蚀伤(T20-一度烧伤T20.1T32)二度烧伤T20.2三度烧伤T20.3一度腐蚀伤T20.5二度腐蚀伤T20.6三度腐蚀伤T20.7一度烧伤T21.1二度烧伤T21.2三度烧伤T21.3一度腐蚀伤T21.5二度腐蚀伤T21.6三度腐蚀伤T21.7一度烧伤T22.1二度烧伤T22.2三度烧伤T22.3一度腐蚀伤T22.5二度腐蚀伤T22.6三度腐蚀伤T22.7一度烧伤T23.1二度烧伤T23.2三度烧伤T23.3一度腐蚀伤T23.5二度腐蚀伤T23.6三度腐蚀伤T23.7一度烧伤T24.1二度烧伤T24.2三度烧伤T24.3一度腐蚀伤T24.5二度腐蚀伤T24.6三度腐蚀伤T24.7一度烧伤T25.1二度烧伤T25.2三度烧伤T25.3一度腐蚀伤T25.5二度腐蚀伤T25.6三度腐蚀伤T25.7眼睑和眼周区烧伤T26.0角膜和结膜囊烧伤T26.1烧伤,伴有眼球破裂和破坏T26.2眼睑和眼周区腐蚀伤T26.5角膜和结膜囊腐蚀伤T26.6限于眼和附器的烧伤和腐蚀伤T26踝和足烧伤和腐蚀伤T25髋和下肢烧伤和腐蚀伤,除外踝和足T24呼吸道内异物T17头和颈烧伤和腐蚀伤T20躯干烧伤和腐蚀伤T21腕和手烧伤和腐蚀伤T23肩和上肢烧伤和腐蚀伤,除外腕和手T22腐蚀伤,伴有眼球破裂和破坏T26.7喉和气管烧伤T27.0呼吸道其他部位的烧伤T27.2喉和气管腐蚀伤T27.4呼吸道其他部位腐蚀伤T27.6口和咽烧伤T28.0食管烧伤T28.1消化道其他部位烧伤T28.2泌尿生殖器官内烧伤T28.3口和咽腐蚀伤T28.5食管腐蚀伤T28.6消化道其他部位腐蚀伤T28.7泌尿生殖器官内腐蚀伤T28.8一度烧伤T29.1二度烧伤T29.2三度烧伤T29.3一度腐蚀伤T29.5二度腐蚀伤T29.6三度腐蚀伤T29.7一度烧伤T30.1二度烧伤T30.2三度烧伤T30.3一度腐蚀伤T30.5二度腐蚀伤T30.6三度腐蚀伤T30.7面积少于10%的烧伤T31.010%-19%的烧伤T31.120%-29%的烧伤T31.230%-39%的烧伤T31.340%-49%的烧伤T31.450%-59%的烧伤T31.560%-69%的烧伤T31.670%-79%的烧伤T31.780%-89%的烧伤T31.890%或更多的烧伤T31.9面积少于10%的烧伤T32.010%-19%的烧伤T32.120%-29%的烧伤T32.230%-39%的烧伤T32.340%-49%的烧伤T32.450%-59%的烧伤T32.5烧伤和腐蚀伤(T20-60%-69%的烧伤T32.6T32)70%-79%的烧伤T32.780%-89%的烧伤T32.890%或更多的烧伤T32.9呼吸道烧伤和腐蚀伤T27其他内部器官的烧伤和腐蚀伤T28于眼和附器的烧伤和腐蚀伤T26身体多个部位的烧伤和腐蚀伤T29烧伤和腐蚀伤,身体部位未特指T30根据体表累及范围分类的烧伤T31根据体表累及范围分类的烧伤T31根据体表累及范围分类的腐蚀伤T32根据体表累及范围分类的腐蚀伤T32冻伤(T33-T35)放射性肿瘤铅及其他合物中毒(不包括四乙基铅)尘肺合并脏器功能不全 I 期尘肺合并脏器功能不全 II 尘肺合并脏器功能不全III期职 业 病 种 类尘肺合并症尘肺合并感染 I 期尘肺合并感染 II期尘肺合并感染III期浅表冻伤T33冻伤伴有组织坏死T34康复性治疗放射性疾病外照射慢性放射性病尘肺合并活动性肺结核 II期尘肺合并活动性肺结核III期尘肺合并肿瘤尘肺合并活动性肺结核 I 期锰及其他合物中毒慢性锰中毒慢性汞中毒中毒急性铅中毒慢性铅中毒汞及其他合物中毒急性汞中毒铍 病急性铍中毒慢性铍中毒镉及其他合物中毒急性镉中毒慢性镉中毒黑龙江省工伤职工停工留薪期分类目录(磷化氢、磷化锌、磷化铝中毒氰及腈类化合物中毒铊及其化合物中毒急性铊中毒铍 病慢性铍中毒中毒铊及其化合物中毒慢性铊中毒钡及其化合物中毒急性钡中毒钒及其化合物中毒急性钒中毒磷及其化合物中毒急性磷中毒氯气中毒急性氯气中毒甲醇中毒急性甲醇中毒砷及其化合物中毒慢性砷中毒砷化氢中毒急性砷化氢中毒氨气中毒急性氨气中毒偏二甲基肼中毒急性偏二甲基肼中毒二氧化硫中毒急性二氧化硫中毒光气中毒急性光气中毒二硫化碳中毒慢性二硫化碳中毒急性磷化氢中毒急性丙烯腈中毒氮氧化合物中毒急性氮氧化合物中毒一氧化碳中毒急性一氧化碳中毒四乙基铅中毒慢性四乙基铅中毒慢性氯乙烯中毒急性苯中毒四乙基铅中毒慢性四乙基铅中毒有机锡中毒急性三烷基锡中毒羰基镍中毒急性羰基镍中毒二甲苯中毒急性二甲苯中毒慢性二甲苯中毒正乙烷中毒慢性正乙烷中毒慢性苯中毒甲苯中毒急性甲苯中毒慢性甲苯中毒苯中毒有机氟聚合物中毒急性有机氟中毒四氯化碳中毒急性四氯化碳中毒汽油中毒急性溶剂汽油中毒慢性溶剂汽油中毒一甲胺中毒急性一甲胺中毒氯乙烯中毒急性氯乙烯中毒氯乙烯中毒慢性氯乙烯中毒三氯乙烯中毒急性三氯乙烯中毒氯丙烯中毒慢性氯丙烯中毒中毒苯的氨基硝基化合物中毒急性二甲基甲酰胺中毒急性氨基甲酸酯类中毒溴甲烷中毒急性溴甲烷中毒溴甲烷中毒急性溴甲烷中毒职业性皮肤病职业性中毒氯丙烯中毒慢性氯丙烯中毒三硝基甲苯中毒慢性三硝基甲苯中毒酚中毒急性酚中毒氯丁二烯中毒急性氯丁二烯中毒慢性氯丁二烯中毒苯胺类中毒硫酸二甲酯中毒急性硫酸二甲酯中毒丙烯酰胺中毒慢性丙烯酰胺中毒五氯酚(钠)中毒急性五氯酚(钠)中毒甲醛中毒急性甲醛中毒拟除虫菊酯类中毒二甲基甲酰胺中毒有机磷类中毒急性有机磷类中毒氨基甲酸酯类中毒化学性皮肤灼伤化学性眼部灼伤杀虫脒中毒急性杀虫脒中毒中毒眼病职业性肿瘤其他职业病电光性眼炎职业性白内障肝血管肉瘤职业性哮喘职业性急性变态反应性肺泡炎膀胱癌类目录停工留薪期1月1月3月6月3月4月4月4月4月6月4月1月4月4月6月8月6月6月6月6月6月6月6月1月6月10月3月6月6月6月6月3月1月6月6月6月4月1月3月3月3月1月1月3月5月1月1月7月7月8月4月6月6月8月2月2月12月12月12月12月12月6月6月1月2月1月2月2月6月8月3月3月6月4月6月6月2月2月12月12月10月6月6月3月3月3月6月8月8月3月3月2月10月6月2月1月3月2月1月2月6月4月4月5月6月5月6月6月6月2月2月12月12月12月12月12月12月6月6月6月8月6月6月6月6月8月6月6月6月3月12月3月3月3月3月3月6月6月1月2月4月6月6月6月6月4月5月5月5月2月2月2月12月12月12月5月5月2月6月6月3月1月2月6月6月5月5月6月6月6月5月5月5月5月2月12月12月12月12月5月5月2月8月8月3月1月2月6月4月4月4月4月3月3月5月3月2月2月12月12月12月6月6月6月5月5月2月3月2月3月6月6月1月1月2月8月8月2月2月6月2月12月6月6月2月6月1月2月8月8月8月4月6月6月8月5月6月6月6月8月12月5月5月2月6月6月1月2月6月6月4月4月3月3月6月6月3月5月3月2月1月12月12月12月10月10月10月5月5月6月1月2月2月2月2月1月3月6月2月2月2月2月6月8月8月8月8月6月6月6月6月6月6月6月2月2月2月3月1月1月2月6月6月6月6月6月6月6月1月2月2月12月6月6月6月4月2月2月2月6月6月6月6月3月1月2月2月6月5月6月6月1月1月2月1月1月1月1月3月3月6月1月6月12月1月6月12月1月6月12月1月6月12月1月6月12月1月6月12月1月6月12月1月6月12月1月6月12月1月6月12月1月6月12月1月6月12月6月8月12月8月8月12月12月12月12月8月12月8月12月12月8月8月12月1月8月12月1月8月12月1月8月12月1月8月12月1月4月4月8月8月8月8月12月12月12月1月4月4月8月8月8月8月12月12月12月12月停工留薪期1月3月6月3月6月12月8月6月9月12月3月一度6月二度12月重度12月轻度1月重度6月轻度3月中度6月重度12月轻度1月中度2月重度12月轻度3月中度6月重度12月轻度6月重度12月轻度1月重度6月轻度6月重度12月轻度3月重度6月轻度6月全 I 期全 II 期全III期期期期核 II期核III期核 I 期目录(职业病)轻度3月重度12月轻度6月重度12月轻度1月中度2月重度6月轻度1月重度6月轻度3月中度6月重度12月轻度6月重度12月轻度2月重度6月轻度1月中度3月重度12月轻度1月重度12月轻度1月中度3月重度12月轻度1月中度3月重度12月轻度1月中度3月重度12月轻度1月重度6月轻度1月中度3月重度12月轻度1月重度12月轻度3月重度12月轻度1月重度3月轻度1月重度3月轻度1月轻度1月中度3月重度6月轻度1月中度3月重度6月轻度1月重度6月轻度6月中度9月重度12月轻度1月重度6月轻度6月中度9月重度12月轻度1月重度6月轻度6月中度9月重度12月轻度6月重度12月轻度1月重度6月轻度3月中度6月重度12月轻度1月中度3月重度6月轻度6月中度9月重度12月轻度1月重度12月轻度1月重度3月轻度3月中度6月重度12月轻度1月重度3月轻度3月重度12月轻度1月重度3月轻度3月重度12月轻度1月中度2月重度6月轻度3月中度6月重度12月轻度1月重度6月轻度1月重度3月轻度1月中度3月重度6月轻度1月中度3月重度12月轻度1月中度2月重度6月轻度1月中度3月重度6月轻度1月中度2月重度6月轻度1月重度2月轻度1月中度2月重度3月轻度1月重度6月轻度1月重度3月轻度14天中度6月重度12月轻度14天中度6月重度12月轻度14天中度2月重度12月轻度1月中度3月重度6月12月12月轻度3月重度12月轻度1月重度3月。
部分材料特性表

835 635 685 540 785 835 885 635 885 785 930 490 490 610 685 735 785
45Cr 50Cr 38CrSi 12CrMo 15CrMo 20CrMo 30CrMo 30CrMoA 35CrMo 42CrMo 12CrMoV 35CrMoV 12Cr1MoV 25Cr2MoVA 25CrMo1VA 38CrMoAl 40CrV 50CrVA 15CrMn 20CrMn 40CrMn 20CrMnSi 25CrMnSi 30CrMnSi 30CrMnSiA 35CrMnSiA 20CrMnMo 40CrMnMo 20CrMnTi 30CrMnTi 20CrNi 40CrNi 45CrNi 50CrNi 12CrNi2 12CrNi3 20CrNi3 30CrNi3 37CrNi3 12Cr2Ni4 20Cr2Ni4 20CrNiMo 40CrNiMoA 18CrMnNiMoA 45CrNiMoVA 18Cr2Ni4WA 25Cr2Ni4WA 弹簧钢 65 70 85 65Mn 55Si2Mn GB/T1222-1984热处理
1030 1080 980 410 440 885 930 930 980 1080 440 1080 490 930 735 980 885 1280 785 930 980 785 1080 1080 1080 1620 1180 980 1080 1470 785 980 980 1080 785 930 930 980 1130 1080 1180 980 980 1180 1470 1180 1080
5 5-1 5-2 5-3 5-4 5-5 5-6 5-7 5-8 5-9 5-10 5-11 5-12
可锻铸铁 KTH300-06 KTH330-08 KTH350-10 KTH370-12 KTZ450-06 KTZ550-04 KTZ650-02 KTZ700-02 KTB350-04 KTB380-12 KTB400-05 KTB450-07
EN1T11中文资料

EN1T11中⽂资料FeaturesHarmonic Current Attenuation to EN61000-3-2 EMI Filtering to EN55022, Level B Transient Immunity to EN61000-4-5 575W Rated Power Output Autoranging 115/230Vac Input Microprocessor Control Inrush Current LimitingProduct HighlightsThe ENMods system is a new AC front end solution for compliance to electromagnetic compatibility (EMC) standards. It consists of the MiniHAM — a passive harmonic attenuation module and the FARM3 — an auto ranging AC-DC front end /doc/be6f2843c850ad02de8041d2.html bined with the filtering and hold-up capacitors as specified herein, the ENMods system provides full compliance to:EN61000-3-2 Harmonic CurrentEN55022, Level B Conducted Emissions EN61000-4-5 Surge Immunity EN61000-4-11 Line Disturbances The MiniHAM is the first passive product specifically designed for compliance to EN harmonic current limits. Unlike active PFC solutions, the MiniHAM generates no EMI,greatly simplifying and reducing systemnoise filtering requirements. It is alsoconsiderably smaller and more efficient than active alternatives and improves MTBF by an order of magnitude. Optimized for operation on the DC bus (provided by the FARM3) rather than directly on the AC line,it will provide harmonic current compliance up to 600W of input power at 230Vac. The 115/230Vac input FARM3 is a new member of Vicor’s Filter and Autoranging Module product line that has been optimized for use as the front end for the MiniHAM.Both modules are in Vicor’s standard Mini half-brick package. Together with Vicor’s 1st or 2nd Generation 300V input DC-DC converters, they form the basis of a low noise, high efficiency, rugged, simple and reliable EN compliant power system.Data SheetENModsTMComponent Power Front End System for EN Compliance4Each module:2.28 x 2.2 x 0.5 in 57,9 x 55,9 x 12,7 mmAbsolute MaximumRatingsThermal ResistancePart Numbering*EN1 product includes one each MiniHAM and FARM3 with same product grade, pin and baseplate style.**Pin styles S & N are compatible with the ModuMate interconnect system for socketing and surface mounting.ParameterMin Typ Max Unit NotesOperating input voltage 90115132Vac Autoranging (doubler mode)Operating input voltage 180230264Vac Autoranging (bridge mode)Input undervoltage 90Vac No damageAC line frequency 4763HzC-,T-, H- and M-Grade Power factor 0.680.72Typical line Inrush current 30Amps 264Vac line voltage Efficiency 9496%Full loadAC Bus OK (BOK)Low state resistance 15?To negative output - Bus normal Low state current 50mA Bus normalHigh state voltage 14.815.015.2Vdc Bus abnormal, 27k internal pull up to 15Vdc (see Figure12)BOK true threshold 235240245Vdc Output Bus voltage BOK false threshold 200205210VdcOutput Bus voltageModule Enable (EN)Low state resistance 15?To negative output - Converters disabledLow state current 50mA High state voltage 14.815.015.2Vdc 150k internal pull up to 15Vdc (see Figure 11)Enable threshold 235240Vdc Output bus voltage Disable threshold 185190195Vdc Output bus voltageAC Bus OK - Module Enable, differential error*151720VdcAC Bus OK and Module Enable thresholds track FARM3 MODULE SPECIFICATIONS (see Figure 3 thru Figure 7 for operating characteristics)MINIHAM MODULE SPECIFICATIONS (when used in accordance with Figure 1a)Electrical CharacteristicsElectrical characteristics apply over the full operating range of input voltage, output power and baseplate temperature, unless otherwise specified. All temperatures refer to the operating temperature at the center of the baseplate. Performance specifications are based on the ENMods system as shown in Figure 1a.*Tracking error between BUS OK and Enable thresholdsELECTROMAGNETIC COMPATIBILITY (configured as illustrated in Figures 1a and 1b)Harmonic currents EN61000-3-2, Amendment 1450-625W, 230Vac input 575W output (see Figure 2)Input line disturbances EN61000-4-11Input surge withstand EN61000-4-52kV–50 µs common mode 1kV–50 µs differential mode Conducted emissionsEN55022, Level B(See Figures 8a thru 8c)Electrical Characteristics (continued)MODULE GENERAL SPECIFICATIONSParameter Min Typ Max Unit NotesSafety approvalsFARM3TüV + VDE EN60950, CE Marked (pending) MiniHAM CE Marked (pending)Isolation (in to out)None Isolation provided by DC-DC converter(s) Dielectric withstand (I/O to baseplates)1500Vrms Baseplate earthedLeakage current 2.5mA264VacMTBF>1,000,000Hours25?C, Ground BenignBaseplate material AluminumCover Dupont Zenite / AluminumPin material–Style 1 & 2Copper, Tin/Lead solder dipped–Style S & N (ModuMate compatible)Copper, Nickel/Gold platingWeightFARM3 3.1(88)Ounces (grams)MiniHAM 5.1(145)Ounces (grams)Size 2.25 x 2.2 x 0.5Inches Vicor’s standard mini half-brick package57,9 x 55,9 x 12,7mmStorage temperature(C-, T-Grade)-40+125°C(H-Grade)-55+125°C(M-Grade)-65+125°COperating temperature(C-Grade)-20+100°C Baseplate(T-, H-Grade)-40+100°C Baseplate(M-Grade)-55+100°C BaseplateFigure 1a—ENMods system and DC-DC converter interconnection drawingOperating Characteristics— Input EMI filter for EN55022, Level B complianceFigure 1b ArrayFigure 2 —Measured harmonic current at 230VAC, 575W vs. EN spec limits *Measured values of even harmonics are below 0.01AOperating Characteristics (FARM3)Figure 3—Start-up at 120Vac input Figure 6—Power-down from 240VacFigure 4—Start-up at 240Vac inputVdc outputStrap EngagedI ac input @2A / mVI ac input @2A / mVEnable Enable B OKVdc outputB OKVdc output Enable B OKVdc outputEnableB OKFigure 7—Output overvoltage protection 240Vac rangeVdc outputEnableB OKOperating Characteristics (Conducted emissions relative to EN55022 Reference Figure 1a)Quasi Peak and Average LimitsFigure 8a —Peak detectionFigure 8b —Quasi peak detectionFigure 8c —Average detectionThe ENMods system provides an effective solution for the AC front end of a power supply built with Vicor DC-DC converters.This high performance power system building block satisfies a broad spectrum of requirements and agency standards.The ENMods system provides transient/surge immunity, harmonic current attenuation and EMI filtering, in addition to all of the power switching and control circuitry necessary for autoranging rectification, inrush current limiting, and overvoltage protection.Converter enable and status functions for orderly power up/down control or sequencing are also provided. To complete the AC front end configuration, the user only needs to add hold-up capacitors,a simple EMI filter, and a few discrete components (Fig 1A).Functional Description (F ARM3, see Figures 9 & 10)Power-Up Sequence.Upon application of input power, the hold-up capacitorsbegin to charge. The thermistor limits the charge current,and the exponential time constant is determined by the hold-up capacitor value and the thermistor cold resistance.The slope (dv/dt) of the capacitor voltage versus time approaches zero as the capacitors become charged to the peak of the AC line voltage.The switch that bypasses the inrush limiting PTC (positive temperature coefficient) thermistor is open when power is applied, as is the switch that engages the strap for voltage doubling. In addition, the converter modules are disabled via the Enable (EN) line, and Bus-OK (BOK) is high.If the bus voltage is less than 200V as the slope nearszero, the voltage doubler is activated, and the bus voltage climbs exponentially to twice the peak line voltage. If the bus voltage is greater than 200V , the doubler is not activated.If the bus voltage is greater than 235V as the slopeapproaches zero, the inrush limiting thermistor is bypassed. Below 235V , it is not bypassed.The converters are enabled 50 milliseconds after thethermistor bypass switch is closed.Bus-OK is asserted after an additional 50 milliseconddelay to allow the converter outputs to settle within specification.Power-Down Sequence.When input power is turned off or fails, the following sequence occurs as the bus voltage decays:Bus-OK is deasserted when the bus voltage falls below210Vdc.The converters are disabled when the bus voltage fallsbelow 190Vdc. If power is reapplied after the converters are disabled, the entire power-up sequence is repeated. If a momentary power interruption occurs and power is reestablished before the bus reaches the disable threshold, the power-up sequence is not repeated, i.e., the power conversion system “rides through” the momentary interruption.Application NoteFigure 9—Functional block diagram: FARM3 module Figure 10—Timing diagram: power-up/down sequence1.12.13.14.15.11.22.2Off-Line Power Supply ConfigurationThe ENMods system maintains the DC output bus voltage between 250 and 370Vdc over the entire input voltage range, which is compatible with all Vicor 300V input converters. Autoranging automatically switches to the proper bridge or doubler mode at startup depending on the input voltage, eliminating the possibility of damage due to improper line connection. The ENMods system is rated at 575W output power. These modules can serve as the AC front end for any number and combination of compatible converters as long as the maximum power rating is not exceeded.Pin Descriptions (see Figure 1a)Strap (ST) Pin.In addition to input and output power pin connections, it is necessary to connect the Strap pin to the center junction of the series hold-up capacitors (C1, C2)for proper (autoranging) operation. Varistors V1 and V2 provide capacitor protection. The bleeder resistors (R1, R2)discharge the hold-up capacitors when power is switched off. Capacitors C7 and C8 are recommended if the hold-up capacitors are located more than 3 inches from the output pins.Enable (EN) Pin.The Enable pin must be connected to the PC or Gate-In pin of all converter modules to disable the converters during power-up. Otherwise, the converters would attempt to start while the hold-up capacitors are being charged through the current limiting thermistor,preventing the bus voltage from reaching the thermistor bypass threshold, thus disabling the power supply. The Enable output (the drain of an N channel MOSFET) is internally pulled up to 15V through a 150k?resistor. (see Figure 11)A signal diode should be placed close to and in series with the PC or (Gate-In) pin of each converter to eliminate the possibility of control interference between converters.The Enable pin switches to the high state (15V) with respectto the SR pin to turn on the converters after the power-up inrush is over. The Enable function also provides input overvoltage protection for the converters by turning off the converters if the DC bus voltage exceeds 400Vdc. The thermistor bypass switch opens if this condition occurs, placing the thermistor in series with the input voltage, which reduces the bus voltage to a safe level while limiting input current in case the varistors conduct. The thermistor bypass switch also opens if a fault or overload reduces the bus voltage to less than 180Vdc. (see Figure 9)Bus-OK (BOK) Pin.(see Figure 12)The Bus-OK pin is intended to provide early-warning power fail information and is also referenced to the SR pin.Caution: There is no input to output isolation in the ENMods.It is necessary to monitor Bus-OK via an optoisolator if it is to beused on the secondary (output) side of the converters. A line isolation transformer should be used when performing scope measurements. Scope probes should never be applied simultaneously to the input and output as this will destroy the unit.L, N Pins.Line and neutral input.+, – Pins. Positive and negative outputs.SR Pin. Signal return for BOK and EN outputsFilter(see Figure 1b)The input EMI filter consists of differential and common mode chokes,Y– rated capacitors (line-ground) and X– rated capacitors (line-line). This filter configuration provides sufficient common mode and differential mode insertion loss in the frequency range between 100kHz and 30MHz to comply with the Level B conducted emissions limit, as illustrated in Figures 8a thru 8c.Hold-up CapacitorsHold-up capacitor values should be determined according to output bus voltage ripple, power fail hold-up time, and ride-through time (see Figure 13). Many applications require the power supply to maintain output regulation during a momentary power failure of specified duration, i.e., the converters must hold-up or ride through such an event while maintaining undisturbed output voltage regulation. Similarly, many of these same systems require notification of an impending power failure in order to allow time to perform an orderly shutdown.The energy stored on a capacitor which has been charged to voltage V is:ε= 1/2(CV2) (1) Where:ε= stored energyC = capacitanceV = voltage across the capacitorEnergy is given up by the capacitors as they are discharged by the converters. The energy expended (the power-time product) is:ε= P?t = C(V12–V22) / 2 (2) Where: P = operating powert = discharge intervalV1= capacitor voltage at the beginning of ?tV2= capacitor voltage at the end of ?t Rearranging Equation 2 to solve for the required capacitance:C = 2P?t / (V12–V22) (3)Figure 16—Ripple voltage vs. operating power and bus capacitance, series combination of C1, C2 (see Figure 1a)Figure 15—Ride-through time vs. operating powerFigure 13—Hold-up timeFigure 12—Bus OK (BOK) isolated power status indicatorFigure 11—Enable (EN) functionCalculated values of bus capacitance for various hold-up time,ride-through time, and ripple voltage requirements are given as a function of operating power level in Figures 14, 15, and 16, respectively.ExampleIn this example, the output required from the DC-DC converter at the point of load is 12Vdc at 320W. Therefore, the output power from the ENMods would be 375W (assuming a converter efficiency of 85%). The desired hold-up time is 9ms over an input range of 90 to 264Vac.Determining Required Capacitance for Power Fail Warning.Figure 14 is used to determine capacitance for a given power fail warning time and power level, and shows that the total bus capacitance should be at least 820µF. Since two capacitors are used in series, each capacitor should be at least 1,640µF. Note that warning time is not dependent on line voltage. A hold-up capacitor calculator is available on the Vicor website, at /doc/be6f2843c850ad02de8041d2.html .Determining Ride-through Time.Figure 15 illustrates ride-through time as a function of line voltage and output power,and shows that at a nominal line of 90Vac, ride-through would be 68ms. Ride-through time is a function of linevoltage.Determining Ripple Voltage on the Hold-up Capacitors.Figure 16 is used to determine ripple voltage as a function of operating power and bus capacitance, and shows that the ripple voltage across the hold-up capacitors will be 12V p-p.Determining the Ripple on the Output of theDC-DC Converter.Figure 17 is used to determine the ripple rejection of the DC-DC converter and indicates a ripplerejection of approximately 60 dB for a 12V output. Since the ripple on the bus voltage is 12Vac and the ripple rejection of the converter is 60 dB, the output ripple of the converter due to ripple on its input (primarily 120 Hz) will be 12mV p-p. Note that 2nd Generation converters have greater ripple rejection then either VI-200s or VI-J00s.A variety of hold-up capacitor assemblies (HUBs) areavailable. Please visit the Vicor website @ /doc/be6f2843c850ad02de8041d2.html .For more information about designing an autorangingAC input power supply using the ENMods and Vicor DC-DC converter modules, contact Vicor Applications Engineering at the nearest Vicor Technical Support Center, or send E-mail toapps@/doc/be6f2843c850ad02de8041d2.html .The power fail warning time (?t) is defined as the interval between BOK and converter shutdown (EN) as illustrated in Figure 13. The Bus-OK and Enable thresholds are 205V and 185V, respectively. A simplified relationship between hold-up time, operating power, and bus capacitance is obtained by inserting these constants in equation (3):C = 2P ?t / (2052– 1852)C = 2P ?t / (7,800)It should be noted that the series combination (C1, C2, see Figure 1a)requires each capacitor to be twice the calculated value, but the required voltage rating of each capacitor is reduced to 200V.Allowable ripple voltage on the bus (or ripple current in the capacitors) may define the capacitance requirement. Consideration should be given to converter ripple rejection and resulting output ripple voltage. The ripple rejection (R) of Vicor converters is specified as a function of the input/output voltage ratio:R = 30 + 20log(Vin / Vout)(4)For example, a converter whose output is 15V and nominal input is 300V will provide 56dB ripple rejection, i.e., 10V p-p of input ripple will produce 15mV p-p of output ripple (see Figure 17). Equation 3 is again used to determine the required capacitance. In this case, V 1and V 2are theinstantaneous values of bus voltage at the peaks and valleys (see Figure 13)of the ripple, respectively. The capacitors must holdup the bus voltage for the time interval (?t) between peaks of the rectified line as given by:t = (π– θ) / 2πf(5)Where:f = line frequencyθ= rectifier conduction angleThe approximate conduction angle is given by:θ= Cos -1(V 2/V 1)(6)Another consideration in hold-up capacitor selection is their ripple current rating. The capacitors’ rating must be higher than the maximum operating ripple current. The approximate operating ripple current (rms) is given by:I rms = 2P/V ac (7)Where: P = total output powerV ac = operating line voltageMechanical DiagramINBOARDSOLDER ONBOARD SOLDER ALUMINUM BASEPLA TEVicor’s comprehensive line of power solutions includes modular, high density DC-DC converters and accessory components, configurable power supplies, and custom power systems.Information furnished by Vicor is believed to be accurate and reliable. However, no responsibility isassumed by Vicor for its use. No license is granted by implication or otherwise under any patent or patent rights of Vicor. Vicor components are not designed to be used in applications, such as life support systems,wherein a failure or malfunction could result in injury or death. All sales are subject to Vicor’s Terms and Conditions of Sale, which are available upon request.Specifications are subject to change without notice.Vicor Corporation 25 Frontage Road Andover, MA, USA 01810Tel: 800-735-6200Fax: 978-475-6715EmailVicor Express: vicorexp@/doc/be6f2843c850ad02de8041d2.html Technical Support: apps@/doc/be6f2843c850ad02de8041d2.htmlComponent Solutions for Your Power System4元器件交易⽹/doc/be6f2843c850ad02de8041d2.html。
第四章 FeC合金及其应用讲解

0.0218%
0.77%
各相的相对量: 室温组织:
Fe3C % ≈ 0.4 F/+6P,.65900×= 6 % F % ≈ 1 – 6 % = 94 %
6.69%
亚共析钢的结晶过程
• 共析钢
共析钢的结晶过程
0.77%C钢
共析钢金相组织图
Fe3C
0.77 6.69
100%
11.5%
6.69%
• 共析钢的结晶过程
• 过共析钢
㈣ 过共析钢的结晶过程
以1.2%C钢为例
过共析钢的组织金相图
Fe3C
P
珠光体和二次网状渗碳体
过共析钢的成分计算
1.2% 0.77%
各组织组成物的相对量:
Fe3CII % = ( 1.2 – 0.77 ) / ( 6.69 – 0.77 )
• T12~T13:制造耐磨工具,如锉刀、锯条等。
丝锥
手锯条
锉刀
头钻
铸铁相图及其应用
三、典型合金的平衡结晶过程
Fe-C 合金分类:
白口铸铁 —— 2.11 % < C % < 6.69 %, 铸造性能好, 硬而脆 亚共晶白口铁 < 4.3 % 共晶白口铁 = 4.3 % 过共晶白口铁 > 4.3 %
• 常以热轧板、带、棒及型钢使 用,用量约占钢材总量的70%。
• 用于建筑结构,适合焊接、铆 接、栓接等。
热轧钢板 黄河小浪底枢纽工程
螺纹钢
一、在钢铁选材方面的应用
刀具、模具、量具要用硬度和耐磨性好的材料,选用碳含 量高的高碳钢。
碳素工具钢
碳素工具钢
T + 数字
Guideline for Structural Health Monitoring F08b

SAMCO Final Report 2006 F08b Guideline for Structural Health Monitoring
CONTENTS
1 2 3 3.1 3.1.1 3.1.1.1 3.1.1.2 3.1.2 3.1.2.1 3.1.2.2 3.1.3 3.2 3.3 3.3.1 3.3.2 3.3.2.1 3.3.2.2 3.3.2.3 3.3.2.4 3.3.2.5 3.3.2.6 3.3.2.7 3.3.2.8 3.3.2.9 3.3.3 3.3.4 3.3.5 3.3.5.1 4 4.1 4.2 4.2.1 4.2.2 4.2.3 4.2.4 4.2.4.1 4.2.4.2 4.2.4.3 4.2.5 Introduction........................................................................................ 5 Objectives and outline of the guideline............................................ 6 Analysis of actions ............................................................................ 7 Classification of actions ........................................................................7 Type of actions .........................................................................................7 Static loads.........................................................................................7 Dynamic loads....................................................................................7 Character of actions .................................................................................8 Dead loads .........................................................................................8 Live loads ...........................................................................................8 Loads and load effects .............................................................................8 Objectives and approach to action analysis ........................................8 Determination of actions based on dimension, duration and local effect .......................................................................................................9 Measurands for characterisation of actions ..............................................9 Determination of actions.........................................................................10 Monitoring pattern ............................................................................10 Wind loads .......................................................................................11 Wave loads and swell loads .............................................................11 Traffic loads......................................................................................11 Loading by displacements ................................................................12 Weight loads ....................................................................................12 Impact and collision loads; vibrations ...............................................12 Temperature loads ...........................................................................13 Effects caused by physical - chemical processes .............................13 Load combinations .................................................................................13 Use and analysis of measurement data..................................................14 Load models...........................................................................................14 Calibration of load models ................................................................15 Diagnostic of structures.................................................................. 16 Preamble ...............................................................................................16 Structural Condition Analysis .............................................................16 Description of design and construction of the structure...........................16 Determination of threshold values for position stability, serviceability and load bearing capacity.......................................................................17 Structural identification ...........................................................................18 Application of NDT techniques ...............................................................19 Steel structures ................................................................................19 Reinforced and prestressed structures .............................................19 Masonry structures...........................................................................20 Field tests...............................................................................................20
- 1、下载文档前请自行甄别文档内容的完整性,平台不提供额外的编辑、内容补充、找答案等附加服务。
- 2、"仅部分预览"的文档,不可在线预览部分如存在完整性等问题,可反馈申请退款(可完整预览的文档不适用该条件!)。
- 3、如文档侵犯您的权益,请联系客服反馈,我们会尽快为您处理(人工客服工作时间:9:00-18:30)。
EFFECTIVE GOVERNMENT POLICY AND INSTITUTIONAL FRAMEWORKS: PIVOTS FOR THE DISSEMINATION AND SUSTAINABILITY OF SOLAR PV IN RURAL AREAS IN THE DEVELOPING WORLD: THE CASE OF GHANASimon BawakyillenuoThe University of Hull, HullDepartment of GeographyCottingham RoadHU6 7RXUnited KingdomS.Bawakyillenuo@,bawasius@ABSTRACTThe integration of solar PV into rural electrification programmes in the developing world has brought in its wake dissemination/adoption and sustainability challenges.In looking for ways that can enhance the wider dissemination of the technology in the developing world, some authors (e.g. Philips and Browne, 1999; H ankins, 2000) have advocated the greater involvement of the private sector. While the private sector could well play a role in the PV dissemination drive, this paper by contrast argues that effective government institutional and policy frameworks are the most pivotal elements in the drive to disseminate solar PV systems to the majority of the rural poor in the developing world, and to sustain them. Using two case studies, the paper contextualises the interrelationship between ineffective government institutional and policy frameworks and the low level of solar PV dissemination in rural Ghana as well as the lack of sustainability of PV projects.1. INTRODUCTIONEnergy resources have always played an important role in the development of human society. Since the industrial revolution, energy has been a driving force for the development of modern civilization. It has been recognised at the global level that the provision of a modern source of energy such as electricity, has been the sine qua non for many of the advancements made in economic growth, employment opportunities, healthcare, education as well as improvements in living standards. This therefore implies that communities (rural and urban) will stand a better chance of achieving both social and economic prosperity, once they have an effective and reliable source of energy. For instance, the International Energy Agency (IEA) (2002) notes that the “lack of electricity exacerbates poverty and contributes to its perpetuation, as it precludes most industrial activities and the jobs they create” (p.33).Between 1970 and 1990, 800 million people in rural areas worldwide did gain access to electricity (Amulya et al., 2000). H owever, at present, the number of rural people without access to electricity is more than twice (i.e. two billion) this number, and most of them live in the rural areas of the developing world, especially Africa (Duke et al., 2002). More than 83% of Africa’s rural population is without electricity, and even worse in Sub-Saharan Africa where more than 92% of the rural population is unelectrified (Agumba, 2002). The extension of the conventional grid to most rural households has generally11 STRATEGIES AND POLICIES2879been considered as financially unviable since the 1970s dueto the remoteness and low density of settlements. Similarly, the micro-grid alternative, using diesel-powered electric generators is also rendered largely unviable. Against this backdrop, solar PV , especially solar household systems (SHSs) have been considered by many donor organisations, national governments, academics, researchers, etc., not only as the least-cost option for remote rural electrification in the developing world, but also the most environmentally benign energy source, with an inexhaustible physical resource base. Without doubt, the potential usefulness of SH S in rural areas in the developing world can’t be overemphasised.Notwithstanding the relative advantages involved in extending the SH S to the rural areas as compared to the national grid, the wider scale dissemination of the technology to most rural areas in the developing world, especially Sub-Sahara Africa, remains elusive (Table 1). Using two solar PV projects in Ghana as case studies, this paper examines the interplay between solar PV policies and institutional arrangements of Ghana, and the adoption and sustainability trajectories of solar PV in rural areas. Many, including Martinot et al. (2001) have outlined barriers and solutions to the dissemination of solar PV in the developing world. Philips and Browne (1999) and others for instance, argue that the private sector is most critical for solar PV TABLE 1: ESTIMATED NUMBER OF SOLAR PV SYSTEMS DISSEMINATED IN AFRICACOUNTRYESTIMATED NUMBER OF SOLAR PV DISSEMINATEDBurundi 1,800Djibouti 941Malawi 900Eritrea 2,000 Uganda 3,000 Ghana 4,601Ethiopia 5,000Botswana 8,000Zimbabwe 85,000Kenya 150,000 South Africa 150,000Source: Edjekumhene, 2003; Karekezi and Kithyoma, 2005market development in the developing world. While not discounting completely the role of the private sector in solar PV dissemination, this paper, however, argues that effective institutional and policy frameworks of governments are the most pivotal structures for the dissemination and sustainability of the technology in the rural areas, especially in countries with well developed grid networks, such as Ghana.2. CONCEPTUALISING THE EFFECTIVENESS AND INEFFECTIVENES OF INSTITUTIONAL AND POLICY ARRANGEMENTS FOR SOLAR PV DISSEMINATION Effective government institutional and policy arrangements can have the effect of boosting the adoption of solar PV in the rural areas, and are classified as ‘stimulants’ to solar PV dissemination. As Sawin (2004) notes “... a sustained renewable energy market can be developed quickly and efficiently if the right combination of policies is adopted” (p: 1). Conversely, ineffective institutional and policy arrangements have the effect of undermining the adoption of the technology and distorting the sustainability of already installed solar PV systems. These can therefore be classified as ‘barriers’ to the dissemination of the technology. On a geographic scale, the dissemination and sustainability dynamics of solar PV are interdependent on the relative effectiveness of the institutional and policy arrangements at the national and local/regional levels.At the national level, effective institutional and policy arrangements for PV include: a well-defined energy policy; strong regulatory institutions; efficient legislation;well-defined and resourced energy departments; pro-energyfinancial institutions. At the regional/local level,complementary pillars of effective institutional arrangements include: an indigenous committee withoversight responsibilities for local energy projects; a regional/district office responsible for monitoring rural energy projects and the activities of the indigenous committee; efficient communication links between theindigenous committee, regional/district office and projectsimplementers; maintenance fund for community projects.Proceedings of ISES Solar World Congress 2007: Solar Energy and Human Settlement 28803. GEOGRAPHICAL PERSPECTIVES OF GHANA Ghana has a population of approximately 22.4 million, 54 percent of whom live in the rural areas. Currently, 43 percent of the population have access to electricity (77 percent for urban, but only 17 percent for rural). In consequence, approximately 82 percent of rural household still use kerosene, candles, dry cells batteries, oil lamps for lighting and fuelwood for cooking. Agricultural activities (fishing, farming and livestock rearing) are the fundamental economic and subsistence activities in rural Ghana. Crop farming in particular is rain dependent — poor rainfall leads to poor yields and in years of extreme drought, none at all. Although Ghana has approximately twice the per capita output of poorer countries in West Africa, poverty is widespread in the rural areas, accounting for about 84 percent of Ghana’s poor. Thus, the success of any solar PV rural electrification measures partly depends on their congruence with the characteristics of these rural areas.4. TWO SOLAR PV PROJECTS CASE STUDIES:GHANAThe two case studies were carried out through field survey in 2005 by the author. The projects are the Government of Ghana/Spanish Government off-grid solar PV rural electrification project in Wechiau in Wa West District (1998) and the UNDP/GEF/Ghana Government Renewable Energy Service Project (RESPRO) in Bunkpurugu/Yunyoo District in 1999. The goal of the Wechiau project was to assess the social, economic and technical performance of solar PV as an instrument for rural electrification in off-grid communities. The project comprised of a battery centre and SH Ss, with the implementing body being the Ministry of Energy (MOE). The financing mechanism used to supply the SH Ss to customers was the fee-for-service. While customers paid a flat installation fee of ¢100,000 cedis (US$ 13.92), users of both the 50Wp and 100Wp modules paid ¢15,000 (US$2.09) and ¢25,000 (US$3.48) monthly tariffs respectively. The Wechiau project was managed by two formal indigenous groups after its implementation (i.e. operators of the battery charging centre and a solar committee) with different responsibilities. Operators of the battery charging centre were tasked with charging of batteries commercially, give the fees charged to the solar committee, and undertaking basic servicing of the community lighting systems. The solar committee was to collect the monthly tariff from the users on behalf of the MOE and deposit it at the bank.Implemented from 1999 to 2004, the main aim of RESPRO was to initiate the development of a commercial market for renewable-based electricity services in rural Ghana, with an initial emphasis on solar PV. An individual customer could apply for one of two SHSs, 50Wp and 100Wp. Because the main market model was the fee-for-service, customers paid a ¢250,000 (US$34.86) installation fee and ¢90,000 (US$12.55) six months advanced tariff for 50Wp SH Ss before installation was carried out. On the other hand, customers wanting 100Wp SH Ss paid a ¢500,000 (US$69.72) installation fee and 150,000 (US$20.91) six months advanced tariff. Six months after installation, customers began paying monthly tariffs - ¢15,000 (US$2.09) for a 50Wp system and ¢25,000 (US$3.48) for a 100Wp system. RESPRO was implemented by a subsidiary unit of the MOE, which was formed through the secondment of some its personnel. Personnel included a national co-ordinator in Accra, two engineers and six field technicians who were responsible for the installation and maintenance of the solar PV systems.4.1 Associated Features and Problems of These Projects The field survey of these two projects, which was conducted during their post-implementation phase revealed several inherent features and problems, characteristic of dissemination challenges and unsustainability. They include the following:1) The non-adoption of the SH Ss by the majority of the rural inhabitants in the case study sites.2) The expression of preference for the national grid and not the SHSs.3) Malfunction of the majority of the installed SHSs.4) The withdrawal of qualified technicians after the implementation phase of these projects.5) The politicisation of the SHSs by local political aspirants(i.e. tagging SHSs as inferior to grid supply).6) Lack of service after project phase, while customers are still required to pay tariffs (i.e. inappropriate implementation of the fee-for-service financing model).7) The unwillingness of some customers to pay monthly tariffs.8) Lack of accountability and transparency by the solar11 STRATEGIES AND POLICIES 2881local solar committee.4.2 Drivers of the above Problems of the Two Projects While many factors underlie the low level of SH Ssdissemination in the developing world, a criticalexamination of the dissemination challenges andunsustainability trajectories of SH Ss in the two projects under discussion, showed their close interrelationships with the national institutional, policy and regulatory measures on solar PV, and the inadequate measures at the regional/local level. One can argue that while two decades of incorporating renewable energy into the mainstream energy planning in Ghana may define the policy environment, the appropriateness and implementation of these policies is another issue. These policy, institutional, regulatory and legislative arrangements for the promotion of solar PV dissemination and sustainability lack far-reaching provisions. Painuly and Fenhann (2002) for instance note that “… existing renewable policy framework in Ghana is not potent enough to ensure the commercialisation and widespread utilisation of RETs” (p.21). The study identified the following limitations in the national and regional/local institutional, policy and regulatory arrangements as the underpinning drivers of the problems of the two solar PV projects case studies.4.2.1 National LevelFirst and foremost the absence of well-defined national policies for solar PV is one of the major limitations that have led to the poor adoption levels of SH Ss and the unsustainability of these solar projects. Key components of this limitation include the lack of clear-cut policies on specific areas of PV deployment— a consequence of this situation being the government’s conflict of interest between the national grid extension and the execution of PV projects (Figure 1).Other components of the lack of well-defined national policies for solar PV include the absence of coherent provision for PV education and information dissemination; favourable incentive policy structures (tariffs, subsidy, government budgetary allocation, etc.) for the national grid rather than PV; the absence of national targets for PV; non-integration of innovative financing mechanisms (e.g. ESCOs).National grid extension polesin BindeFig. 1: Distribution of electricity extension poles in Binde(a beneficiary community of RESPRO) for thesupply of the national grid.Secondly, the institutional arrangement for solar PV in the energy ministry is poor. There is an absence of a consistent and dedicated institution solely for PV activities (or even renewable in general); lack of human capacity building (i.e. technical personnel) and retention for PV activities. These have contributed to a lack of skilled personnel, lack of maintenance, lack of know-how, and poor awareness for solar PV in these projects areas. In addition, there is inappropriate implementation of solar PV projects by the MOE as well as the poor administering of the fee-for-service financing model.Thirdly, the national regulatory frameworks for solar PV are weak. There has been inadequate definition of PV end-user protection measures such as national PV companies’ code of practice, national PV technical standards, as well as the absence of certification, testing enforcement institutions for PV, and unclear regulations for licensing private PV companies, etc.Other elements of the national institutional and policy arrangements interrelated with the dissemination and sustainability problems of these projects include the abandonment of PV projects (e.g. Wechiau project); the government’s reactive approach to solar PV supply — including the over-dependency on donor aid. In addition, there has been a lack of conformity between national and international PV policies with the energy needs of some of the rural people.Proceedings of ISES Solar World Congress 2007: Solar Energy and Human Settlement28824.2.2 Regional/Local LevelAt the regional/local level, the dynamics of institutionaland policy limitations that underpinned the non-adoptionand sustainability problems of the two projects include,poorly defined supervisory structures, absence ofindigenous plans/programmes to sustain installed publicSH Ss. Other issues included the absence of an intermediary body at the regional level, especially in the Wechiau’s project, to provide a link between the nationaland local level institutions, and the absence of efficientcoordination between the solar PV projects implementers(MOE) and the local oversight committees.5. CONCLUSIONBased on the two case studies, this paper has demonstratedthe overarching need for effective government institutional,policy and regulatory arrangements for the disseminationand sustainability of solar PV in rural areas in thedeveloping world. In many cases, the private sector willfollow the ‘market’ and address the professional middleclasses alone. However, the government’s activeinvolvement in PV activities is indispensable to fashion outthe appropriate institutional infrastructures, including favourable financial and regulatory environments, clear,open and realistic rural electrification policies for differentincome and social groups in the rural areas. South Africa,Germany and Japan present classic cases of national governments that are actively involved in solar PV activities.6. ACKNOWLEDGEMENTSI will like to thank Dr. Phillip Bradley and ProfessorGraham Haughton for proofreading this paper and helpingme to fine-tune it.7. REFERENCES(1) Agumba, M. 2002. Taking Two to Tangle: Africa’s Rural Electrification Dilemma! Solar Energy Network Magazine, V ol. 4, No. 2, page 2.(2) Amulya, K. N. R. Kirk, R. S. Robert, H . W. 2000. ‘Rural energy in developing countries’ in Goldeberg, J., ed. World Energy Assessment: energy and the challenge of sustainability. Washington: UNDP/UN-DESA/WEC. (3) Duke, R. D. Jacobson, A. Kammen, D.M. 2002. Photovoltaic module quality in the Kenyan solar home systems market. Energy Policy, V ol. 30, Issue 6, pp. 477-499. (4) Edjekumhene, I. 2003. Status of Renewable Energy andEnergy Efficiency Systems in West Africa. Paper Prepared for the West African Regional (REEEP) Consultation Meeting in Accra. KITE. (5) Hankins, M. 2000. A case study on private provision of photovoltaic systems in Kenya. In: Penelope, J. Smith, S., eds. Energy Services for the World’s Poor. Washington, DC: ESMAP.(6) IEA. 2002. World Energy Outlook 2002, second edition. Paris: IEA Publications Services. (7) Karekezi, S. Kithyoma, W., eds. 2005. Sustainable Energy in Africa: Cogeneration and Geothermal in the East and Horn of Africa - Status and Prospects. Nairobi: AFREPREN/FWD. (8) Martinot, E. Cabraal, A. Mathur, S. 2001. World Bank/GEF solar home systems projects: experiences and lessons learned 1993-2000. Renewable and Sustainable Energy Reviews, V ol. 5, Issue 1, pp. 39-57. (9) Painuly, J. P. Fenhann, J. V . 2002. Implementation ofRenewable Energy Technologies (RETs) Project - Opportunities and Barriers; Egypt, Ghana, and Zimbabwe studies. Denmark: UNDP Centre. (10)Philips, M. Browne, B. H . 1999. Accelerating PV Markets in Developing Countries. [Online]. Available: /repp_pubs/pdf/pv7.pdf .(11) Sawin, J. L. 2004. National Policy Instruments: PolicyLessons for the Advancement and Diffusion of Renewable Energy Technologies around the World. Thematic Background Paper for the International Conference for Renewable Energies, Bonn, Jan. 2004.。