Boosted Decision Graphs for NLP Learning Tasks
集成学习Boosting算法综述
集成学习Boosting算法综述一、本文概述本文旨在全面综述集成学习中的Boosting算法,探讨其发展历程、基本原理、主要特点以及在各个领域的应用现状。
Boosting算法作为集成学习中的一类重要方法,通过迭代地调整训练数据的权重或分布,将多个弱学习器集合成一个强学习器,从而提高预测精度和泛化能力。
本文将从Boosting算法的基本概念出发,详细介绍其发展历程中的代表性算法,如AdaBoost、GBDT、GBoost等,并探讨它们在分类、回归等任务中的性能表现。
本文还将对Boosting算法在各个领域的应用进行综述,以期为读者提供全面、深入的Boosting 算法理解和应用参考。
二、Boosting算法概述Boosting算法是一种集成学习技术,其核心思想是将多个弱学习器(weak learner)通过某种策略进行组合,从而形成一个强学习器(strong learner)。
Boosting算法的主要目标是提高学习算法的精度和鲁棒性。
在Boosting过程中,每个弱学习器都针对前一个学习器错误分类的样本进行重点关注,从而逐步改善分类效果。
Boosting算法的基本流程如下:对训练集进行初始化权重分配,使得每个样本的权重相等。
然后,使用带权重的训练集训练一个弱学习器,并根据其分类效果调整样本权重,使得错误分类的样本权重增加,正确分类的样本权重减少。
接下来,使用调整后的权重训练下一个弱学习器,并重复上述过程,直到达到预定的弱学习器数量或满足其他停止条件。
将所有弱学习器进行加权组合,形成一个强学习器,用于对新样本进行分类或预测。
Boosting算法有多种变体,其中最具代表性的是AdaBoost算法。
AdaBoost算法采用指数损失函数作为优化目标,通过迭代地训练弱学习器并更新样本权重,逐步提高分类精度。
还有GBDT(Gradient Boosting Decision Tree)、GBoost、LightGBM等基于决策树的Boosting算法,它们在处理大规模数据集和高维特征时表现出良好的性能。
人工智能领域机器学习理论和模型方面88个课题名称

人工智能领域机器学习理论和模型方面88个课题名称以下是人工智能领域机器学习理论和模型方面的88个课题名称:1. 支持向量机的理论与应用2. 决策树算法研究与优化3. 随机森林模型的改进与应用4. 基于神经网络的模型优化与训练算法5. 卷积神经网络的结构设计与参数优化6. 递归神经网络的理论研究与应用7. 长短时记忆网络的改进与应用8. Transformer模型的研究与应用9. 堆叠自编码器的理论与实践10. 受限波尔兹曼机的理论研究与应用11. 稀疏编码模型的改进与应用12. 深度置信网络的优化与应用13. 半监督学习理论与算法研究14. 强化学习的理论与应用研究15. 深度强化学习的模型与算法研究16. 迁移学习的理论与方法研究17. 对抗学习与生成模型的研究与应用18. 多任务学习的理论与算法优化19. 主动学习的模型改进与应用20. 弱监督学习的方法与应用研究21. 增量学习的理论与算法研究22. 大规模机器学习的优化与并行化23. 稳定性理论在机器学习中的应用研究24. 联邦学习的理论与算法研究25. 记忆增强型神经网络的研究与应用26. 多模态学习的理论与算法研究27. 深度学习与图像分析的交叉研究28. 深度学习在自然语言处理中的应用研究29. 深度学习在语音处理中的应用研究30. 深度学习在视频分析中的应用研究31. 深度学习在推荐系统中的应用研究32. 深度学习在医疗图像诊断中的应用研究33. 深度学习在生物信息学中的应用研究34. 深度学习在金融预测中的应用研究35. 深度学习在交通流预测中的应用研究36. 深度学习在智能驾驶中的应用研究37. 深度学习在智能物联网中的应用研究38. 深度学习在虚拟现实中的应用研究39. 深度学习在增强现实中的应用研究40. 深度学习在游戏设计中的应用研究41. 深度学习在人脸识别中的应用研究42. 深度学习在行为识别中的应用研究43. 深度学习在目标检测中的应用研究44. 深度学习在图像生成中的应用研究45. 深度学习在时序数据预测中的应用研究46. 深度学习在推荐系统中的应用研究47. 深度学习在异常检测中的应用研究48. 深度学习在网络安全中的应用研究49. 深度学习在自动驾驶中的应用研究50. 深度学习在自然语言生成中的应用研究51. 深度学习在机器翻译中的应用研究52. 深度学习在情感分析中的应用研究53. 深度学习在问答系统中的应用研究54. 深度学习在文本分类中的应用研究55. 深度学习在音乐生成中的应用研究56. 深度学习在文本生成中的应用研究58. 深度学习在药物发现中的应用研究59. 深度学习在股票预测中的应用研究60. 深度学习在风控与反欺诈中的应用研究61. 深度学习在客户关系管理中的应用研究62. 深度学习在供应链优化中的应用研究63. 深度学习在销售预测中的应用研究64. 深度学习在舆情分析中的应用研究65. 深度学习在信用评估中的应用研究66. 深度学习在环境监测中的应用研究67. 深度学习在智能辅助决策中的应用研究68. 深度学习在智能城市中的应用研究69. 深度学习在智能家居中的应用研究70. 深度学习在智慧医疗中的应用研究71. 深度学习在工业控制中的应用研究72. 深度学习在电力系统中的应用研究73. 深度学习在农业领域中的应用研究74. 深度学习在物流优化中的应用研究75. 深度学习在循环经济中的应用研究76. 深度学习在智慧旅游中的应用研究77. 深度学习在智能交通中的应用研究78. 深度学习在智能安防中的应用研究79. 深度学习在智慧零售中的应用研究80. 深度学习在智能金融中的应用研究81. 深度学习在智能教育中的应用研究82. 深度学习在智能体育中的应用研究83. 深度学习在智能制造中的应用研究84. 深度学习在智能文化遗产中的应用研究85. 深度学习在智能环保中的应用研究86. 深度学习在智能航空航天中的应用研究88. 深度学习在智能军事中的应用研究。
基于Boosting学习的图片自动语义标注

Abstract Automatic linguistic indexing of p ictures is an i mportant but highly challenging p roblem for researchers in content2based im age retrieval . In this paper, a boosting2based automatic linguistic indexing app roach is p roposed and a linguistic indexing system called BL IR (Boosting for L inguistic indexing I m age Retrieval system ) is built . It is assumed that im ages of same semantic meaning can be rep resented by a model combined w ith a group of features . 2D 2 MHMM model is found to be such a temp late for one special kind of color and texture combination, which corresponds to one cluster in feature space. Thus in BL I R system , a large number of 2D 2 MHMM models are generated and a boosting algorithm is used to associate keywords w ith models . The system has been imp lemented and tested on a photographic im age database of about 60 000 i m ages . Results demonstrate the effectiveness of the p roposed technique which outperform s other app roaches . Keywords content2based im age retrieval, linguistic indexing of p ictures, Bootsting algorithm , two 2dim ensional multi2 resolution hidden M arkov model(2D 2 MHMM )
把传统的贝叶斯因果网络和知识图谱,与深度强化学习融合
把传统的贝叶斯因果网络和知识图谱,与深度强化学习融合DeepMind联合谷歌大脑、MIT等机构27位作者发表重磅论文,提出“图网络”(Graph network),将端到端学习与归纳推理相结合,有望解决深度学习无法进行关系推理的问题。
作为行业的标杆,DeepMind的动向一直是AI业界关注的热点。
最近,这家世界最顶级的AI实验室似乎是把他们的重点放在了探索“关系”上面,6月份以来,接连发布了好几篇“带关系”的论文,比如:关系归纳偏置(Relational inductive bias for physical construction in humans and machines)关系深度强化学习(Relational Deep Reinforcement Learning)关系RNN(Relational Recurrent Neural Networks)论文比较多,但如果说有哪篇论文最值得看,那么一定选这篇——《关系归纳偏置、深度学习和图网络》。
这篇文章联合了DeepMind、谷歌大脑、MIT和爱丁堡大学的27名作者(其中22人来自DeepMind),用37页的篇幅,对关系归纳偏置和图网络(Graph network)进行了全面阐述。
DeepMind的研究科学家、大牛Oriol Vinyals颇为罕见的在Twitter上宣传了这项工作(他自己也是其中一位作者),并表示这份综述“pretty comprehensive”。
有很不少知名的AI学者也对这篇文章做了点评。
曾经在谷歌大脑实习,从事深度强化学习研究的Denny Britz说,他很高兴看到有人将图(Graph)的一阶逻辑和概率推理结合到一起,这个领域或许会迎来复兴。
芯片公司Graphcore的创始人Chris Gray评论说,如果这个方向继续下去并真的取得成果,那么将为AI开创一个比现如今的深度学习更加富有前景的基础。
特征交叉 多头自注意力机制

特征交叉多头自注意力机制
特征交叉是指在机器学习和深度学习中,将不同特征之间进行组合和交叉,以便更好地捕捉特征之间的关联性和非线性关系。
特征交叉可以帮助模型更好地理解不同特征之间的相互作用,从而提高模型的性能和泛化能力。
在深度学习中,特征交叉常常应用于神经网络的输入层,通过将不同特征进行组合,从而获得更加丰富和抽象的特征表示。
多头自注意力机制是一种用于处理序列数据的注意力机制,它可以同时关注输入序列的不同部分,并且能够学习到不同部分之间的依赖关系。
多头自注意力机制通过将输入序列进行线性变换,然后分成多个头,每个头进行注意力计算,最后将多个头的输出进行合并,从而获得更加丰富和全局的表示。
多头自注意力机制在自然语言处理领域得到了广泛的应用,例如在机器翻译和文本生成任务中取得了很好的效果。
特征交叉和多头自注意力机制在深度学习领域都是非常重要和有效的技术。
特征交叉可以帮助模型更好地理解特征之间的关系,从而提高模型的表达能力;而多头自注意力机制则可以帮助模型更好地处理序列数据,从而提高模型在自然语言处理等领域的性能。
这两种技术的结合可以在很多任务中取得更好的效果,例如在推荐系统和自然语言处理任务中都得到了广泛的应用。
总的来说,特征交叉和多头自注意力机制都是深度学习领域中非常重要的技术,它们为模型提供了更加丰富和全面的特征表示,从而提高了模型的性能和泛化能力。
nlp sari 指标

nlp sari 指标NLP SARI指标自然语言处理(Natural Language Processing,简称NLP)是人工智能领域的一个重要分支,旨在使计算机能够理解和处理人类语言。
SARI指标(Sentence-level Automatic Relevance Indicator)是一种用于评估自动摘要系统性能的指标。
本文将详细介绍NLP中的SARI指标。
一、SARI指标简介SARI指标是根据摘要系统生成的摘要与参考摘要之间的相似度来度量系统性能的。
SARI指标的计算方法综合了召回率、精确率和F1值,使得SARI指标能够准确地评估自动摘要系统在编辑和重排序方面的表现。
二、SARI指标的计算方法SARI指标的计算过程主要包括三个步骤:编辑操作、句子级别的相似度计算和SARI值的计算。
编辑操作是指通过增加、删除和替换等操作使得系统生成的摘要与参考摘要更加接近。
在编辑操作的计算中,可以采用传统的编辑距离算法或者更加复杂的语义编辑模型,以获取更准确的编辑操作。
句子级别的相似度计算是指通过计算系统生成的句子与参考句子之间的相似度来评估摘要系统的质量。
常用的相似度计算方法包括基于词向量的余弦相似度和基于句子向量的余弦相似度等。
SARI值的计算是通过将句子级别的相似度计算结果综合起来得到的。
SARI值可以被视为对编辑操作和句子级别相似度计算结果的加权平均,从而准确地评估自动摘要系统的性能。
三、SARI指标的应用SARI指标在自动摘要领域被广泛应用。
通过使用SARI指标,可以评估自动摘要系统的性能,并对系统进行优化和改进。
SARI指标还可以用于比较不同的自动摘要算法之间的差异,从而指导自动摘要算法的选择和研发。
SARI指标的应用不仅局限于自动摘要领域,也可以用于其他与自然语言处理相关的任务,如机器翻译、文本生成等。
通过引入SARI指标,可以提高这些任务的自动评估效果,为算法的研发和性能优化提供参考。
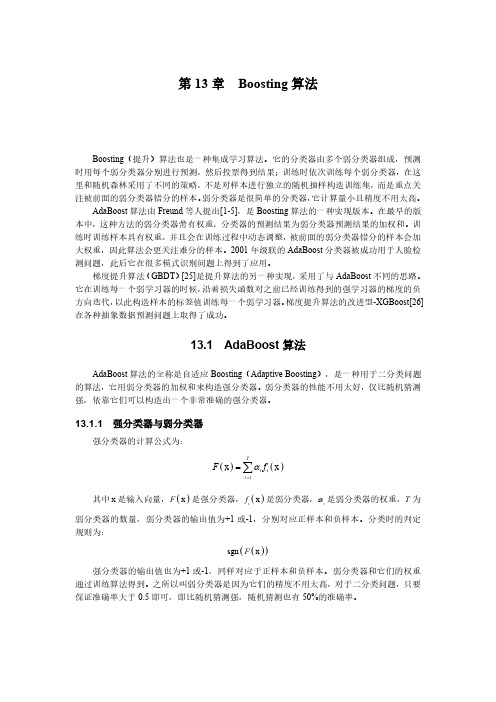
第13章-boosting算法--机器学习与应用第二版
1 et exp t et exp t
2
et 1 et
1
4
2 t
在这里利用了错误率 et 以及弱分类器权重 t 的定义。由于在上一轮迭代时权重是归一
化的,因此有
l
l
l
wt1 i
wt 1 i
wt 1 i
1
i1, yi ft xi
i1, yi ft xi
i 1
根据错误率的定义
et
在这里使用了指数损失函数。如果标签值与强分类器的预测值越接近,损失函数的值越 小,反之越大。使用指数损失函数而不用均方误差损失函数的原因是均方误差损失函数对分 类问题的效果并不好。将广义加法模型的预测函数代入上面的损失函数中,得到算法训练时 要优化的目标函数为
l
j , f j arg min ,f exp yi Fj 1 xi f xi i 1
T
T
T
Zt 2 et 1 et
t 1
t 1
t 1
1 4t2
exp
2
T t 1
t2
其中
t
1 2
et
根据错误率和弱分类器权重的计算公式有
l
Zt wit1 exp yit ft xi
i 1
l
l
wit1 exp t
wt 1 i
exp
t
i1, yi ft xi
i1, yi ft xi
表 13.1 随机森林与 AdaBoost 算法的比较
随机森林
AdaBoost
决策树规模
大
小
是否对样本进行随机采样
是
否
是否对特征进行随机采样
是
否
Boosting算法

Boosting算法Boosting算法也是一种基于数据集重抽样的算法,与Bagging 算法主要区别在于,需要动态调整训练样本中各数据权重,每一次迭代增加不能被正确学习的样本权重,相对地降低了能被正确学习的样本权重,从而提升在整个训练样本数据集上的学习正确率。
一、Boosting算法流程与Bagging算法不同,Boosting算法第一次构建基学习器时给每一个训练数据样本赋予动态权重,增加分类错误样本权重。
在下一次,基学习器采用新的样本权重进行随机抽样构建新的基学习器并以此类推构建多个基学习器,直到递进生成的基学习器精度不再明显提升或满足精度需求,最后这多个基学习器形成一个精度较高的强学习器。
为了控制集成学习模型复杂度,通过动态权重降低了高精度分类样本的权重,有效控制了最终学习器的样本数量,从而控制了集成学习模型复杂度。
为了提升集成模型的差异化,Boosting算法是一种逐步递进的方法,每一个学习器都是前一个学习器通过调整样本权重的改进模型,不存在两个相同的基学习器。
Boosting算法问题在于,更多关注不能正确分类样本数据,对于边界样本会导致权重失衡,产生“退化问题”。
Boosting算法的原理示意图如图7-5所示。
图7-5 Boosting算法的原理示意图Boosting算法最典型的是Adaptive Boosting算法,简称AdaBoost算法,其基本流程描述如下。
从“偏差-方差分解”的角度看,Boosting算法主要提升基学习器的准确率,降低偏差,因此,Boosting算法能基于泛化性能相当弱的学习器构建出很强的集成。
二、Boosting系列算法Boosting算法包括以梯度提升为核心方法的系列算法,主要包括前面介绍的调整错分样本权重的AdaBoost算法、以决策树为基函数的Boosting Tree算法、利用损失函数的负梯度在当前模型的值作为回归问题提升树算法中残差的近似值的GBDT算法、大规模并行Boosting Tree的XGBoost算法。
- 1、下载文档前请自行甄别文档内容的完整性,平台不提供额外的编辑、内容补充、找答案等附加服务。
- 2、"仅部分预览"的文档,不可在线预览部分如存在完整性等问题,可反馈申请退款(可完整预览的文档不适用该条件!)。
- 3、如文档侵犯您的权益,请联系客服反馈,我们会尽快为您处理(人工客服工作时间:9:00-18:30)。
Boosted Decision Graphs for NLP Learning TasksJon D. Patrick, Ishaan GoyalBasser Department of Computer Science, University of Sydney, NSW, 2006, Australia{jonpat, ishaan}@.au, Fax +61-2-9351 3838AbstractThis paper reports the implementation of DRAPH-GP an extension of the decision graph algorithm DGRAPH-OW using the AdaBoost algorithm.This algorithm,which we call1-Stage Boosting,is shown to improve the accuracy of decision graphs,along with another technique which we combine with AdaBoost and call2-Stage Boosting which shows greater improvement.Empirical tests demonstrate that both1-Stage and2-Stage Boosting techniques perform better than the boosted C4.5algorithm(C5.0).The boosting has shown itself competitive for NLP tasks with a high disjunction of attribute space against memory based methods,and potentially better if part of an Hierarchical Multi-Method Classifier.An explanation for the effectiveness of boosting due to a poor choice of prior probabilities is presented.Keywords: Decision Graph, Natural Language Processing, Boosting1. INTRODUCTIONIn a wide variety of classification problems,boosting techniques have proven to be an effective method to significantly reduce the error of weak learning algorithms.While the AdaBoost algo-rithm(Freund&Schapire,1995)has been used to improve the accuracy of a decision tree algorithm (Quinlan&Rivest,1989),which uses the Minimum Description Length Principle(MDL),little is known about it’s effectiveness on the decision graphs.This paper examines the application of the AdaBoost technique to the decision graph algorithm, DGRAPH-OW(Oliver&Wallace,1991,Wallace&Patrick,1993),which infers classification graphs from data by combining the Minimum Message Length Principle(MML)(Wallace&Boul-ton,1968)with the recursive partitioning algorithm.In this paper we present two variants of the boosted decision graphs, DGRAPH-GP, which we denote 1-Stage Boosting and 2-stage Boosting.1.1. Decision GraphsThere have been a number of attempts to extend the representational power of the decision trees by allowing a node to have more than one parent.Oliver and Wallace(1991),introduced decision graphs which are generalizations of decision trees.They optimize their decision graphs based on the MML Principle.The feature that distinguishes decision graphs from decision trees is that the former may also contain joins.A join is represented by two nodes having a common child,and this speci-fies that two subsets have some common properties,and hence can be considered as one subset.The manner in which the objects are allocated to leaf nodes in decision graphs is the same as decision trees.The decision graph offers an elegant solution to the replication and fragmentation problems faced by decision trees,and hence may prove more useful for NLP tasks give the distribution of classes across a very wide range of attribute values.To discover classification graphs of short message length,the DGRAPH program of Oliver and Wallace(1991),hereafter DGRAPH-OW to distinguish it from the boosted DGRAPH algorithm we have developed,hereafter called DGRAPH-GP,starts with a single leaf at the root and grows a graph by repeatedly applying the modification that results in the greatest savings in the message length describing the tree.Modifications considered either replace a leaf with a decision node or join two leaves together.The join probability,p j is taken as an argument to the algorithm.The pro-cedure halts when the best modification fails to reduce the message length of the resulting graph.To assist in preventing the greedy algorithm from becoming trapped in local message length minima,a lookahead parameter,l,is used to calculate message length savings over the next lower l levels of the tree under each possible modification.2. BOOSTING DECISION GRAPHS - DGRAPH ParametersThe coding scheme for decision graphs has two important parameters, one is p j the probability of join, and the second is alpha, the leaf node class purity.2.1. Probability of a JoinThe probability of a join,p j effects p i the probability of leaf nodes,and,p d the probability of deci-sion nodes in the decision graph.A change in the value of the probability of joins determines the way in which the decision graph is constructed.A low value for the probability of joins will encour-age graphs with few join nodes, while a high value will encourage graphs with many join nodes. As it is difficult to propose anyfixed value for a probability of joins that will be suitable for a wide range of applications,we propose to use the data itself to estimate the value of p j.Given a data set, we grow decision graphs for a range of values of p j,say from0.0,…,0.5.We select the graph with the smallest message length as being the best graph, and hence derive the estimate of p j.2.2. Prior Probability of Leaf Node Class PurityThe second parameter that effects the coding of decision graphs is the leaf node purity prior,alpha. The value of alpha determines how pure the leaf nodes will be.A heterogeneous class distribution in a leaf node has a uniform distribution where the value of the prior is one,however values of prior less than one places greater weight on more pure(homogeneous)distributions.As stated in Wallace &Patrick(1993),the data itself is used to estimate the leaf node purity prior.Having grown the full tree with say,alpha=1,wefind the best pruned form and message length for various values of alpha, and hence the best value of alpha is the one that generates the shortest message length.We use both these parameters,that is,the optimal probability of a join,and the estimate of the leaf node purity prior together with the AdaBoost algorithm to improve the performance of the DGRAPH-GP algorithm in 2-Stage Boosting.2.3. 1-Stage BoostingIn1-Stage Boosting,we use AdaBoost to improve the prediction accuracy of our Decision Graphs. For all our experiments using1-Stage Boosting,we use afixed value of p j=0.2.Due to change in the distribution of weights on the training data,at the start of each new boosting step we re-adjust the value of alpha to1(assuming uniform distribution)and the best value of alpha is calculated according to the changed distribution, in the same manner as described in section 2.2.2.4. 2-Stage BoostingOur2-Stage Boosting algorithm,in each trial,finds the best probability of join,p j and the best alpha according to the distribution of weights on the training data in that particular trial.In this way it finds the optimal number of join nodes required for data distribution in each particular boosting step and hence constructs the best graph in each trial,using the data itself to estimate the value of p i and alpha.2.5 Test ResultsWe have implemented our proposals and compared the results between thefive algorithms-DGRAPH-OW,1-Stage Boosting,2-Stage Boosting,C4.5and boosted C4.5.All thesefive algo-rithms were evaluated on a representative collection of datasets from the UCI Machine Learning Repository.The comparative results are given for the seven UCI data sets in Table1.Ten-fold cross-validations were carried out with each data set.The boosting parameter T governing the number of classifiers generated was set at10for all these experiments(as is conventional).All C4.5parameters had their default values and we used pruned trees.For DGRAPH-OW,1-Stage and2-Stage Boosting algo-rithms,we set the lookahead to2for all experiments and the probability of a join node is set to0.2 for DGRAPH and1-Stage Boosting algorithms.As our2-Stage Boosting algorithm uses the data itself to estimate the probability of a join node,we do not need to specify the value of the probabil-ity of a join node.Thefirst column of Table1below shows the name of the data set used,and the remaining columns show the average percentage accuracies of each data set against each of thefive algorithms.All the datasets show considerable diversity in size,number of classes,and number and type of attributes.2-stage Boosted DGRAPH-GP proved to be better than boosted C4.5in6out of7 tests by2to15%and equal on the seventh.1-stage Boosted DGRAPH-GP was better in5out of7 of the tests.The results from“Sick”data set seem to be anomalous,where boosting had no effect on the accu-racy of C4.5,and DGRAPH-GP marginally decreases in accuracy when compared to DGRAPH-OW.A look at the trees produced for the “Sick”data set suggest that the data contains a large number of insignificant attributes having no effect on classification and the trees are constructed using just three of the available twenty five attributes for both C4.5and DGRAPH-OW.Also the distribution of the “Sick”data set is very uneven with almost 88%of training data containing items with one particular class.These two factors seem to effect boosting,which produces results with no or marginal change.This also suggests that implicit priors of C4.5favour skewed class distributions or class distributions from either skewed or small attribute sets,whereas priors in DGRAPH favour uniform class distribution in data,which emphasises the importance of explicitly identifying priors.It may also be that DGRAPH-OW and DGRAPH-GP are disadvantaged using MML criteria that has to pay a much higher overhead cost than C4.5for a large number of attributes that make no con-tribution to the final graph.Overall,our trials over a diverse collection of datasets have confirmed that boosting improves the accuracy of the DGRAPH-OW noticeably and the results also show that 2-Stage boosted DGRAPH-GP is more accurate than the boosted C4.5.3. ANALYSIS OF NLP TASKSDGRAPH-GP has been evaluated against a number of other classifiers on a common NLP task at the Computational Natural Language Learning Workshop (CoNLL,2001)held at the 39th Annual Meeting of the Association for Computational Linguisitcs,in 2001.At that time Patrick and Goyal (2001)reported results on Clause Identification data using a window size of only zero and the results were not encouraging proving to be one of the poorest results amongst the six competing entries.Since that time we have conducted an extensive set of experiments on the shared task data which have significantly improved the results.However relative to the other methods our results will still be inferior because decision graph classifiers are unable to do any processing at the indi-vidual word level.Hence our results (Tables 2-6)can be considered as a minimum performance standard.A study of these results show significantly better results than the baseline tests with an improvement in F-value of 14to 36for the development test set,and 16to 24for the Final test set.The experiments were conducted incrementally,firstly the results were calculated using attributes of POS (p),clause boundaries (c)and the combined labels (pc)for word windows of 0,1,2and 3.These results were scrutinized for zones where the best results occurred.This was invariably for the pc attribute set in windows of size 2and 3.Further analyses showed these regions to perform better with 2stage boosting yielding the best regions to direct further experiments where the Look-Ahead distance and the join probablity of the decision graph were varied.Invariably the optimal join prob-ability was around 0.2.Data SetDGRAPH-OW1 Stage boosted DGRAPH-GP2 Stage boosted DGRAPH-GP C4.5Boosted C4.5Tic-Tac_toe 91.3095.0097.1086.0386.40Credit 86.4585.8187.1085.3085.33Car 93.7195.4397.7293.1092.60V ote 95.5697.7897.8096.8097.80Nursey 96.4697.2399.9296.2096.90Sonar 70.0080.0085.0080.0070.00Sick97.8197.1997.1998.1098.10Table 1: Comparison of accuracy of all five algorithm on the UCI datasets.Of the six systems that participated in the shared task for CoNLL-2001,two used boosting (Patrickand Goyal,2001;Carreras and Marquez,2001),Hammerton (2001)used a feed-forward neural net-work for predicting embedded clause structures,Tjong Kim Sang (2001)evaluated a memory-based learner while using different combinations of features describing items which needed to be classi-fied,Molina and Pla (2001)applied a specialized Hidden Markov Model (HMM)to the shared task and Dejean (2001)used a symbolic learner ALLiS (Architecture for Learning Linguistic Structure)for predicting clause boundaries, and Hammerton only participated in Task 3..Table 4:The performance of five systems while processing the development data and test data Task 1 of the shared task: identifying clause starts.The three tasks consisted of determing the clause starts,clause ends and the combination of the two in the one sentence,or whole clauses.While Carreras and Marquez (2001),Tjong Kim Sang (2001)and Dejean (2001)concentrated on optimising data attribute features i.e.linguistic features,Patrick and Goyal (2001),Molina and Pla (2001)and Hammerton (2001)concentrated on Machine Learn-ing methods. So, Patrick and Goyal (2001) give the best of the Machine Learning solutions.Task Precision Recall F Baseline Part194.8487.3390.9354.58Part280.1283.0381.5567.42Part378.1967.6372.5352.17Table 2:Results with Development Test Data Task Precision Recall F Baseline Part189.7984.8887.2753.34Part280.1183.4781.7665.34Part373.7560.0066.1747.71Table 3:Results with Final Test DataDevelopment -Task 1Precision Recall F-value Carreras & Mar.Patrick & Goyal Tjong Kim Sang Molina & Pla Dejean 95.77%94.84%92.94%90.11%94.08%92.08%87.33%86.87%88.80%84.59%93.8990.9389.8089.4589.08Baseline 96.32%38.08%54.58%Final Test - Task 1Precision Recall F-value Carreras & Mar.Tjong Kim Sang Molina & Pla.DejeanPatrick & Goyal 93.96%92.91%89.54%93.76%89.79%89.59%85.08%86.01%81.90%84.88%91.7288.8287.7487.4387.27Baseline98.44%36.58%53.34Table 5: The performance of five systems while processing the development data and the test data for Task 2 of the shared task: identifying clause ends.Table 6: The performance of the six systems while processing the development data and the test data for Task 3 of the shared task: recognizing complete clausesThe results from all six systems given in tables 4,5and 6(Tjong Kim Sang &Dejean,2001)show that Carreras and Marquez (2001)clearly outperform the other five systems on all parts of the shared task.They converted the clause task into a set of binary decisions which they modeled with decision trees which are combined by AdaBoost.The system uses features which in some cases Development - Task 2Precision Recall F-value Carreras & Mar.Tjong Kim Sang Patrick & Goyal Molina & Pla.Dejean 91.27%83.80%80.12%78.65%99.28%89.00%80.44%83.03&78.97%51.73%90.1282.0981.5578.8168.02Baseline 96.32%51.86%67.42Test - Task 2Precision Recall F-value Carreras & Mar.Tjong Kim Sang Patrick & Goyal Molina & Pla.Dejean 90.04%84.72%80.11%79.57%99.28%88.4179.96%83.47%77.68%48.90%89.2282.2881.7678.6165.47Baseline98.44%48.90%65.34Development -Task 3Precision Recall F-value Carreras & Mar.Patrick & Goyal Molina & Pla.Tjong Kim Sang Dejean Hammerton 87.18%78.19%70.98%76.54%73.93%59.85%82.48%67.63%72.31%67.20%62.44%55.56%84.7772.5371.6471.5767.7057.62Baseline 96.32%35.77%52.17Test - Task 3Precision Recall F-value Carreras & Mar.Molina & Pla.Tjong Kim Sang Patrick & Goyal Dejean Hammerton 84.82%70.89%76.91%73.75%72.56%55.81%73.28%65.57%60.61%60.00%54.55%45.99%78.6368.1267.7966.1762.7750.42Baseline98.44%31.48%47.71contain relevant information about a complete sentence.It produces a list of clauses from which the ones with the highest confidence scores will be presented as output.They were the only ones to use input features that contained information of a complete sentence and the results tell that it was a good choice.Carreras and Marquez(2001)were the most successful because they used an extensive variety of pre and post processing methods based on general linguistic knowledge,while their classifier was quite simple.This is contrasted with our method which used a relatively simple set of linguistic attributes but a sophisticated classifier.The comparison of the results points to the fact that captur-ing the linguistic features and constraints makes a greater contribution to accuracy than the differ-ences between the classifiers.This result has motivated the two groups(Patrick and Goyal,2001; Carreras and Marquez,2001)to agree to collaborate on a reanalysis of the data combining both their methods.The Patrick and Goyal(2001)results are most consistent with that of Tjong Kim Sang(2001)who used a memory based learner.This has advantage over the DGRAPH-GP method because it can use word level differentiation.We did a post processing of the graph from DGRAPH-OW,where the training items within each leaf node were grouped by orthography and the leaf nodes were further divided based on this orthography.The testfiles were then parsed on the resultant decision graph and items re-classified based on orthography,thereby giving it word level processing,de facto.In these experiments the F-values improved on average by about0.2%.A better result may be obtaina-ble if the word level analysis is integrated as a decision list procedure into the primary stages of decision graph selection and not treated as a post-processing stage.Such a combined Decision Graph and Decision List we would call an Hierarchical Multi Model Classifier(HMMC).We spec-ulate from observations made from the erroneous classifications,that DGRAPH-GP when used in an HMMC will decrease its error rate by25-40%and hence show significant superiority to these results.Our results go some way to challenge the extensive set of results produced by Daelemans,Van Den Bosch and Zavrel(1999)that indicate memory based methods produce better results on NLP tasks than decision tree methods due to a high level of disjunctions in the attribute space.Decision Graphs are intended to overcome the disjunction problem and there is an indication in these results that it is being achieved.When DGRAPH-GP is adapted to be a HMMC and to allow word level processing we will be able to make a true comparison between the methods although there is every indication that decision graphs will at least equal the performance of memory based learners. CONCLUSIONSOur experimental work on the nature of boosting indicates that it may be having a successful effect on classification because it compensates for poor selection of the prior probabilities of the data set, no matter whether that prior is implicit or explicit to the method.This suggestion is consistent with the known characteristic of language data that notionally follows Zipf’s Law or at least a power series which at the moment are not usable in DGRAPH-GP,DGRAPH-OW or C4.5in their current form,and hence they have performed better with the addition of boosting.Unfortunately,usually no detailed determination of distribution characteristics is established in published experimental results for NLP tasks.We suggest that DGRAPH-GP and C4.5will both perform better on NLP tasks when they allow variation of the distribution models of the classes and we have better probability distribu-tion knowledge for this NLP data.REFERENCESCarreras,X.and Marquez,L.(2001).Boosting Trees for Clause Splitting.In Proceedings of CoNLL-2001, pp 73-75. Toulouse, France.Dejean,H.(2001).Using ALLiS for Clausing.Proceedings of CoNLL-2001,pp64-66.Toulouse, France.Daelemans,W.,Van Den Bosch,A.and Zavrel,J.(1999).Forgetting Exceptions is Harmful in Lan-guage Learning. Machine Learning, 34, pp. 11-43, 1999.Freund,Y&Schapire(1995).A decision theoretic generalization of on-line learning and an appli-cation to boosting. Proceedings of the Second European Conference on Computational Learning.Hammerton,J.(2001).Clause Identification with Long Short-Term Memory.Proceedings of CoNLL-2001, pp 61-63. Toulouse, France.Molina,A.and Pla,F.(2001).Clause Detecting using HMM.Proceedings of CoNLL-2001,pp70-72. Toulouse, France.Oliver,J.J.&Wallace,C.S.(1991).Inferring decision graphs.Proceedings of Workshop8–Evalu-ating and Changing Representation in Machine Learning IJCAI-91.Oliver,J.J.(1993).Decision graphs–an extension of decision trees.Proceedings of the Fourth International Workshop on Artificial Intelligence and Statistics, pages 343-350.Patrick,J.D.and Goyal,I.(2001).Boosted Decision Graphs for NLP Learning Tasks.Proceedings of CoNLL-2001. pp 58-60. Toulouse, France.Quinlan,J.R.&Rivest,R.L.(1989).Inferring decision trees using minimum description length principle. Information & Computation, 80, 227-248.Quinlan, J.R. (1993). C4.5: Programs for Machine Learning. San Mateo: Morgan Kaufmann. Tjong Kim Sang,E.F.(2001).Memory-Based Clause Identification.Proceedings of CoNLL-2001, pp67-69. Toulouse, France.Tjong Kim Sang,E.F.&Dejan,H.(2001).Introduction to the CoNLL-2001Shared Task:Clause Identification. Proceedings of CoNLL-2001. pp 53-57. Toulouse, France.Wallace,C.S.&Boulton,D.M.(1968).An information measure for classifiputer Jour-nal, 11, 185-195.Wallace, C.S. & Patrick, J.D. (1993). Coding Decision Trees. Machine Learning 11, pp 7-22.。