Development of an ecological security evaluation method
关于海洋资源开发与环境保护的平衡 英语作文
Balancing Marine Resource Exploitation with Environmental ProtectionThe ocean,a vast and dynamic ecosystem,is a source of immense natural resources,including food,energy,minerals,and biological compounds that have the potential to support economic development and human well-being.However,the exploitation of these marine resources has often been conducted without sufficient regard for the environmental consequences,leading to habitat destruction,pollution, overfishing,and the loss of biodiversity.Achieving a balance between marine resource exploitation and environmental protection is crucial to ensure the sustainability of the oceans and the myriad benefits they provide.This essay discusses the importance of this balance and outlines strategies to achieve it.The need for a balanced approach stems from the interconnectedness of marine ecosystems and the services they provide.Marine resources, such as fish stocks,are not inexhaustible;overfishing can lead to their collapse,affecting food security and the livelihoods of millions of people who depend on fishing.Similarly,the extraction of oil,gas,and minerals from the ocean floor can cause significant environmental damage, including habitat destruction and pollution,which can have long-term impacts on marine life and the health of the oceans.Renewable energy projects,such as offshore wind farms,while contributing to the reduction of greenhouse gas emissions,also need careful planning to minimize their ecological footprint.To achieve a balance between exploitation and protection,several strategies can be adopted:Sustainable Resource Management:Implementing science-based management practices for fisheries and other extractive industries is essential.This includes setting quotas based on scientific assessments of stock health,using selective fishing gear to reduce bycatch,and adopting sustainable aquaculture practices.For non-renewable resources,it means ensuring that extraction methods minimize environmental impacts and that a portion of the revenues is invested in conservation efforts.Marine Protected Areas(MPAs):Designating and effectively managing MPAs can protect critical habitats and biodiversity hotspots from exploitation.MPAs can also serve as reference sites to understand natural variability and the impacts of human activities on marine ecosystems.Ecosystem-Based Management(EBM):EBM is an integrated approach that considers the entire ecosystem,including humans,in the management of marine resources.It aims to maintain ecosystem health and resilience while allowing for sustainable use of its resources.Environmental Impact Assessments(EIAs):Requiring comprehensive EIAs before approving new development projects can help identify potential environmental impacts and mitigation measures.This process should involve stakeholder consultation,including local communities and indigenous peoples,to ensure that their rights and livelihoods are considered.Innovation and Technology:Investing in research and development can lead to innovations that reduce the environmental impacts of resource exploitation.For example,cleaner extraction technologies,more efficient fishing methods,and renewable energy solutions can help reduce the ecological footprint of human activities in the marine environment.International Cooperation:Many marine resources and environmental challenges transcend national boundaries,making international cooperation essential.Agreements and conventions,such as the United Nations Convention on the Law of the Sea(UNCLOS),provide a framework for the sustainable management of the oceans and their resources.In conclusion,the sustainable exploitation of marine resources requires a careful balance between economic development and environmental protection.By adopting sustainable management practices,protectingcritical habitats,and investing in innovation,it is possible to harness the oceans'wealth while preserving their health and biodiversity for future generations.Achieving this balance is not only an environmental imperative but also a moral and economic one,essential for the well-being of current and future human societies.。
中国能源生态安全影响评估与政策建议

∗责任作者ꎬ罗宏(1964 ̄) ꎬ男ꎬ湖南桃源人ꎬ研究员ꎬ博士ꎬ主要从事环境经济与管理研究ꎬluohong@ craes.org.cn
基金项目: 国家能源局发展规划司研究项目ꎻ 中央级公益性科研院所基本科研业务专项( No.2016YSKY018ꎬ 2016YSKY036) ( No.2016YSKY018ꎬ 2016YSKY036)
Abstract: There are significant contradictions between the unsatisfactory energy production and consumption structure and the national
development strategy of ecological civilization. The issue of ecological security has become one of the important factors restricting the development and utilization is provided for decision ̄making on energy structure optimization. The national energy and ecological security perspective of achieving coordinated development of energy security and ecological security. The national energy and ecological security
[5 ̄6]
. 生态安
1������ 1㊀ PSR 模型理论
具有重大影响 [4] ꎬ已经引起了国际社会的高度关注ꎬ
生态文明术语权威英译

生态文明术语权威英译人与自然和谐发展humankind develops in harmony with nature; harmonious development between man and nature生命共同体a community of life生态文明ecological progress; ecological conservation; eco-civilization生态文化eco-culture国家生态安全national ecological security全球生态安全global ecological security生态文明制度体系institutional framework for promoting ecological progress【例】到2020年,构建起由自然资源资产产权制度、国土空间开发保护制度等八项制度构成的生态文明制度体系。
By 2020, an institutional framework composed of eight systems will have been established for promoting ecological progress, including a property rights system for natural resource assets and a system for developing and protecting territorial space.生态文明体制改革reform for promoting ecological progress【例】紧紧围绕建设美丽中国,深化生态文明体制改革,加快建立生态文明制度,推动形成人与自然和谐发展现代化建设新格局。
To build a beautiful China, we will deepen reform to promote ecological progress and move faster to establish related systems so as to create a new model of modernization that ensures humanity develops in harmony with nature.绿色发展、循环发展、低碳发展green, circular, and low-carbon development节约优先、保护优先、自然恢复为主give high priority to conserving resources, protecting the environment, and letting nature restore itself生态保护红线ecological conservation redline国家公园体制national park system资源有偿使用和生态补偿制度system for payment-based resource use and compensation for ecological conservation 跨区域、跨流域生态补偿机制mechanism for trans-regional and cross-watershed compensation for ecological conservation生态文明绩效评价考核和责任追究ecological conservation performance assessment and accountability生态环境损害责任终身追究制system of lifelong accountability for ecological and environmental damage污染物排放许可制permit system for pollutants emissions绿水青山就是金山银山Lucid waters and lush mountains are invaluable assets.外朗教育免费直播课:/html/tuofukecheng/zhiboke/。
生态环境保护方面的英语
生态环境保护方面的英语English:Ecological environment protection is of vital importance for the sustainable development of human society. It involves the conservation and rational use of natural resources, the prevention and control of pollution, the protection of biodiversity, and the promotion of environmental education and awareness. To achieve these goals, it requires the joint efforts of government, industry, and individuals. The government needs to establish and enforce strict environmental laws and regulations, invest in environmental infrastructure, and promote sustainable development policies. Industries must implement cleaner production technologies, reduce emissions, and adopt eco-friendly practices. Individuals should also take responsibility for their own actions, such as reducing waste, conserving energy, and participating in environmental activities. Only through comprehensive and coordinated efforts from all sectors of society can we ensure the long-term health and vitality of our planet.中文翻译:生态环境保护对于人类社会的可持续发展至关重要。
绿色发展理念下无居民海岛的开发策略——以珠海三角岛为例
Landscape Architecture Practice海岛是一种特殊类型的海洋地理单元,在自然资源、领海基点、国防、生态安全以及海洋经济发展等方面都有重要价值[1]。
据统计,在我国300万平方公里的海域中,面积为500 m 2以上的海岛有6 961个,其中约94%为无人居住岛屿[2~3]。
由于海岛生态系统脆弱,加之以前我国无居民岛屿的资源开发利用缺乏统一规划和管理,无序粗放,围海造地、挖沙采石、海水养殖等行为时有发生,海岛资源以及周围海域的生态环境遭受严重破坏,甚至有岛屿消失。
随着2003年《无居民海岛保护与利用管理规定》颁布和2010年《中华人民共和国海岛保护法》正式实施,2011年我国首批可开发利用无居民海岛名录公布,我国无居民海岛开发利用逐渐走向法制化和正规化。
在海洋强国建设和海洋生态文明建设持续推进的时代背景下,海岛已经成为高质量发展的战略要地。
珠海市是“百岛之市”,以万山群岛为代表的海岛经济崛起是珠海市建设“海洋经济强市”“全国海洋生态文明示范市”的重要支撑,是打造世界级群岛休闲度假区的必由之路[4~5]。
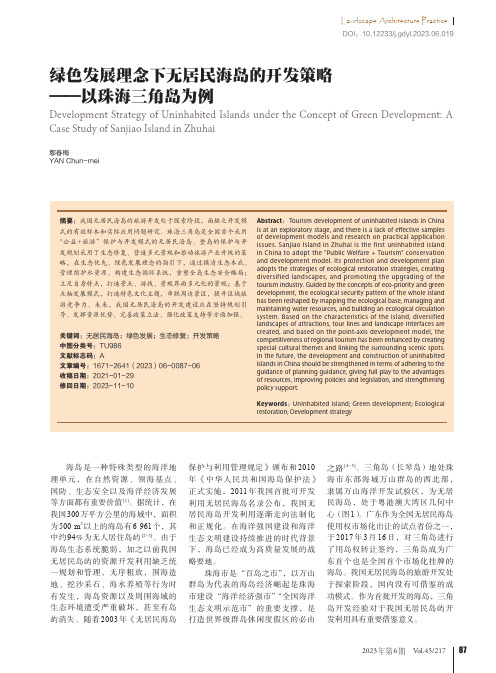
三角岛(长琴岛)地处珠海市东部海域万山群岛的西北部,隶属万山海洋开发试验区,为无居民海岛,处于粤港澳大湾区几何中心(图1)。
广东作为全国无居民海岛使用权市场化出让的试点省份之一,于2017年3月16日,对三角岛进行了用岛权转让签约,三角岛成为广东首个也是全国首个市场化挂牌的海岛。
我国无居民海岛的旅游开发处于探索阶段,国内没有可借鉴的成功模式。
作为首批开发的海岛,三角岛开发经验对于我国无居民岛屿开发利用具有重要借鉴意义。
绿色发展理念下无居民海岛的开发策略——以珠海三角岛为例Development Strategy of Uninhabited Islands under the Concept of Green Development: A Case Study of Sanjiao Island in Zhuhai鄢春梅YAN Chun-meiDOI:10.12233/j.gdyl.2023.06.019风景园林实践1 国内外无居民海岛开发现状总体而言,国内针对无居民海岛的开发利用进行了较多生态环境承载力、法律空白、开发可行性等应用前期和可能风险等基础研究。
共筑绿色长城,守护生态安全作文

共筑绿色长城,守护生态安全作文英文版Building a Green Great Wall Together, Guarding Ecological SecurityIn today's world, the quest for sustainable development and environmental protection has become a global imperative. The concept of "building a green Great Wall" is not just a metaphor, but a call to action for all of us to come together and create a safer, greener future.The green Great Wall represents a collective effort to safeguard our planet's ecological security. It symbolizes the union of diverse stakeholders, from governments to communities, from individuals to organizations, all working towards a common goal: a healthy, balanced, and resilient ecosystem.To build this green Great Wall, we must adopt a holistic approach, considering all aspects of our environment. We mustprioritize the conservation of our natural resources, promote sustainable agriculture, and encourage renewable energy sources. We must also ensure that our urban planning and industrial development are in harmony with nature, minimizing the impact on our planet.Moreover, education and awareness are crucial in this endeavor. We need to raise awareness among the public about the importance of environmental protection and encourage them to adopt eco-friendly practices in their daily lives. Only through collective action and continuous effort can we hope to build a truly green Great Wall.In conclusion, building a green Great Wall is not just an environmental initiative; it is a movement that aims to safeguard our planet's ecological security for generations to come. It requires the unity of all stakeholders, a commitment to sustainability, and an unwavering dedication to protecting our environment. Together, we can build a greener, safer world for everyone.中文版共筑绿色长城,守护生态安全在当今世界,对可持续发展的追求和环境保护已成为全球性的迫切需求。
同时英文翻译

同时英文翻译English translation (700 words)China is a multi-ethnic country with a long history and glorious culture. Its territory is vast, spanning thousands of miles from east to west, and is home to a diverse range of topographical features. With a population of over 1.4 billion people, the country is the world's most populous nation.China has a socialist system and is governed by the Communist Party of China. Since the reform and opening-up policy was implemented in 1978, China has undergone significant changes and achieved remarkable economic growth. It has become the world's second-largest economy, a major trading power, and an important country in international affairs.The Chinese people are known for their hard work and resilience. In recent years, China has made great strides in various fields, such as science and technology, military strength, and space exploration. It has also made significant contributions to global governance, climate change, and poverty reduction.China's culture is rich and diverse. It has a long history of over5,000 years, with numerous ancient civilizations and dynasties. Chinese painting, calligraphy, music, and dance have a unique charm and have greatly influenced other countries' artistic traditions. Chinese cuisine, with its wide variety of flavors and cooking techniques, is also renowned worldwide.China's natural landscape is breathtaking, with picturesquemountains, rivers, lakes, and vast grasslands. The Great Wall of China, a UNESCO World Heritage site, is one of the most iconic landmarks in the world. Other famous attractions include the Terracotta Warriors and Horses, the Forbidden City, and the Yangtze River.In recent years, China has actively participated in international cooperation and played an important role in maintaining world peace and stability. It has promoted the Belt and Road Initiative, an ambitious project aimed at enhancing connectivity and cooperation between countries along the ancient Silk Road. China has also been actively involved in multilateral organizations such as the United Nations, the World Trade Organization, and the World Health Organization.China's rapid development has brought about significant changesin people's lives. The country has made remarkable progress in poverty alleviation, education, healthcare, and infrastructure construction. It has also actively promoted green and sustainable development, with the aim of building an ecological civilization.However, China still faces numerous challenges. The country has a large rural population, and the development gap between urban and rural areas remains significant. Environmental pollution, income inequality, and social issues are also areas that require attention and improvement.China's rise has drawn the attention of the international community, and the country plays a crucial role in global issues such as climate change, trade, and regional security. As China continues to growand develop, it will face both opportunities and challenges, and its international influence will continue to expand.In conclusion, China is a country with a rich history, diverse culture, and significant achievements. With its massive population, economic strength, and increasing global influence, China will continue to play a crucial role in shaping the world's future.。
区域土地资源生态安全评价

区域土地资源生态安全评价Abstract: Ecological security is the core of the research on sustainable utilization of land resources. The concept and basic objective of ecological security of regional land resource was described at first; and then the principle of evaluation on ecological security of regional land resources was explored. An empirical analysis taking Shijiazhuang city as an example was made. Base on the situtation of ecological security, the land resource in this city was dividied into 3 types,low-resk region,mid-rist region and high-risk region. Further more some countermeasures and suggestions on ensuring the ecological security of land resources in Shijiazhuang city were proposed. The results of this research objectively reflectd the present situation about ecological security of land resources in Shijiazhuang city, which had an important significance to the promotation of the sustainable social and economic development of the region.Key words: land resources; ecological security evaluation; principal component analysis method; cluster analysis method土地资源生态安全既是人类赖以生存的物质基础,又是区域经济社会可持续发展的先决条件。当前河北省正处于工业化、城镇化快速发展阶段,农地非农业化进程持续进行,具有生态功能的农用地特别是耕地资源显著减少。随着土地利用强度的不断增加以及不合理的利用方式,土地利用出现诸多问题,特别是水土流失、土地污染等生态环境问题日益突出,土地资源的可持续利用受到严重威胁。对石家庄市的土地生态安全问题进行了研究,其研究结果对于推动区域经济社会的可持续发展具有重要意义。1区域土地资源生态安全的内涵与基本目标1.1区域土地资源生态安全的的内涵土地生态安全,是指陆地表层由各种有机物和无机物构成的土地生态系统的结构不受破坏,同时土地生态系统为人类提供服务的质量和数量能够持续满足人类生存和发展的需要[1]。区域土地资源生态安全是指在特定研究区域内,人类赖以生存和发展的土地资源所处的生态环境,处于一种不受或少受威胁与破坏的健康、平衡的状态。在此种状态下,土地生态系统有稳定、均衡、充裕的自然资源可供利用,土地生态环境处于没有或很少污染的健康状态。而且,土地资源也只有在这种生态安全的状态下,才能维持土地资源与人类的协调发展,实现自然、经济和社会的可持续发展目标[2]。具体来讲,区域土地资源安全包含两重含义:一是生态系统自身的安全,即其自身结构未受破坏;二是生态系统对于人类的安全,即生态系统的功能不受损害,其提供的服务能满足人类生存和发展的需要[3]。1.2区域土地资源生态安全的基本目标生态安全是可持续发展的核心和基础,可持续发展是建立在社会、经济、人口、资源、环境相互协调和共同发展的基础上的一种发展,因此生态安全也是涉及到人口、资源、环境、经济、社会等多方面因素的一种复合系统结构的安全。土地资源是人类生存与社会经济发展的基础,土地资源生态安全的基本目标应该是自然-经济-社会复合生态系统整体结构的优化,包括土地自然生态安全、土地经济生态安全和土地社会生态安全3个方面[4]。2区域土地资源生态安全评价原理区域土地资源生态安全评价是一项涉及到资源、环境、经济、社会等诸多方面的多因素、多层次的复合系统工程。通过选取一定的指标,建立区域土地资源生态安全评价的指标体系,并收集指标原始数据,选用主成分分析法和聚类分析法,对研究区域的土地资源生态安全进行评价,评价计算过程采用统计分析软件SPSS 11.5实现。2.1区域土地资源生态安全评价指标体系的构建评价指标的选择不仅要考虑生态环境,反映出区域土地资源生态安全的目标,更要反映出对生态安全有潜在影响的重要因素的变化以及人类活动的影响,此外还要考虑生态安全指标数据的可获得性。遵循科学性、系统性、相对独立性、可操作性、可持续性等原则[4,5],从土地资源自然生态安全、土地资源经济生态安全和土地资源社会生态安全三方面选取了20项指标[6-8],区域土地资源生态安全评价指标体系见表1。2.2区域土地资源生态安全评价模型主成分分析法[9-11]是将多个因素指标转化为少数综合指标的一种统计方法。简而言之,分析指标反映的信息在一定程度上有所重叠,主成分分析是利用降维的思想,将原来较多的指标用约化后较少的综合主成分指标来代替,剔除一些没有明显分异作用的指标或相互间存在明显的线性相关关系的指标,以确定最终的综合指标。综合指标保留了原始变量的绝大多数信息,并且彼此间互不相关,能够使复杂问题简单化,减少了数据冗余。聚类分析法[12]是研究样本分类问题的一种多元统计方法。该方法以相似性为基础,寻找样本的自然分类方法,与人眼观测的分类方法相比,它有效克服了因经验和专业知识带来的主观性和任意性。评价模型根据主成分分析所得的数据,采用聚类分析方法对评价单元进行聚类分析。在各个评价单元主成分得分的基础上,用系统聚类法对各评价单元进行聚类。整个过程运用统计分析软件SPSS 11.5计算实现。评价步骤[13-15]如下:1)建立n个区域p个指标原始数据矩阵Mij(i=1,2,…,n;j=1,2,…,p)2)计算指标的相关系数矩阵Rjk。3)求特征值λk(k=1,2,…,p)。4)计算各成分的贡献率和累计贡献率,并提取主成分。5)计算主成分的权重Wj。6)计算主成分得分矩阵Yij(i=1,2,…,n;j=1,2,…,m)。8)根据各评价单元的综合得分情况,进行聚类分析。3石家庄市土地资源生态安全评价实证研究3.1研究区域概况石家庄市地处河北省中南部,位于北纬37°27′~38°47′,东经113°30′~115°20′之间。区域地貌可分西部山丘和东部平原两大类,面积分别占全市的52%和48%,地势西高东低。石家庄市辖6区、12县、5个县级市和1个国家级高新技术开发区,总面积1.57万km2,人口909万人。近几年来,随着经济的快速发展、城镇化进程的不断加快、人口的持续增加,石家庄市的大量农用地,特别是耕地资源不断减少,土地资源的生态安全受到严重威胁。3.2石家庄市土地资源生态安全评价3.2.1数据来源根据石家庄市国土资源部门和统计部门的相关数据,参阅《石家庄土地年鉴( 2007)》,《石家庄统计年鉴(2007)》,《河北经济年鉴(2007)》,获得石家庄各县(市、区)的原始数据资料,并经过简单运算得到评价体系各指标的数值(表2)。3.2.2主成分的提取在确定了研究区域指标原始数据后,利用统计分析软件SPSS 11.5的因子分析功能,对石家庄各县(市、区)的数据进行降维处理,通过提取载荷因子相关系数矩阵,得到各评价单元的因子特征值与累计贡献率(表3)。由表3可得到特征值大于1.0的因子,且累计贡献率已达87.176%,符合主成分分析的要求(一般累计贡献率不小于85%,即认为主成分以较少的指标综合体现了原来评价指标的信息),所以选取因子1~5作为主成分,作进一步分析计算,可以得到主成分载荷矩阵(表4)。3.2.4根据综合得分进行聚类分析在进行聚类分析时,由于类与类之间的距离可以有许多种定义, 所以就有很多种聚类法。这里用类平均法分别对石家庄各县(市、区)进行聚类,用SPSS 11.5统计分析软件实现聚类分析的过程,并得到聚类分析图(图2)。从图2中可以看出,当类间距取d=20时,将研究区域分为3类较合适。结合各个评价单元的综合得分、排名及石家庄市土地利用的具体情况,将该地区的生态安全划分为生态安全高风险区、生态安全中风险区、生态安全低风险区3个等级。特别需要说明的是,结合各个评价单元的综合得分、聚类分析结果及石家庄市土地利用的实际,将鹿泉市定为生态安全高风险区,高新区定为生态安全低风险区。根据生态安全分区的结果,作出石家庄市土地资源生态安全分区图(图3)。3.2.5结果分析石家庄市辖区和矿区处于生态安全低风险区;藁城市、正定县、新乐市、栾城县、辛集市、无极县、晋州市、深泽县、赵县、高邑县、元氏县处于生态安全中风险区;鹿泉市、行唐县、灵寿县、井陉县、赞皇县、平山县处于生态安全高风险区,评价结果客观地反映了石家庄市土地资源生态安全状况。就反映土地资源生态安全的单项主成分得分而言,市辖区在第一、四、五主成分的得分较高,反映市辖区的经济综合发展水平较高,但土地利用结构不够合理,在粮食自给、环境保护、生态建设等方面存在问题,所以市辖区应该在社会经济快速发展的同时,着重加强土地资源的合理利用,提高土地资源的利用率;处于生态安全中风险区的地区在第二、三主成分的得分较高,反映这些地区在土地利用、环境保护、经济发展、社会进步等方面的发展均处于一般水平,需要全面提高综合发展水平;处于生态安全高风险区的地区在第四、五主成分的得分较高,反映这些地区的土地利用结构比较合理,但社会经济发展综合实力不高,城镇基础设施和道路交通建设有待加强,经济发展速度需要提高。4生态安全对策及建议4.1编制土地生态功能区划,实施土地生态保护依据在“保护中发展,在发展中保护”的方针和“源头保护与治理”相结合的原则,编制地区土地生态功能区划,制定地区土地生态保护措施,以达到因地制宜指导经济布局和土地生态环境建设,为经济发展提供生态决策依据。同时将土地生态和环境保护的目标纳入石家庄市各项开发建设规划,坚持生态环境建设与地区的经济社会发展相互促进,共同推进。4.2调整不合理的土地利用结构和方式土地利用结构和方式的不合理是造成土地资源生态安全受到威胁的重要原因,尤其是地方政府以牺牲环境换取经济的发展,更加剧了这种生态安全恶化的趋势。建议通过调整地区的产业结构,优化土地利用的空间布局,实现土地资源的优化配置。同时应把提高土地综合生产能力和保护土地生态环境结合起来,提倡绿色环保型产业的发展。4.3控制人口数量,协调人地关系河北省是人口与粮食大省,石家庄市作为省会更是人口集中和粮食需求量剧增的地区。然而随着人口的迅速递增,人均耕地减少、耕地压力指数增大,造成石家庄市的人口与粮食矛盾日益尖锐,对土地生态环境产生了极大的压力。因此,必须严格执行计划生育政策,控制人口数量,降低人口出生率,提高人口素质,为实现人口与土地资源的协调发展创造条件。4.4建立土地生态补偿机制所谓土地生态补偿,就是通过制度创新,让土地生态保护成果的受益者支付相应的费用,从而解决好土地生态产品这一特殊公共产品消费中的“搭便车”现象,激励人们从事土地生态保护投资并使土地生态资本增值。因此,要按照“资源有偿利用、开发者保护、破坏者恢复、污染者付费”的原则,通过财政转移加大土地生态保护资金的投入,明确补偿的范围、内容、方式、途径等问题,逐步建立土地生态补偿机制。4.5综合治理“三废”,减轻土地污染贯彻“以防为主,防治结合”的原则,加大土地资源生态环境的治理力度,治理重点是控制废水、废气、固体废弃物的排放,提高资源的利用率。通过测土配方施肥,科学确定化肥的种类和农药的施用量、种类与最佳施用期,提高其利用率,同时积极研究、开发优质高效肥料和高效、低毒、低残留的生物农药,为土地生态环境保护提供有利条件。4.6开展生态保护宣传和教育,提高公众的土地生态保护意识公众的土地生态保护意识薄弱,也是造成土地生态安全问题的重要原因。因此,应当利用各种媒体,通过各种方式,加强土地生态保护宣传和教育,让生态环境教育深入人心,让广大民众认识到土地生态安全状况恶化的后果及其严重性,提高公众的生态意识,树立公众的土地生态安全观念,提高决策者的环境发展综合决策能力和公众参与、监督的积极性。参考文献:[1] 刘胜华.我国土地生态安全问题及其立法[J].国土资源科技管理,2004,21(2):53-56.[2] 刘勇,刘友兆,徐萍.区域土地资源生态安全研究——以浙江嘉兴市为例[J].资源科学,2004,5(3):71-75.[3] 崔峰.我国土地生态安全问题管窥[J].南京农业大学学报(社会科学版),2006,6(4):51-56.[4] 景丽娜,周宝同,殷清慧,等. 重庆市土地生态环境安全评价研究[J].安徽农业科学,2007,35(3):833-834,836.[5] FORMER R T T. Some general principles of landscape ecology[J]. Landscape Ecology, 1995,10(3):133-142.[6] 孙蕾.国家生态安全评价指标体系研究[J].中国统计,2005(2):21-23.[7] 王朝科.建立生态安全评价指标体系的几个理论问题[J].统计研究,2003(9):17-20.[8] 左伟,王桥,王文杰,等. 区域生态安全评价指标与标准研究[J].地理学与国土研究,2002,2(18):67-71.[9] 刘黎明.土地资源调查与评价[M].北京:中国农业大学出版社,2005.223-224.[10] 张尧庭,方开泰.多元统计分析引论[M].北京:科学出版社,2003.335-339.[11] 于秀林,任雪松.多元统计分析[M].北京:中国统计出版社,2003. 279-283.[12] 林志垒.主成分分析、聚类分析在耕地适宜性评价中的应用——以将乐县万安镇为例[J].甘肃教育学院学报(自然科学版),2001,15(2):40-46.[13] 鲍艳,胡振琪,柏玉,等. 主成分聚类分析在土地利用生态安全评价中的应用[J] .农业工程学报,2006,22(8):87-90.[14] 马惠群,刘凌,刘永珍,等.基于和谐性指标的土地利用生态安全评价[J].农业工程学报,2008,24(S1):90-92.[15] 王惠勇,曲衍波,郑晓梅,等. 主成分分析法在城镇土地生态安全评价中的应用——以山东省临沂市为例[J].安徽农业科学,2007,35(15):4614-4617.。
- 1、下载文档前请自行甄别文档内容的完整性,平台不提供额外的编辑、内容补充、找答案等附加服务。
- 2、"仅部分预览"的文档,不可在线预览部分如存在完整性等问题,可反馈申请退款(可完整预览的文档不适用该条件!)。
- 3、如文档侵犯您的权益,请联系客服反馈,我们会尽快为您处理(人工客服工作时间:9:00-18:30)。
Ecological Indicators 39 (2014) 153–159Contents lists available at ScienceDirectEcologicalIndicatorsj o u r n a l h o m e p a g e :w w w.e l s e v i e r.c o m /l o c a t e /e c o l i ndDevelopment of an ecological security evaluation method based on the ecological footprint and application to a typical steppe region in ChinaXiaobing Li ∗,Meirong Tian,Hong Wang,Han Wang,Jingjing YuState Key Laboratory of Earth Surface Processes and Resource Ecology,College of Resources Science and Technology,Beijing Normal University,Beijing 100875,Chinaa r t i c l ei n f oArticle history:Received 20June 2013Received in revised form 5December 2013Accepted 15December 2013Keywords:Ecological footprint Typical steppeEcological security Evaluation methodSustainable developmenta b s t r a c tThe steppes of Inner Mongolia lie in a region which are sensitive to global climate change.The region forms an important ecological barrier against sandstorms and it is also strategically important for the development of China’s energy and mineral resources.To describe the influence of resources exploitation on the ecological security of the typical Inner Mongolian steppe,we developed a consumption footprint pressure index (CFPI)and a production footprint pressure index (PFPI)based on the ecological footprint concept,and developed an ecological footprint contribution index (EFCI)to assess the pressures created by transferring resources and products from output areas to input ing these indices,we devel-oped a coupled ecological security assessment model to evaluate the ecological security level of the typical steppe.We used the model to calculate CFPI,PFPI,and EFCI for the steppe area for three counties and one urban region of Inner Mongolia from 2001to 2010.We found that CFPI and PFPI increased throughout the study period in most regions.In addition,EFCI was generally positive,which indicated the ecological security of the typical steppe was affected primarily by the electricity and production output processes.Our results suggest that the ecological security of the study area has been at serious risk since 2005.© 2013 Elsevier Ltd. All rights reserved.1.IntroductionIn China,population growth and socioeconomic development have been accompanied by depletion of energy resources due to excessive consumption (Dai et al.,2010).This has gradually led to serious ecological degradation and environmental dam-age,which have challenged individuals,communities,and regions.Meanwhile,finding ways to guarantee the health and sustain-able development of regional ecosystems despite of rising energy and resource demand has become the focus of research around the world (Hodson and Marvin,2009),ecological security con-cept appeared in due course.Ecological security was considered as strategically important as national defense,economic security,and financial security (Andersen and Lorch,1998;Duffy et al.,2001;Kullenberg,2002;Bonheur and Lane,2002).Maintaining global and regional ecological security,and thereby permitting sustain-able socioeconomic development,has become the consensus goal of the international community.Ecological security evaluation is comprehensive,and the main methods that have been used include the pressure-state-response∗Corresponding author.Tel.:+861058807212;fax:+861058807212.E-mail address:tianmeirong007@ (X.Li).model (Tong,2000),the system clustering method (Lundquist,2002),the ecological footprint method (Wackernagel,1998;Lenzen and Murray,2001;Huang et al.,2007;Li and He,2011;Bartel,2000),the comprehensive index method (Bartel,2000),the fuzzy comprehensive evaluation method (Onkal-Engin et al.,2004),and the neural network models (Chen,2004).Among the quantitative methods for ecological security assessment,the ecological footprint method is simple and clear in terms of concept and principles.It has therefore been applied in long-term studies of ecological risk and in regional comparisons (Stoglehner,2003;Collins et al.,2006;Senbel et al.,2003;Wackernagel et al.,2004,2006).Also this approach can become an easy-to-read measurement tool for ecological sustaina-bility (Wackernagel et al.,1999),which can also be used to judge whether a country’s or a region’s development remains within the biocapacity by comparing the consumption and production of resources in the region,thereby reveals the regional ecologi-cal security status and the potential for sustainable development (Chen et al.,2010;Liu et al.,2011).China’s Inner Mongolia Autonomous region covers about 12.5%of the country’s total land area.It is famous for its lush grasslands and rich mineral resources,and has become main output area of coal resources in China.Given the importance of coal as an energy source in China,the region therefore provides an important con-tribution to the country’s socioeconomic development.However,1470-160X/$–see front matter © 2013 Elsevier Ltd. All rights reserved./10.1016/j.ecolind.2013.12.014154X.Li et al./Ecological Indicators39 (2014) 153–159Fig.1.Location of the study area.this region also plays a vital role as an ecological barrier in north-ern China.The typical steppes of Inner Mongolia lie within the Northeast China Transect under the International Geosphere Bio-sphere Program(IGBP)which is a sensitive area of the global change (Zhang et al.,1997).However,continuous socioeconomic develop-ment with excessive exploitation of resources could induce soil and water loss and grassland degradation(Zhu and Qin,2008; Qing et al.,2013),which threatened the ecological security of the steppes.In this paper,we will introduce the study area and describe our data sources;provide an overview of the ecological footprint method and the concept of biocapacity,and propose three indices, the production footprint pressure index(PFPI),the consumption footprint pressure index(CFPI)and ecological footprint contribu-tion index(EFCI),which we use to develop a coupled ecological security assessment model and evaluate the ecological security of four typical steppe areas as well as analyze and discuss the implica-tions of our results.The general objective of the study is to measure the pressure imposed by the outside regions to the study area, thereby providing a basis for developing a plan for more sustainable regional development.2.Study areaThe typical steppes in the study were locate in the eastern part of Inner Mongolia,covering an area of1.1×105km2(Fig.1).Our study area comprises three counties and one urban region:Abag County, East Ujimqin County,West Ujimqin County and Xilinhot City.The study area has a continental arid to semiarid climate,with annual average temperatures of−1to4◦C,an annual mean precipitation of 150–450mm,and an annual evaporation of1600–2400mm,which increases from east to west.The elevation decreases gradually from 1800m in the southeast to800m in the northwest.The vegetation is dominated by xeromorphic grasses such as Stipa grandis P.Smirn, Stipa krylovii Roshev,Leymus chinensis Tzvel,Cleistogenes squarrosa Keng et al.The population in the study area had grown gradually,increas-ing from3.0×105in2001to3.5×105in2010.With the rapid socioeconomic development,per capita GDP increased to nine times of its original level,from1×104RMB in2001to9×104 RMB in2010.Simultaneously,energy consumption had increased rapidly from0.34Mt sce(standard coal equivalent)in2001to 2.8486Mt sce in2010.During this period,the electricity supply increased from429.36GW-h to495.88GW-h.3.Methods3.1.Evaluation model of ecological footprint and biocapacityEcological footprint is a kind of simple methodology but com-prehensive way for accounting the fundamental conditions for sustainability.It is a resource and emissions accounting tool measuring direct and indirect human demand for the planet’s regenerative capacity(biocapacity)and comparing it with the biocapacity available on the planet(Wackernagel et al.,1999; Monfreda et al.,2004;Galli et al.,2012a,b),there are six land-use types for measuring the ecological footprint:cropland,forestland, grazing land,fishing grounds,built-up land,and carbon uptake land (for the absorption of anthropogenic carbon dioxide emissions) (Galli et al.,2012a,b;Borucke et al.,2013)The ecological footprint (EF)can be expressed in the unit of global hectares-gha(Monfreda et al.,2004;Bastianoni et al.,2012;Galli et al.,2012a,b)through a multi-step process,as follows:EF=QY n×Y×r=QY n×Y nY w×r=QY w×r(1)where Q is the amount of a product harvested or CO2emitted,Y n is the national average yield for the product Q(or its carbon uptake capacity in cases where Q is carbon dioxide),and Y and r are the yield and equivalence factors respectively,for the land use type in question.Y is evaluated annually as the ratio of the local yield for production of a generic product(Y n)to the yield for production of the same product in the world(Y w)as a whole(Galli et al.,2007).In order to properly allocate the embodied footprints carried by tradeflows of products and keep track of the biocapacity,Consump-tion Ecological Footprint(EF C)is calculated by adding the footprint embedded in locally produced products(EF P)and the imported or input products(EF I)and subtracting the footprint of exported or output products(EF E)(Galli et al.,2012a,b;Borucke et al.,2013),to thefinal footprint value as in Eq.(2):EF C=EF P+EF I−EF E(2) Among six land-use types,the carbon uptake land is exclusively dedicated to track a waste product:carbon dioxide,since most ter-restrial carbon uptake in the biosphere occurs in forests,so carbon uptake land is assumed to be forest land by the ecological footprint methodology(Borucke et al.,2013),as in Eq.(3):EF carbon uptake land=P c(1−S ocean)Y c×r(3)where P c is the annual anthropogenic emissions(production)of carbon dioxide;S ocean is the fraction of anthropogenic emissions sequestered by oceans,about one-third of anthropogenic emissions are absorbed by the oceans from the total anthropogenic emissions (IPCC,2001);Y c is the annual rate of carbon uptake per hectare of world average forest land.Biocapacity reflects the entire biologically productive area and represents the maximum level of resource supply,which is the counterpart of the footprint(Wackernagel and Rees,1996;X.Li et al./Ecological Indicators39 (2014) 153–159155 Wackernagel et al.,1999;Monfreda et al.,2004).The calculationof the total biocapacity(BC)can be expressed as follows:BC=ni=1a i×r i×Y iwhere a i is the real land area for the i th category of land type (gha),Y i is the yield factor of the i th category of land type,and r i is the equivalence factor of the i th category of land type.In cal-culating BC,we adopted the suggestion of the World Commission on Environment and Development that the area of biologically pro-ductive land should be decreased by12%to account for biodiversity conservation.The data used in the calculation of ecological footprint and bio-capacity are drawn from the Statistical Yearbooks of Abag County, East Ujimqin County,West Ujimqin County,and Xilinhot City that were published by the local governments from2002to2011; Though the yield factors and equivalence factors may alter due to the land use pattern and regional technology development in different years,the variation is normally slight to affect the total time series of ecological footprint,thus,we refer the value of the yield factors to the other papers in the calculation(Xu et al.,2003; Wackernagel et al.,1999);the calculation of P c is on the basis of the accounting methods of carbon dioxide emissions published in the Fourth Assessment Report(AR4)of the United Nations Inter-governmental Panel on Climate Change(IPCC,2007;Li,2013),Y c is obtained from relevant literature(Venetoulis and Talberth,2008).3.2.Evaluation model of ecological securityBoth ecological footprints and biocapacity use standardized hectares that allow for the meaningful comparison between each other.Hence,aggregate human demand(ecological footprint)and nature’s supply(biocapacity)can be directly compared to each other.The component and aggregate areas are commensurable. Meanwhile,the comparison result reveals whether the existing natural capital is sufficient to support the current consumption and production patterns(Monfreda et al.,2004).Because of the regional trade in energy and products,the ecological pressure of resource output area come both from local production/consumption of resources and energy and from consumption of resources during production processes at a higher level.Thus,the ecological pres-sure must account for both resource-output areas and resource input areas,in proportion to the ratio of product consumption to production.3.2.1.CFPIIn this paper,we accounted for consumption pressure by using the CFPI index:CFPI=EF cBC(7)CFPI mainly reflects the ecological pressure which is caused by the consumption of resources and sequestering carbon diox-ide emissions etc.in the industry and daily life of local residents. If CFPI>1,the consumption footprint is greater than the BC in the study area,leading to an ecological deficit that can only be mitigated by importing resources from outside or overuse of local resources. If CFPI<1,the consumption footprint is less than the BC,which means the region is ecologically secure and there is the potential for additional development.If CFPI=1,the system is in equilibrium between consumption and BC.3.2.2.PFPIIn this paper,we accounted for production pressure by using the PFPI index:PFPI=EF pBC(8) where EF p is production ecological footprint,PFPI mainly reflects the production pressure for producing food and generating elec-tricity and so on.If PFPI>1which means the production consumes the local natural resources excessively leading to ecological over-shoot;If PFPI<1,the production footprint is less than the BC,which indicates that production is ecologically safe and that there may be room for additional development.If PFPI=1,the system is in equilibrium between production and BC.3.2.3.Ecological footprint contribution index(EFCI)We determined the balance between production and consump-tion pressure using the EFCI index:EFCI=EF p−EF cEF c(9)If EF p>EF c,EFCI will be positive,and the study area is defined as a resource and product output area.This means that local ecolog-ical security is affected by both local and external production and consumption,but that production is playing a more important role; as a result,the ecological pressure will be transferred from input to output area influencing the local ecological security.If EF p<EF c, EFCI will be negative,which means that the production level cannot satisfy the consumption demand in the study area,and the level of ecological security will be determined primarily by the consump-tion footprint.If EF p=EF c,EFCI will be zero,which means that the system is in equilibrium between production and consumption.3.2.4.Coupled ecological security assessment modelTo describe the ecological security of a study area,we define the parameter T,whose value represents the dominant parameter (production or consumption)for that area:If EFCI≥0,then T=PFPIIf EFCI<0,then T=CFPI(10)Table1summarizes the levels of ecological security based on the parameters in this model.4.Results4.1.Variations of the ecological footprint and BCThe national energy account needs to be corrected because of trade(Wackernagel et al.,1999),and so does the ecological foot-print account due to the same reason,some of the carbon footprint which come from consuming energy needs to be deducted from the ecological footprint account as energy is consumed to pro-duce export goods,while the carbon footprint embodied in import goods needs to be added.However,the study area is a relatively small administrative district for which the import/export data is not available,thus the impact of trade on the ecological footprint, will distorts the relative size of footprints of consumption,but we will be able to calculate the net input or output ecological footprint via the comparison of footprint of production and consumption, and then to judge whether the pressure for the ecological security is from resource output or excessive consumption.The results of EF p and EF c of the study area were shown in Figs.2and3,which gener-ally increased from2001to2010.The production footprint in2010 had increased to1.81times its2001value of1.65×106gha,reach-ing3.00×106gha in2010(Fig.2),socioeconomic development accelerated the food production and the electricity generation,156X.Li et al./Ecological Indicators 39 (2014) 153–159Table 1Summary of the coupled ecological safety assessment model.ScenarioIndexEcological security stateInterpretationEFCI ≥0(EF p ≥EF c )T =PFPIPFPI >CFPI >1Very riskyThe production footprint and consumption footprint are beyond the BC,so the ecological pressuretransferred from outside the study area increases,thereby increasing the threat to ecological security is decided by both PFPI and CFPI1≥PFPI >CFPIT <0.5very safe The production and consumption footprints are both within the BC,so the study area has potential for additional development0.5≤T <0.8safe0.8≤T ≤1.0not very safe PFPI >1,CFPI <1RiskyThe consumption footprint is within the BC,but the production footprint exceeds BC,so the threat to ecological security is decided by the PFPIEFCI <0(EF p <EF c )T =CFPICFPI >PFPI >1Very riskyThe production and consumption footprints arebeyond the BC,so the threat to ecological security is decided by both CFPI and PFPI1≥CFPI >PFPIT <0.5very safe The production and consumption footprints are both within the BC,so the study area has the potential for additional development0.5≤T ≤0.8safe0.8≤T ≤1.0not very safe CFPI >1,PFPI <1RiskyThe production footprint is within the BC,but theconsumption footprint is beyond the BC,so the threat to ecological security is decided byCFPIFig.2.Changes in the production footprint and biocapacity (BC)in the typical Inner Mongolian steppe from 2001to 2010.especially in Xilinhot City;the growth of the production footprint accelerated accordingly.The growth rate of EF p of Xilinhot City was higher than those of the other areas,and accounted for 38.5%of the total production footprint in 2010.The EF c increased to 4.51times its 2001value of 0.62×10⁶gha,reaching 2.80×10⁶gha in 2010(Fig.3)as a result of improvements in the regional standard of living.BC changed slightly,from 1.16×10⁶gha in 2001to 1.31×10⁶gha in 2010,because the dominantbiologicallyFig.3.Changes in the consumption footprint and biocapacity (BC)in the typical Inner Mongolian steppe from 2001to 2010.productive land type of the steppe was grassland,and the areas of other types of productive land only changed slightly during this period.The EF p was higher than the BC from 2001to 2010(Fig.2),and the gap between them means the production consumed the local natural resources excessively leading to ecological overshoot.The EF c was lower than the BC from 2001to 2004,which means resources used and wastes produced can be afforded in the range of the biocapacity and the region is ecologically secure and there is the potential for additional development.However,the consump-tion footprint was higher than the BC thereafter,indicating that the typical steppes are experiencing an ecological deficit because of their demand for resources is not met by a sufficient local supply,expressed by BC.Since there is little import from other districts,it has to rely on the overuse of local resources with respect to higher local demand.4.2.Changes in CFPI,PFPI,and EFCIUsing our coupled evaluation model for ecological security,we calculated the ecological footprint and BC for each of the regions,and used the resulting CFPI,PFPI,and EFCI values for total study area,Abag County,East Ujimqin County,West Ujimqin County,and Xilinhot City based on the relevant statistical data from 2001to 2010.According to the coupled model,if both PFPI >1and CFPI >1,the ecological security was considered to be very risky,whereas if CFPI <1and PFPI >1or CFPI >1while PFPI <1,the ecological secu-rity was considered to be risky.Our results showed that the total study area was very risky from 2005to 2010and was risky from 2001to 2004(Fig.4a).Abag County was risky until 2009,and only 2010became very risky (Fig.4b).East Ujimqin County was risky from 2001to 2007and 2009,and the other years was very risky (Fig.4c).West Ujimqin was risky from 2001to 2006and thereafter became very risky (Fig.4d).Xilinhot City was very risky through-out the study period (Fig.4e).According to the analysis the changes in the consumption footprint and production footprint of different land use types from 2001to 2010for total study areas (Fig.5a and b),we can find that the risk mainly comes from grazing land in terms of production footprint,since the typical steppe covers 88%of the total study area,and the biocapacity varied from 0.80×10⁶gha to 0.84×10⁶gha,which was much lower than the production foot-print ranging from 1.38×10⁶gha to 1.96×10⁶gha in the same period from 2001to 2010;Regarding the consumption footprint,X.Li et al./Ecological Indicators 39 (2014) 153–159157E F C IP F P I a n d C F PIE F C IP F P I a n d C F PIE F C IP F P I a n d C F CIE F C IP F P I a n d C F CIE F C IP F P I a n d C F PIFig.4.(a)Changes in the production footprint pressure index (PFPI),consumption footprint pressure index (CFCI),and ecological footprint contribution index (EFCI)in total study area.(b)Changes in the production footprint pressure index (PFPI),consumption footprint pressure index (CFCI),and ecological footprint contribution index (EFCI)for Abag County.(c)Changes in the production footprint pressure index (PFPI),consumption footprint pressure index (CFCI),and ecological footprint contri-bution index (EFCI)for East Ujimqin County.(d)Changes in the production footprint pressure index (PFPI),consumption footprint pressure index (CFCI),and ecological footprint contribution index (EFCI)for West Ujimqin County.(e)Changes in the production footprint pressure index (PFPI),consumption footprint pressure index (CFCI),and ecological footprint contribution index (EFCI)for Xilinhot City.the risk is mainly induced by the carbon uptake land,which raised 14.8times from 0.14×10⁶gha in 2001to 2.18×10⁶gha in 2010,because of the requirement for the energy consumption,which lead to carbon dioxide emissions during the socioeconomic develop-ment.Most of the EFCI values were greater than 0,except for Xilinhot City from 2002to 2010,total study area and West Ujimqin County at 2008,and East Ujimqin County at 2010(Fig.4a–e).This means that the ecological security was determined primarily by the PFPI,asaFig.5.(a)Changes in the production footprint of land use types from 2001to 2010for total study areas.(b)Changes in the consumption footprint of land use types from 2001to 2010for total study areas.result of increasing PFPI,the ecological pressure transferred from outside the region increased obviously and increasingly threatened the local ecological security.EFCI showed a trend of decrease in the study area,which means that although the threat to ecologi-cal security came primarily from the production of resources but the influence of external pressure on ecological security begins to change to internal pressure.EFCI values were less than 0in Xil-inhot City after 2001,this means that the ecological security was determined primarily by the CFPI.The local consumption structure should be adjusted to add more input resources from outside and reduce the over-consumption of local resources in order to reduce CFPI,and then the ecological deficit.5.DiscussionMost of EFCI was positive,and PFPI or CFPI were greater than 1.These results indicated that the region’s ecological security was threatened more by outputting electricity and other products than by local consumption pressure.The gross national product (GNP)of our study area in Inner Mongolia increased to 7.77times its 2001value of 41.46×10⁹RMB,reaching 322.21×10⁹RMB in 2010.This rapid development accelerated the production and consumption of resources,as a result,the production footprint increased to 12.24times its 2001value,which was faster than the GNP growth rate.In addition,the development was achieved at the cost of exces-sive exploitation of the region’s resources.Based on our model for evaluating ecological security,the only effective way to reduce this158X.Li et al./Ecological Indicators39 (2014) 153–159ecological pressure and improve the level of ecological security would be to decrease the production footprint or improve the BC. However,the BC changed only slightly because most of the land use was pasture,which accounted for89%of the total land area; the other land-use and cover types had little impact on the BC. Therefore,improving the level of ecological security will require a reduction of the production footprint by means of more appropri-ate allocation of resources.Therefore,ecological protection of the steppes should focus on more efficient resource allocation,thereby mitigating the threat to the ecological security caused by socioeco-nomic development and helping to achieve sustainable utilization of the region’s resources.The EF methodology uses data on energy and resources con-sumption,waste generation(measured as carbon dioxide)to estimate the total ecosystem area(in terms of global average hectares–gha)(Kissinger et al.,2013),Which requires a consid-eration of both consumption footprint and production footprint. There are six land-use types for measuring the EF,which is con-trasted withfive demand categories of BC.The reason for this discrepancy is that two demand categories,forest products and carbon sequestration,compete for the same biocapacity category: forest land(Borucke et al.,2013).Both EF and BC use standard-ized hectares to measure the demand on natural capital versus the ability of natural capital to meet the demand.Hence,the component and aggregate areas are commensurable(Monfreda et al.,2004).On this basis,we introduced the PFPI,CFPI,and EFCI parameters to clarify the root causes of the threats to ecological security.In future research,these indices should be expanded so that our analysis can account for more of the factors that determine mankind’s ecological footprint and its impacts on the biocapac-ity.Because unified statistics and the data of import and export were not available in each county’s statistical yearbooks,we adopted common items in selecting the consumption and production items that formed the basis of our calculations.This means that the results for each area cannot be fully compared,but that we can still use the relative changes to compare the regions.Thus,our analysis provides a useful measure of the changes in regional ecological security over time.The coupled assessment model considers the relationship between ecological security and local production and consumption pressures,and thereby reflects the pressure on the local environment created by the production of resources as well as their consumption.However,it will be necessary tofind ways to further improve the ecological security.This will be the subject of our future research.AcknowledgmentsThe research was funded by the National Natural Science Fund of China(number:41030535),the National Key Basic Research Program of China(2014CB138803),the Program for Changjiang Scholars and Innovative Research Team in Uni-versity(IRT1108),and the International Cooperation Project (2013DFR30760).ReferencesAndersen,P.P.,Lorch,R.P.,1998.Food security and sustainable use of natural resources:a2020vision.Ecol.Econ.26,1–10.Bartel,A.,2000.Analysis of landscape pattern:towards a“top-down”indicator for evaluation of land use.Ecol.Model.130,87–94.Bonheur,N.,Lane,B.D.,2002.Natural resources management for human security in Cambodia’s Tonle Sap Biosphere Reserve.Environ.Sci.Pollut.5,33–41. Bastianoni,S.,Niccolucci,V.,Pulselli,R.M.,Marchettini,N.,2012.Indicator and indi-candum:“Sustainable way”vs“prevailing conditions”in the ecological footprint.Ecol.Indic.16,47–50.Borucke,M.,Moore,D.,Cranston,G.,Gracey,K.,Iha,K.,Larson,J.,Lazarus,E.,Morales, J.C.,Wackernagela,M.,Galli,A.,2013.Accounting for demand and supply of thebiosphere’s regenerative capacity:The National Footprint Accounts’underlying methodology and framework.Ecol.Indic.24,518–533.Chen,D.D.,Gao,W.S.,Chen,Y.Q.,Zhang,Q.,2010.Ecological footprint analysis of food consumption of rural residents in China in the latest30years.Agric.Agric.Sci.Procedia1,106–115.Chen,K.P.,2004.Artificial neural networks for risk decision support in natural hazards:a case study of assessing the probability of house survival from bush-fires.Environ.Model.Assess.9(3),189–199.Collins,A.,Flynn,A.,Wiedmann,T.,Barrett,J.,2006.The environmental impacts of consumption at a subnational level–the ecological footprint of Cardiff.J.Ind.Ecol.10(3),9–24.Dai, F.Q.,Nan,L.,Liu,G.C.,2010.Assessment of regional ecological security based on ecological footprint and influential factors analysis:a case study of Chongqing Municipality,China.Int.J.Sustain.Dev.World.Ecol.17(5), 390–400.Duffy,S.B.,Michael,S.C.,Grant,W.E.,2001.Simulating land-use decisions in the La Amistad Biosphere Reserve buffer zone in Costa Rica and Panama.Ecol.Model.140,9–29.Galli,A.,Kitzes,J.,Wermer,P.,Wackernagel,M.,Niccolucci,V.,Tiezzi,E.,2007.An exploration of the mathematics behind the ecological footprint.Int.J.Ecodyn.2(4),250–257.Galli,A.,et al.,2012a.Assessing the global environmental consequences of economic growth through the ecological footprint:a focus on China and India.Ecol.Indic.17,99–107.Galli,A.,et al.,2012b.Integrating ecological,carbon and water footprint into a“Foot-print Family”of indicators:definition and role in tracking human pressure on the planet.Ecol.Indic.16,100–112.Hodson,M.,Marvin,S.,2009.‘Urban ecological security’:a new urban paradigm?Int.J.Urban Reg.Res.33(1),193–215.Huang,Q.,Wang,R.H.,Ren,Z.Y.,Li,J.,Zhang,H.Z.,2007.Regional ecological secu-rity assessment based on long periods of ecological footprint analysis.Resour.Conserv.Recycl.51(1),24–41.IPCC,2001.Climate Change2001:The Scientific Basis.Cambridge University Press, Intergovernmental Panel on Climate Change(IPCC),Cambridge,UK.IPCC,2007.Climate Change2007:the Fourth Assessment Report(AR4)of the United Nations Intergovernmental Panel on Climate Change(IPCC).Cambridge Univer-sity Press,Cambridge,UK.Kullenberg,G.,2002.Regional co-development and security:a comprehensive approach.Ocean Coast.Manage.45,761–776.Kissinger,M.,Sussman,C.,Moore,J.,Rees,W.E.,2013.Accounting for the ecological footprint of materials in consumer goods at the urban scale.Sustainability5, 1960–1973.Lenzen,M.,Murray,S.A.,2001.A modified ecological footprint method and its appli-cation to Australia.Ecol.Econ.37,229–255.Li,Z.C.,He,J.H.,2011.Regional ecological security assessment based on improved method of ecological footprint–the case of Shandong Chang Dao County.In:Proc.2011Int.Symp.Econ Transit.Dev Foreign-funded Enter, pp.8–14.Liu,X.T.,Sheng,Z.F.,Wang,Y.L.,2011.Study on tourism ecological footprint of Loudi City in Hunan“3+5”urban agglomeration.Appl.Mech.Mater.55–57, 1566–1571.Li,X.,2013.An research on regional differences of China’s carbon dioxide emissions-based on the IPCC carbon emissions accounting method.Territ.Nat.Resour.Study2,63–65.Lundquist,J.E.,e of Fourier transforms to define landscape scales of analysis for disturbances:a case study of thinned and unthined forest ndsc.Ecol.17(5),445–454.Monfreda,C.,Wackernagel,M.,Deumling,D.,2004.Establishing national natural capital accounts based on detailed ecological footprint and biological capacity nd Use Policy21(3),231–246.Onkal-Engin,G.,Guleda,D.,Ibrahim,H.H.,2004.Assessment of urban air quality in Istanbul using fuzzy synthetic evaluation.Atmos.Environ.38,3809–3815. Qing,Z.S.,Wu,S.H.,Zhao,D.S.,Dai,E.F.,2013.Temporal-spatial changes in inner mongolian grassland degradation during past three decades.Agric.Sci.Technol.14(4),676–683.Senbel,M.,McDaniels,T.,Dowlatabadi,H.,2003.The ecological footprint:a non-monetary metric of human consumption applied to North America.Glob.Environ.Change13(2),83–100.Stoglehner,G.,2003.Ecological footprint–a tool for assessing sustainable energy supplies.J.Clean.Prod.11(3),267–277.Tong,C.,2000.Review on environmental indicator research.Res.Environ.Sci.13(4), 53–55(in Chinese with English abstract).Venetoulis,J.,Talberth,J.,2008.Refining the ecological footprint.Environ.Dev.Sus-tain.10(4),441–469.Wackernagel,M.,1998.The ecological footprint:an indicator of progress toward regional sustainability.Environ.Model.Assess.51(1),511–529. Wackernagel,M.,Kitzes,J.,Moran,D.,Goldfinger,S.,Thomas,M.,2006.The ecological footprint of cities and regions:comparing resource availability with resource demand.Environ.Urban18(1),103–112.Wackernagel,M.,Monfreda,C.,Erb,K.H.,Haberl,H.,Schulz,N.B.,2004.Ecological footprint time series of Austria,the Philippines,and South Korea for1961–1999: comparing the conventional approach to an‘actual land area’nd Use Policy21(3),261–269.Wackernagel,M.,Onisto,L.,Bello,P.,Linares,A.C.,Falfán,I.S.L.,García,J.M.,Guer-rero,A.I.S.,Guerrero,M.G.S.,1999.National natural capital accounting with the ecological footprint concept.Ecol.Econ.29(3),375–390.。