加里森管理会计讲义笔记英文版最新精品GNB_16e_CH11_LectureNotes
加里森管理会计教学课件最新英文精品Garrison16e_PPTch10A
( ) Volume
variance
=
$3.00 per machine-hour
×
90,000 mach-hours
–
84,000 mach-hours
Volume = 18,000 Unfavorable variance
A Pictorial View of the Variances
Actual Fixed Overhead
$
4.00 per machine-hour
Standard machine-hrs. allowed for the act. prod. (b)
84,000 machine hours
Manufacturing overhead applied (a) × (b)
$ 336,000
Actual manufacturing overhead
Actual $280,000 Budget $270,000
{ Budget Variance 10,000 U
0
0
Machine-hours (000)
Denominator hours
90
Graphic Analysis of Fixed Overhead Variances – Part 3
Reconciling Overhead Variances and Underapplied or Overapplied Overhead
In a standard cost system:
Unfavorable variances are equivalent to underapplied overhead.
Fixed Overhead Applied
加里森管理会计讲义笔记英文版最新精品GNB_16e_CH12_LectureNotes
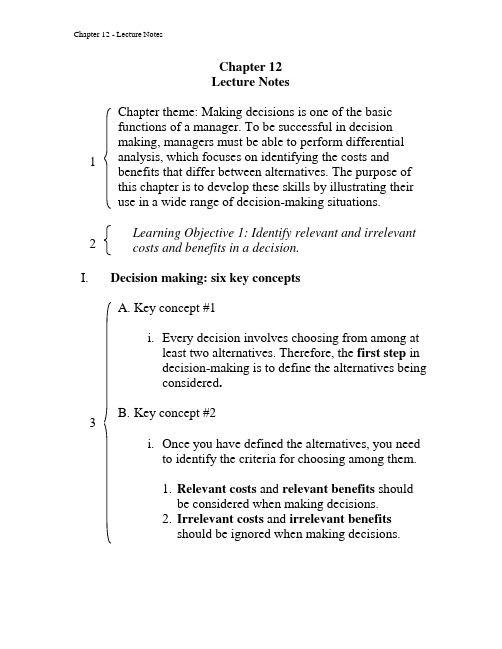
Chapter 12Lecture NotesChapter theme: Making decisions is one of the basic functions of a manager. To be successful in decision making, managers must be able to perform differential analysis, which focuses on identifying the costs andbenefits that differ between alternatives. The purpose of this chapter is to develop these skills by illustrating their use in a wide range of decision-making situations.Learning Objective 1: Identify relevant and irrelevant costs and benefits in a decision.I. Decision making: six key conceptsA. Key concept #1i. Every decision involves choosing from among atleast two alternatives. Therefore, the first step indecision-making is to define the alternatives beingconsidered .B. Key concept #2i. Once you have defined the alternatives, you needto identify the criteria for choosing among them.1. Relevant costs and relevant benefits shouldbe considered when making decisions.2. Irrelevant costs and irrelevant benefitsshould be ignored when making decisions.i.The key to effective decision making is differential analysis—focusing on the future costs and benefits that differ between the alternatives. Everything else is irrelevant and should be ignored.1.A future cost that differs between any twoalternatives is known as a differential cost.Differential costs are always relevant costs. 2.Future revenue that differs between any twoalternatives is known as differential revenue.3.An incremental cost is an increase in costbetween two alternatives.4.An avoidable cost is a cost that can beeliminated by choosing one alternative overanother.D.Key concept #4i.Sunk costs are always irrelevant when choosingamong alternatives.1.A sunk cost is a cost that has already beenincurred and cannot be changed regardless ofwhat a manager decides to do.E.Key concept #5i.Future costs and benefits that do not differbetween alternatives are irrelevant to thedecision-making process.i. Opportunity costs also need to be considered when making decisions.1. An opportunity cost is the potential benefitthat is given up when one alternative is selectedover another.II. Identifying relevant costs and benefitsA. An examplei. Assume the following information with respect to Cynthia, a Boston student who is consideringvisiting her friend in New York. Cynthia is tryingto decide whether it would be less expensive todrive or take the train to New York.1. She has assembled the following informationwith respect to her automobile.2. She has also gathered the additionalinformation as shown to aid in her decision.3. Which costs are relevant to her decision?a. The cost of the car is irrelevant to thedecision because it is a sunk cost.b. The annual cost of auto insurance isirrelevant because it does not differbetween alternatives.c. The cost of the gasoline is relevant becauseit is avoidable if she takes the train.d. The cost of maintenance and repairs is relevant because in the long-run these costs depend upon miles driven.e. The parking fee at school is irrelevant because it is not a differential cost.f. The decline in resale value is relevant due to the additional miles driven.g. The round trip train fare is relevant because it is avoidable if she drives her car.h. Relaxing on the train is relevant , but difficult to quantify.i. The kennel cost is irrelevant because it is not a differential cost.j. The cost of parking in New York is relevant because it is avoidable if she takes the train.k. The benefits of having a car in New York and the problem of finding a parking space are both relevant , but difficult to quantify. 4. From a financial standpoint, Cynthia would be better off taking the train .III.Decision analysis: the total cost and differential costapproachesA. An examplei. Assume the following information for a company considering a new labor-saving machine that rents for $3,000 per year . Notice:1. The total approach requires constructing twocontribution format income statements – onefor each alternative.2. The difference between the two income statements of $12,000 equals the differential benefits shown at the bottom of the right-hand column.3. The most efficient means of analyzing thisdecision is to use the differential approach toisolate the relevant costs and benefits as shown.ii.Using the differential approach is desirable for two reasons :1. Only rarely will enough information be available to prepare detailed income statementsfor both alternatives.2. Mingling irrelevant costs with relevant costsmay cause confusion and distract attentionaway from the information that is really critical.segmentsLearning Objective 2: Prepare an analysis showing whether a product line or other business segment should be added or dropped.A. One of the most important decisions managers make is whether to add or drop a business segment .i. Ultimately, a decision to drop an old segment oradd a new one is going to hinge primarily on itsfinancial impact. To assess this impact it isnecessary to carefully analyze the costs.B. Lovell Company – an examplei. Assume that Lovell Company’s digital watch line has not reported a profit for several years;accordingly, Lovell is considering whether to keep or drop this product line.1.To determine how dropping this line will affect the profits of the company, Lovell willcompare the contribution margin that would be lost to the costs that would be avoided if the line was to be dropped.ii. Assume a segmented income statement for the digital watches line is as shown. Also, assume the following:1. An investigation has revealed that the fixed general factory overhead and fixed generaladministrative expenses will not be affected by dropping the digital watch line.2. The equipment used to manufacture digitalwatches has no resale value or alternative use . iii. A contribution margin approach reveals that the contribution margin lost ($300,000) exceeds the fixed costs avoided ($260,000) by $40,000.Therefore, Lovell should retain the digital watch segment.iv. C omparative income statements can also be prepared to help make the decision.1. These income statements show that if thedigital watch line is dropped, the company loses $300,000 in contribution margin. 2. The general factory overhead ($60,000) would be the same under both alternatives, so it is irrelevant . 3.The salary of the product line manager ($90,000) would disappear, so it isrelevant tothe decision.4. The depreciation ($50,000) is a sunk cost. Also, remember that the equipment has no resalevalue or alternative use, so the equipment and the depreciation expense associated with it are irrelevant to the decision.5. The complete comparative income statements reveal that Lovell would earn $40,000 ofadditional profit by retaining the digital watch line.v. Lovell’s allocated fixed costs can distort the keep/drop decision.1. Lovell’s managers may ask “why keep the digital watch segment when its segmentedincome statement shows a $100,000 loss ?”2. The answer lies in the way common fixed costs are allocated to products.a. Including unavoidable common fixed costs in the segmented income statement makes the digital watch product line appear to beunprofitable, when in fact dropping theproduct line would decrease the company’soverall net operating income.V. Make or buy decisionsLearning Objective 3: Prepare a make or buy analysis.A. Key terms and strategic aspects i. When a company is involved in more than one activity in the entire value chain, it is vertically integrated . 1. A decision to carry out one of the activities inthe value chain internally , rather than to buy externally from a supplier, is called a make or buy decision .Helpful Hint: Some critics charge that managers have habitually based make or buy decisions on per unit data without determining which costs are relevant and which are not. Since the per unit costs typically includeallocated common fixed costs, they overstate the costs of producing internally. This creates a bias in favor of outsourcing production.ii.Vertical integration provides certain advantages:1.An integrated company may be able to ensure a smoother flow of parts and materials for production than a nonintegrated company.2.Some companies feel that they can controlquality better by producing their own partsand materials.3.Integrated companies realize profits from theparts and materials that they choose to makeinstead of buy.iii.T he primary disadvantage of vertical integration is that a company may fail to take advantage ofsuppliers who can create an economies of scaleadvantage by pooling demand from numerouscompanies.1.While the economies of scale factor can beappealing, a company must be careful to retaincontrol over activities that are essential tomaintaining its competitive position.B.Essex Company – an examplei.Assume that Essex Company currentlymanufactures part 4A with a unit product cost asshown.1.Also, assume the following information asshown with respect to part 4A. Given theseadditional assumptions, should Essex stopmaking part 4A and buy it from an outsidesupplier?ii. The avoidable costs associated with making part 4A include direct materials ($180,000), direct labor ($100,000), variable overhead ($20,000), and the supervisor’s salary ($40,000). Notice: 1. The depreciation of special equipment is irrelevant. The cost incurred to buy the equipment is a sunk cost; the depreciation simply spreads this sunk cost over the equipment’s useful life. Furthermore, the equipment has no resale value. Thus, the special equipment and its associated depreciation expense are irrelevant to the decision. 2. The allocated general factory overhead represents allocated costs common to all items produced in the factory and would continueunchanged even if Part 4A was purchased from an outside supplier. Thus, the general factory overhead is also irrelevant to the decision.iii. T he financial advantage of making the part is $160,000 less than the cost of buying the part, thereby suggesting that Essex should continue to make the part .C.Opportunity costi.Opportunity costs are not recorded in the organization’s general ledger because they do not represent actual dollar outlays.Rather, theyrepresent economic benefits that are forgone as aresult of pursuing some course of action.ii.In the Essex Company example that we justcompleted, if the space now being used to producePart 4A would otherwise be idle, then thecompany should continue to make its own partsand the supplier’s offer should be rejected. Idlespace that has no alternative use has anopportunity cost of zero.1.If the space to make Part 4A had an alternativeuse, the opportunity cost would have beenequal to the segment margin that could havebeen derived from the best alternative use ofthe space.VI.Special order decisionsLearning objective 4: Prepare an analysis showingwhether a special order should be accepted.A.Key terms and conceptsi. A special order is a one-time order that is notconsidered part of the company’s normal ongoingbusiness.ii. When analyzing a special order, only the incremental costs and benefits are relevant. Since the existing fixed manufacturing overhead costs would not be affected by the order, they are not relevant.Helpful Hint: Emphasize the incremental concept in the decision-making process. If a company accepts aspecial order to produce an item without carefullydetermining existing capacity, it might have to cut into regular production. The effects of lost sales fromongoing products might be devastating.B. Jet Inc. – an examplei. Assume the following information with respect to a special order opportunity for Jet Inc. Should Jet accept the offer ? ii. A contribution format income statement for Jet Inc.’s normal sales of 5,000 units is as shown.iii. I f Jet accepts the special order, the incrementalrevenue of $30,000 will exceed the incrementalcosts of $24,000 by $6,000. This suggests that Jetshould accept the order. Notice:1. This answer assumes that the fixed costs areunavoidable and that variable marketing costsmust be incurred on the special order.Quick Check – special order decision makingVII.Volume trade-off decisionsLearning Objective 5: Determine the most profitableuse of a constrained resource.A.Key terms and conceptspanies are forced to make volume trade-offdecisions when they do not have enough capacityto produce all of the products and sales volumesdemanded by their customers.1.In these situations, companies must trade off,or sacrifice production of some products infavor of others in an effort to maximizeprofits.ii.When a limited resource of some type restricts the company’s ability to satisfy demand, the companyis said to have a constraint. The machine orprocess that is limiting overall output is called thebottleneck—it is the constraint.Helpful Hint: A production process can be thought ofas a chain; each link in the chain represents a step inthe process. A chain is only as strong as its weakest link.Likewise, the capacity of a production process isdetermined by its weakest link, which is the constraint.To increase the strength of a chain, its weakest linkmust be strengthened. To increase the output of theentire process, the output of the constraint must beincreased. Strengthening the stronger links has noeffect on the strength of the entire chain. The moral isto identify the constraint and concentrate managementattention on effectively increasing its capacity.54iii.F ixed costs are usually unaffected in these situations, so the product mix that maximizes the company’s total contribution margin shouldordinarily be selected.iv.A company should not necessarily promote those products that have the highest unit contributionmargins. Rather, total contribution margin will bemaximized by promoting those products oraccepting those orders that providethe highest contribution margin in relation to theconstraining resource.B.Ensign Company – an examplei.Assume that Ensign Company produces twoproducts and selected data are as shown. Inaddition assume that:1.Machine A1 is the constraint.2.There is excess capacity on all other machines.3.Machine A1 has a capacity of 2,400 minutesper week.4.Ensign is trying to decide if it should focus itsefforts on product 1 or 2.Quick Check – constrained resource calculationsii.As suggested by the answer to the Quick Check question, Ensign should emphasize product 2 because it generates a contribution margin of $30 per minute of the constrained resource relative to $24per minute for product 1.iii.E nsign can maximize its contribution margin by first producing product 2 to meet customer demand and then usingany remaining capacity to produce product 1. The calculations would beperformed as follows:1.Satisfying the weekly demand of 2,200 unitsfor product 2 would consume 1,100 minutes ofavailable capacity on machine A1.2.This implies that 1,300 constraint minuteswould still be available to satisfy demand forproduct 1.3.Since each unit of product 1 requires oneminute of A1 machine time, Ensign couldproduce 1,300 units of product 1 with itsremaining capacity.4.This mix of production (e.g., 2,200 units ofproduct 2 and 1,300 units of product 1) wouldyield a total contribution margin of $64,200. Learning Objective 6: Determine the value of obtaining more of the constrained resource.i.How much should Ensign be willing to pay for anadditional minute of A1 machine time?1. Because the additional machine time would beused to make more units of Product 1, Ensignshould be willing to pay up to $24 per minute.This amount equals the contribution margin perminute of machine time that would be earnedproducing more units of Product 1.Quick Check – constrained resource calculationsC.Managing constraintsi.It is often possible for a manager to increase thecapacity of a bottleneck, which is called relaxing(or elevating) the constraint, in numerous wayssuch as:1.Working overtime on the bottleneck.2.Subcontracting some of the processing thatwould be done at the bottleneck.3.Investing in additional machines at thebottleneck.4.Shifting workers from non-bottleneckprocesses to the bottleneck.5.Focusing business process improvementefforts on the bottleneck.6.Reducing defective units processed throughthe bottleneck.VIII. Joint product costs and sell or process further decisionsLearning Objective 7: Prepare an analysis showing whether joint products should be sold at the split-off point or processed further. A. Key terms/conceptsi. In some industries, a number of end products areproduced from a single raw material input. Whentwo or more products are produced from acommon input these products are known as jointproducts . The split-off point is the point in themanufacturing process at which the joint productscan be recognized as separate products.1. For example, in the petroleum refiningindustry a large number of products areextracted from crude oil, including gasoline, jetfuel, home heating oil, lubricants, asphalt, andvarious organic chemicals.ii. The term joint cost is used to describe costsincurred up to the split-off point. Joint costs arecommon costs incurred to simultaneously producea variety of end products.1. Joint costs are traditionally allocated among different products at the split-off point. A typical approach is to allocate joint costs according to the relative sales value of the end products.2. Although allocation is needed for some purposes such as balance sheet inventory valuation, allocations of this kind are very dangerous for decision making.B. Sell or process further decisionsi. Joint costs are irrelevant in decisions regarding what to do with a product from the split-off point forward. Therefore, these costs should not be allocated to end products for decision-making purposes.ii.With respect to sell or process further decisions, itis profitable to continue processing a joint product after the split-off point so long as theincremental revenue from such processing exceeds the incremental processing costs incurred after the split-off point .C. Sell or process further decisions – an example i. Assume the facts as shown with respect to Sawmill, Inc.1. Sawmill has two joint products – lumber and sawdust . Selected financial information is shown for each joint product.2. The incremental revenue from further processing of the lumber and sawdust is $130 and $10, respectively.3. The financial advantage (disadvantage) of further processing is $80 for the lumber and ($10) for the sawdust.4. The lumber should be processed further and the sawdust should be sold at the split-off point .D. Activity-based costingand relevant costs i. Activity-based costing can be used to help identify potentially relevant costs for decision-making purposes. However, managers should exercise caution against reading more into this “traceability” than really exists. People often assume that if a cost is traceable to a segment, then the cost is automatically avoidable, which is untrue . Before making a decision, managers must decide which of the potentially relevant costs are actually avoidable.。
加里森管理会计教学课件最新英文精品Garrison16e_PPTch12
The annual cost of insurance is not relevant. It will remain
the same if she drives or takes the train.
However, the cost of gasoline is clearly relevant if she decides to drive. If she takes the train, she would avoid the cost of the
The benefits of having a car in New York and the problems of finding a parking space are
both relevant but are difficult to assign a dollar amount.
Identifying Relevant Costs – Part 5
Key Concept #2
Once you have defined the alternatives, you need to identify the criteria for choosing among them. • Relevant costs and relevant benefits should be considered when making decisions. • Irrelevant costs and irrelevant benefits should be ignored when making decisions.
5 Parking fees at school
360
6 Total average cost
加里森第十四版管理会计课后题答案CH11

Chapter 11Performance Measurement in Decentralized OrganizationsSolutions to Questions11-1In a decentralized organization, decision-making authority isn’t confined to a few top executives; instead, decision-making authority is spread throughout the organization.11-2The benefits of decentralization include: (1) by delegating day-to-day problem solving to lower-level managers, top management can concentrate on bigger issues such as overall strategy; (2) empowering lower-level managers to make decisions puts decision-making authority in the hands of those who tend to have the most detailed and up-to-date information about day-to-day operations; (3) by eliminating layers of decision-making and approvals, organizations can respond more quickly to customers and to changes in the operating environment; (4) granting decision-making authority helps train lower-level managers for higher-level positions; and (5) empowering lower-level managers to make decisions can increase their motivation and job satisfaction.11-3The manager of a cost center has control over cost, but not revenue or the use of investment funds. A profit center manager has control over both cost and revenue. An investment center manager has control over cost and revenue and the use of investment funds.11-4Margin is the ratio of net operating income to total sales. Turnover is the ratio of total sales to average operating assets. The product of the two numbers is the ROI.11-5Residual income is the net operating income an investment center earns above the company’s minimum required rate of return on operating assets.11-6If ROI is used to evaluate performance, a manager of an investment center may reject a profitable investment opportunity whose rate of return exceeds the company’s required rate of return but whose rate of return is less than the investment center’s curren t ROI. The residual income approach overcomes this problem because any project whose rate of return exceeds the company’s minimum required rateof return will result in an increase in residual income.11-7The difference between delivery cycle time and throughput time is the waiting period between when an order is received and when production on the order is started. Throughput time is made up of process time, inspection time, move time, and queue time. Process time is value-added time and inspection time, move time, and queue time are non-value-added time. 11-8An MCE of less than 1 means that the production process includes non-value-added time. An MCE of 0.40, for example, means that 40% of throughput time consists of actual processing, and that the other 60% consists of moving, inspection, and other non-value-added activities.11-9 A company’s balanced scorecard should be derived from and support its strategy. Because different companies have different strategies, their balanced scorecards should be different.11-10The balanced scorecard is constructedto support the company’s strategy, which is atheory about what actions will further the company’s goals. Assuming that the company has financial goals, measures of financial performance must be included in the balanced scorecard as a check on the reality of the theory. If the internal business processes improve, but the financial outcomes do not improve, the theory may be flawed and the strategy should be changed.1. Net operating incomeMargin =Sales$5,400,000= = 30%$18,000,0002. SalesTurnover =Average operating assets$18,000,000= = 0.5$36,000,0003. ROI = Margin ?Turnover= 30% ?0.5 = 15%Average operating assets ...................... £2,200,000 Net operating income ............................Minimum required return:16% × £2,200,000 ............................. 352,000 Residual income.................................... £ 48,0001. Throughput time = Process time + Inspection time + Move time +Queue time= 2.8 days + 0.5 days + 0.7 days + 4.0 days= 8.0 days2. Only process time is value-added time; therefore the manufacturingcycle efficiency (MCE) is:Value-added time 2.8 daysMCE===0.35Throughput time8.0 days3. If the MCE is 35%, then 35% of throughput time was spent in value-added activities, the other 65% was spent in non-value-added activities.4. Delivery cycle time = Wait time + Throughput time= 16.0 days + 8.0 days= 24.0 days5. If all queue time is eliminated, then the throughput time drops to only 4days (0.5 + 2.8 + 0.7). The MCE becomes:Value-added time 2.8 daysMCE===0.70Throughput time 4.0 daysThus, the MCE increases to 70%. This exercise shows quite dramatically how lean production approach can improve operations and reducethroughput time.1. MPC’s previous manufacturing strategy was focused on high-volumeproduction of a limited range of paper grades. The goal of this strategy was to keep the machines running constantly to maximize the number of tons produced. Changeovers were avoided because they loweredequipment utilization. Maximizing tons produced and minimizingchangeovers helped spread the high fixed costs of paper manufacturing across more units of output. The new manufacturing strategy is focused on low-volume production of a wide range of products. The goals of this strategy are to increase the number of paper grades manufactured,decrease changeover times, and increase yields across non-standard grades. While MPC realizes that its new strategy will decrease itsequipment utilization, it will still strive to optimize the utilization of its high fixed cost resources within the confines of flexible production. In an economist’s terms, the old strategy focused on economies of scale while the new strategy focuses on economies of scope.2. Employees focus on improving those measures that are used to evaluatetheir performance. Therefore, strategically-aligned performancemeasures will channel employee effort towards improving those aspects of performance that are most important to obtaining strategic objectives.If a company changes its strategy but continues to evaluate employee performance using measures that do not support the new strategy, it will be motivating its employees to make decisions that promote the old strategy, not the new strategy. And if employees make decisions that promote the new strategy, their performance measures will suffer.Some performance measures that would be appropriate for MPC’s old strategy include: equipment utilization percentage, number of tons of paper produced, and cost per ton produced. These performancemeasures would not support MPC’s new strategy because they would discourage increasing the range of paper grades produced, increasing the number of changeovers performed, and decreasing the batch size produced per run.Exercise 11-4 (continued)3. Students’ answers may differ in some details from this solution.4. The hypotheses underlying the balanced scorecard are indicated by thearrows in the diagram. Reading from the bottom of the balancedscorecard, the hypotheses are:° If the number of employees trained to support the flexibility strategy increases, then the average changeover time will decrease and thenumber of different paper grades produced and the averagemanufacturing yield will increase.° If the average changeover time decreases, then the time to fill anorder will decrease.° If the number of different paper grades produced increases, then the customer satisfaction with breadth of product offerings will increase.° If the average manufacturing yield increases, then the contributionmargin per ton will increase.° If the time to fill an order decreases, then the number of newcustomers acquired, sales, and the contribution margin per ton willincrease.° If the customer satisfaction with breadth of product offeringsincreases, then the number of new customers acquired, sales, andthe contribution margin per ton will increase.° If the number of new customers acquired increases, then sales willincrease.Each of these hypotheses can be questioned. For example, the time to fill an order is a function of additional factors above and beyondchangeover times. Thus, MPC’s average changeover time could decrease while its time to fill an order increases if, for example, the shippingdepartment proves to be incapable of efficiently handling greaterproduct diversity, smaller batch sizes, and more frequent shipments.The fact that each of the hypotheses mentioned above can bequestioned does not invalidate the balanced scorecard. If the scorecard is used correctly, management will be able to identify which, if any, of the hypotheses are invalid and modify the balanced scorecardaccordingly.1. (b) (c)Net Average(a) Operating Operating ROISales Income* Assets (b) ÷ (c)$4,500,000 $290,000 $800,000 36.25%$4,600,000 $300,000 $800,000 37.50%$4,700,000 $310,000 $800,000 38.75%$4,800,000 $320,000 $800,000 40.00%$4,900,000 $330,000 $800,000 41.25%$5,000,000 $340,000 $800,000 42.50%*Sales × Contribution Margin Ratio – Fixed Expenses2. The ROI increases by 1.25% for each $100,000 increase in sales. Thishappens because each $100,000 increase in sales brings in an additional profit of $10,000. When this additional profit is divided by the average operating assets of $800,000, the result is an increase in the company’s ROI of 1.25%.Increase in sales ................................................... $100,000 (a)Contribution margin ratio ....................................... 10% (b)Increase in contribution margin and net operatingincome (a) × (b) ................................................ $10,000 (c)Average operating assets ....................................... $800,000 (d)Increase in return on investment (c) ÷ (d) ............. 1.25%1. Net operating incomeMargin =Sales$800,000= = 10%$8,000,000SalesTurnover =Average operating assets$8,000,000= = 2.5$3,200,000ROI = Margin ?Turnover= 10% ?2.5 = 25%2. Net operating incomeMargin =Sales$800,000(1.00 + 4.00)=$8,000,000(1.00 + 1.50)$4,000,000= = 20%$20,000,000SalesTurnover =Average operating assets$8,000,000 (1.00 + 1.50)=$3,200,000$20,000,000 =$ = 6.253,200,000ROI = Margin ?Turnover = 20% ?6.25 = 125%3. Net operating incomeMargin =Sales$800,000 + $250,000=$8,000,000 + $2,000,000$1,050,000= = 10.5%$10,000,000SalesTurnover =Average operating assets$8,000,000 + $2,000,000=$3,200,000 + $800,000$1 = 0,000,000= 2.5$4,000,000ROI = Margin ?Turnover= 10.5% ?2.5 = 26.25%1. ROI computations:Net operating income Sales ROI = ?Sales Average operating assetsPerth:$630,000$9,000,000? = 7% ?3 = 21% $9,000,000$3,000,000Darwin: $1,800,000$20,000,000? = 9% ?2 = 18% $20,000,000$10,000,0002. Perth DarwinAverage operating assets .................... $3,000,000 $10,000,000Net operating income .........................Minimum required return on averageoperating assets—16% × Averageoperating assets .............................. 480,000 1,600,000Residual income ................................. $150,000 $ 200,0003. No, the Darwin Division is simply larger than the Perth Division and forthis reason one would expect that it would have a greater amount of residual income. Residual income can’t be used to compare theperformance of divisions of different sizes. Larger divisions will almost always look better. In fact, in the case above, Darwin does not appear to be as well managed as Perth. Note from Part (1) that Darwin has only an 18% ROI as compared to 21% for Perth.Exercise 11-8 (15 minutes)Company A Company B Company C Sales ......................................... $400,000 * $750,000 * $600,000 * Net operating income ................. $32,000 $45,000 * $24,000 Average operating assets ........... $160,000 * $250,000 $150,000 * Return on investment (ROI) ....... 20% * 18% * 16% Minimum required rate of return:Percentage ............................. 15% * 20% 12% * Dollar amount ......................... $24,000 $50,000 * $18,000 Residual income ........................ $8,000 $(5,000) $6,000 * *Given.1. Computation of ROI.Division A:$300,000$6,000,000ROI = ? = 5% ?4 = 20% $6,000,000$1,500,000Division B:$900,000$10,000,000ROI = ? = 9% ?2 = 18% $10,000,000$5,000,000Division C:$180,000$8,000,000ROI = ? = 2.25% ?4 = 9% $8,000,000$2,000,0002. Division A Division B Division CAverage operating assets ..... $1,500,000 $5,000,000 $2,000,000 Required rate of return ........ × 15% × 18% × 12% Minimum required return ..... $ 225,000 $ 900,000 $ 240,000 Actual net operating income .Minimum required return(above) ............................ 225,000 900,000 240,000 Residual income .................. $ 75,000 $ 0 $ (60,000)3. a. and b. Division A Division B Division CReturn on investment (ROI) ... 20% 18% 9% Therefore, if the division ispresented with aninvestment opportunityyielding 17%, it probablywould................................. Reject Reject Accept Minimum required return forcomputing residual income .. 15% 18% 12% Therefore, if the division ispresented with aninvestment opportunityyielding 17%, it probablywould................................. Accept Reject Accept If performance is being measured by ROI, both Division A and Division B probably would reject the 17% investment opportunity. The reason is that these companies are presently earning a return greater than 17%;thus, the new investment would reduce the overall rate of return and place the divisional managers in a less favorable light. Division Cprobably would accept the 17% investment opportunity, because itsacceptance would i ncrease the Division’s overall rate of return.If performance is being measured by residual income, both Division A and Division C probably would accept the 17% investment opportunity.The 17% rate of return promised by the new investment is greater than their required rates of return of 15% and 12%, respectively, and would therefore add to the total amount of their residual income. Division B would reject the opportunity, because the 17% return on the newinvestment is less than B’s 18% required rate of return.Exercise 11-10 (15 minutes)1. ROI computations:Net operating income Sales ROI = ?Sales Average operating assetsEastern Division:$90,000$1,000,000? = 9% ?2 = 18% $1,000,000$500,000Western Division:$105,000$1,750,000? = 6% ?3.5 = 21% $1,750,000$500,0002. The manager of the Western Division seems to be doing the better job.Although her margin is three percentage points lower than the margin of the Eastern Division, her turnover is higher (a turnover of 3.5, ascompared to a turnover of two for the Eastern Division). The greater turnover more than offsets the lower margin, resulting in a 21% ROI, as compared to an 18% ROI for the other division.Notice that if you look at margin alone, then the Eastern Divisionappears to be the strongest division. This fact underscores theimportance of looking at turnover as well as at margin in evaluatingperformance in an investment center.Exercise 11-11 (45 minutes)1. Students’ answers may differ in some details from this solution.2. The hypotheses underlying the balanced scorecard are indicated by thearrows in the diagram. Reading from the bottom of the balancedscorecard, the hypotheses are:° If the amount of compensation paid above the industry averageincreases, then the percentage of job offers accepted and the level of employee morale will increase.° If the average number of years to be promoted decreases, then thepercentage of job offers accepted and the level of employee moralewill increase.° If the percentage of job offers accepted increases, then the ratio ofbillable hours to total hours should increase while the averagenumber of errors per tax return and the average time needed toprepare a return should decrease.° If employee morale increases, then the ratio of billable hours to total hours should increase while the average number of errors per taxreturn and the average time needed to prepare a return shoulddecrease.° If employee morale increases, then the customer satisfaction withservice quality should increase.° If the ratio of billable hours to total hours increases, then the revenue per employee should increase.° If the average number of errors per tax return decreases, then thecustomer satisfaction with effectiveness should increase.° If the average time needed to prepare a return decreases, then thecustomer satisfaction with efficiency should increase.° If the customer satisfaction with effectiveness, efficiency, and service quality increases, then the number of new customers acquired should increase.° If the number of new customers acquired increases, then salesshould increase.° If revenue per employee and sales increase, then the profit marginshould increase.Each of these hypotheses can be questioned. For example, Ariel’scustomers may define effectiveness as minimizing their tax liabilitywhich is not necessarily the same as minimizing the number of errors ina tax return. If some of Ariel’s customers became aware that Arieloverlooked legal tax minimizing opportunities, it is likely that the“customer satisfaction with effectiveness” measure would decline. This decline would probably puzzle Ariel because, although the firm prepared what it believed to be error-free returns, it overlooked opportunities to minimize customers’ taxes. In this example, Ariel’s internal businessprocess measure of the average number of errors per tax return does not fully capture the factors that drive the customer satisfaction. The fact that each of the hypotheses mentioned above can be questioned does not invalidate the balanced scorecard. If the scorecard is usedcorrectly, management will be able to identify which, if any, of thehypotheses are invalid and then modify the balanced scorecardaccordingly.3. The performance measure “total dollar amount of tax refundsgenerated” would motivate Ariel’s employees to aggressively search for tax minimization opportunities for its clients. However, employees may be too aggressive and recommend questionable or illegal tax practices to clients. This undesirable behavior could generate unfavorablepublicity and lead to major problems for the company as well as itscustomers. Overall, it would probably be unwise to use this performance measure in Ariel’s scorecard.However, if Ariel wanted to create a scorecard measure to capture this aspect of its client service responsibilities, it may make sense to focus the performance measure on its training process. Properly trainedemployees are more likely to recognize viable tax minimizationopportunities.4. E ach office’s individual per formance should be based on the scorecardmeasures only if the measures are controllable by those employed at the branch offices. In other words, it would not make sense to attempt to hold branch office managers responsible for measures such as the percent of job offers accepted or the amount of compensation paid above industry average. Recruiting and compensation decisions are not typically made at the branch offices. On the other hand, it would make sense to measure the branch offices with respect to internal business process, customer, and financial performance. Gathering this type of data would be useful for evaluating the performance of employees at each office.1. Net operating incomeMargin =Sales$16,000= = 2%$800,000SalesTurnover =Average operating assets$800,000= = 8$100,000ROI = Margin ?Turnover= 2% ?8 = 16%2. Net operating incomeMargin =Sales$16,000 + $6,000=$800,000 + $80,000$22,000= = 2.5%$880,000SalesTurnover =Average operating assets$800,000 + $80,000=$100,000$880,000= = 8.8$100,000ROI = Margin ?Turnover= 2.5% ?8.8 = 22%3. Net operating incomeMargin =Sales$16,000 + $3,200=$800,000$19,200= = 2.4%$800,000SalesTurnover =Average operating assets$800,000= = 8$100,000ROI = Margin ?Turnover= 2.4% ?8 = 19.2%4. Net operating incomeMargin =Sales$16,000= = 2%$800,000SalesTurnover =Average operating assets$800,000=$100,000 - $20,000$800,000= = 10$80,000ROI = Margin ?Turnover= 2% ?10 = 20%DivisionFab Consulting IT Sales ....................................... $800,000 * $650,000 $500,000 Net operating income ............... $72,000 * $26,000 $40,000 * Average operating assets ......... $400,000 $130,000 * $200,000 Margin .................................... 9% 4% * 8% * Turnover ................................. 2.0 5.0 * 2.5 Return on investment (ROI) ..... 18% * 20% 20% * *Given.Note that the Consulting and IT Divisions apparently have different strategies to obtain the same 20% return. The Consulting Division has a low margin and a high turnover, whereas the IT Division has just the opposite.Problem 11-14 (30 minutes)1. Present New Line Total(1) Sales ......................... $21,000,000 $9,000,000 $30,000,000(2) Net operating income . $1,680,000 $630,000 * $2,310,000(3) Operating assets ........ $5,250,000 $3,000,000 $8,250,000(4) Margin (2) ÷ (1) ......... 8.0% 7.0% 7.7%(5) Turnover (1) ÷ (3) ...... 4.00 3.00 3.64(6) ROI (4) × (5) ............. 32% 21% 28%* Sales ............................................................. $9,000,000Variable expenses (65% × $9,000,000) .......... 5,850,000Contribution margin ....................................... 3,150,000Fixed expenses .............................................. 2,520,000Net operating income ..................................... $ 630,0002. Fred Halloway will be inclined to reject the new product line becauseaccepting it would reduce his division’s overall rate of return.3. The new product line promises an ROI of 21%, whereas the company’soverall ROI last year was only 18%. Thus, adding the new line would increase the company’s overall ROI.4. a. Present New Line TotalOperating assets ..................... $5,250,000 $3,000,000 $8,250,000 Minimum required return ......... × 15% × 15% × 15% Minimum net operating income $787,500 $450,000 $1,237,500 Actual net operating income ....Minimum net operating income(above) ................................ 787,500 450,000 1,237,500 Residual income ...................... $ 892,500 $ 180,000 $1,072,500b. Under the residual income approach, Fred Halloway would be inclinedto accept the new product line because adding the product line would increase the total amount of his division’s residual income, as shown above.1. Breaking the ROI computation into two separate elements helps themanager to see important relationships that might remain hidden. First, the importance of turnover of assets as a key element to overallprofitability is emphasized. Prior to use of the ROI formula, managers tended to allow operating assets to swell to excessive levels. Second, the importance of sales volume in profit computations is stressed and explicitly recognized. Third, breaking the ROI computation into margin and turnover elements stresses the possibility of trading one off for the other in attempts to improve the overall profit picture. That is, acompany may shave its margins slightly hoping for a large enoughincrease in turnover to increase the overall rate of return. Fourth, itpermits a manager to reduce important profitability elements to ratio form, which enhances comparisons between units (divisions, etc.) of the organization.2. Companies in the Same IndustryA B CSales .................................. $4,000,000 * $1,500,000 * $6,000,000 Net operating income .......... $560,000 * $210,000 * $210,000 Average operating assets ..... $2,000,000 * $3,000,000 $3,000,000 * Margin ................................ 14% 14% 3.5% * Turnover ............................. 2.0 0.5 2.0 * Return on investment (ROI) . 28% 7% * 7% *Given.NAA Report No. 35 states (p. 35):“Introducing sales to measure level of operations helps to disclosespecific areas for more intensive investigation. Company B does as well as Company A in terms of profit margin, for both companies earn 14% on sales. But Company B has a much lower turnover of capital thandoes Company A. Whereas a dollar of investment in Company Asupports two dollars in sales each period, a dollar investment inCompany B supports only 50 cents in sales each period. This suggests that the analyst should look carefully at Company B’s investment. Is the company keeping an inventory larger than necessary for its salesvolume? Are receivables being collected promptly? Or did Company A acquire its fixed assets at a price level which was much lower than that at which Company B purchased its plant?”Thus, by including sales specifically in ROI computations the manager is able to discover possible problems, as well as reasons underlying a strong or a weak performance. Looking at Company A compared to Company C, notice that C’s turnover is the same as A’s, but C’s margin on sales is much lower. Why would C have such a low margin? Is it due to inefficiency, is it due to geographical location (thereby requiring higher salaries or transportation charges), is it due to excessive materials costs, or is it due to still other factors? ROI computations raise questions such as these, which form the basis for managerial action. To summarize, in order to bring B’s ROI into line with A’s, it seems obvious that B’s management will have to concentrate its efforts on increasing turnover, either by increasing sales or by reducing assets. It seems unlikely that B can appreciably increase its ROI by improving its margin on sales. On the other hand, C’s management should concentrate its efforts on the margin element by trying to pare down its operating expenses.Problem 11-16 (30 minutes)1. a., b., and c.Month1 2 3 4Throughput time in days:Process time .................................. 0.6 0.5 0.5 0.4Inspection time .............................. 0.7 0.7 0.4 0.3Move time ..................................... 0.5 0.5 0.4 0.5Queue time ................................... 3.6 3.6 2.6 1.7Total throughput time ..................... 5.4 5.3 3.9 2.9Manufacturing cycle efficiency (MCE):Process time ÷ Throughput time ..... 11.1% 9.4% 12.8% 13.8% Delivery cycle time in days:Wait time ...................................... 9.6 8.7 5.3 4.7Total throughput time ..................... 5.4 5.3 3.9 2.9Total delivery cycle time ................. 15.0 14.0 9.2 7.62. The general trend is favorable in all of the performance measures exceptfor total sales. On-time delivery is up, process time is down, inspection time is down, move time is basically unchanged, queue time is down, manufacturing cycle efficiency is up, and the delivery cycle time is down.Even though the company has improved its operations, it has not yet increased its sales. This may have happened because managementattention has been focused on the factory—working to improveoperations. However, it may be time now to exploit these improvements to go after more sales—perhaps by increased product promotion and better marketing strategies. It will ultimately be necessary to increase sales so as to translate the operational improvements into more profits.。
加里森管理会计讲义笔记英文版最新精品GNB_16e_CH06_LectureNotes
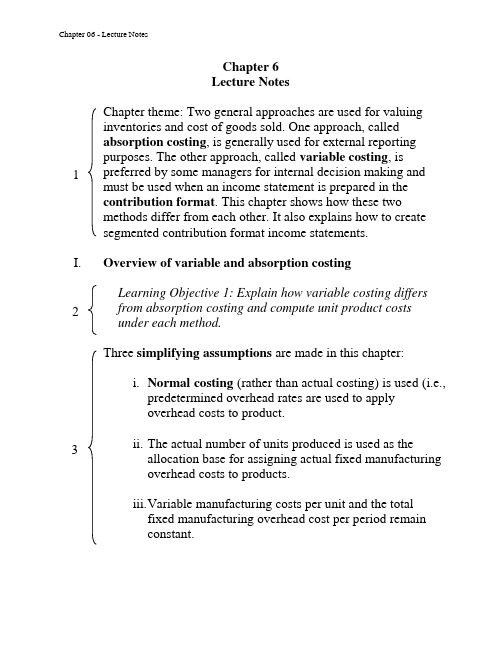
Chapter 6Lecture NotesChapter theme: Two general approaches are used for valuing inventories and cost of goods sold. One approach, called absorption costing , is generally used for external reporting purposes. The other approach, called variable costing , is preferred by some managers for internal decision making and must be used when an income statement is prepared in the contribution format . This chapter shows how these two methods differ from each other. It also explains how to create segmented contribution format income statements.I. Overview of variable and absorption costingLearning Objective 1: Explain how variable costing differs from absorption costing and compute unit product costsunder each method.Three simplifying assumptions are made in this chapter:i. Normal costing (rather than actual costing) is used (i.e., predetermined overhead rates are used to applyoverhead costs to product.ii. The actual number of units produced is used as theallocation base for assigning actual fixed manufacturingoverhead costs to products.iii. V ariable manufacturing costs per unit and the totalfixed manufacturing overhead cost per period remainconstant.2 3B. Variable costing treats only those costs of production that vary with output as product costs. This approach dovetails with the contribution approach income statement andsupports CVP analysis because of its emphasis onseparating variable and fixed costs.i. The cost of a unit of product consists of directmaterials, direct labor, and variable overhead .Helpful Hint: For simplicity, nearly all examples, exhibits, problems, and exercises in this chapter treat direct labor as a variable cost. However, students should be reminded that labor is essentially a fixed cost in some companies. This is a growing phenomenon as pointed out in earlier chapters.Under variable costing, direct labor would not be included in product costs when it is a fixed cost. This point is reinforced in the discussion on theory of constraints at the end of the chapter.ii. Fixed manufacturing overhead and both variable andfixed selling and administrative expenses are treated asperiod costs and deducted from revenue as incurred.Helpful Hint: Emphasize that the only difference between variable and absorption costing is in how the two methods treat fixed manufacturing overhead costs. Also, emphasize that under both methods, selling and administrative costs are period costs and are not product costs.C. Absorption costing treats all costs of production as product costs, regardless of whether they are variable or fixed. Since no distinction is made between variable and fixed costs,absorption costing is not well suited for CVP computations.i. The cost of a unit of product consists of directmaterials, direct labor, and both variable and fixedoverhead .ii. Variable and fixed selling and administrative expensesare treated as period costs and are deducted fromrevenue as incurred.Quick Check – absorption vs. variable costingII. Harvey Company —an exampleA. Unit cost computationsi. Assume Harvey Company produces a single product with available information as shown.ii. The unit product costs under absorption and variablecosting would be $16 and $10, respectively.1. Under absorption costing, all production costs ,variable and fixed, are included when determiningunit product cost.2. Under variable costing, only the variableproduction costs are included in product costs.Helpful Hint: Before beginning the forthcoming incomecomparisons, remind students of the relationship between ending inventory and net operating income. Higher ending inventory results in higher net operating income since costs of goods available for sale less ending inventory equals cost of goods sold. Therefore, a higher ending inventory results in a lower expense (cost of goods sold) deducted to arrive at net operating income.Learning Objective 2: Prepare income statements using both variable and absorption costing.B. Income comparison of variable and absorption costingi. Harvey Company —additional assumptions.1.20,000 units were sold during the year. 2.The selling price per unit is$30. 3. There isno beginning inventory. ii. Variable costing1. The unit product cost is $10.2. All $150,000 of fixed manufacturing cost is expensed in the current period.3. The net operating income is $90,000. iii. Absorption costing1. The unit product cost is $16.2. The fixed manufacturing overhead cost deferred in inventory is $30,000 (= 5,000 units × $6 per unit).3. The net operating income is $120,000.Helpful Hint: Explain that under absorption costing, therecognition of fixed costs as an expense is really a timing issue. When the items are sold, the fixed costs will bereflected on the income statement as part of cost of goods sold.Learning objective 3: Reconcile variable costing and absorption costing net operating incomes and explain whythe two amounts differ.iv. Comparing the two methods1. Under absorption costing, $120,000 of fixedmanufacturing overhead is included in cost of goodssold and $30,000 is deferred in ending inventory asan asset on the balance sheet.2. Under variable costing, the entire $150,000 of fixedmanufacturing overhead is treated as a periodexpense.a. The variable costing ending inventory is $30,000less than absorption costing , thus explaining thedifference in net operating income between thetwo methods.3. The difference in net operating income between thetwo methods ($30,000) can also be reconciled bymultiplying the number of units in ending inventory(5,000 units ) by the fixed manufacturing overheadper unit ($6) that is deferred in ending inventoryunder absorption costing.C. Extended comparisons of income datai. Harvey Company —additional assumptions/facts1. 30,000 units were sold in year2. 2. The selling price per unit, variable costs per unit,total fixed costs, and number of units producedremain unchanged .3. 5,000 units are in beginning inventory.ii. Unit cost computations1.Since the variable costs per unit, total fixed costs, and the number of units produced remained unchanged, the unit cost computations also remain unchanged. iii. Variable costing 1. The unit product cost is $10. 2. All $150,000 of fixed manufacturing overhead cost is expensed in the current period. 3. The net operating income is $260,000. iv. Absorption costing 1. The unit product cost is $16. 2. The fixed manufacturing overhead cost released from inventory is $30,000 (= 5,000 units × $6 per unit). 3. The net operating income is $230,000.v. Comparing the two methods 1. The difference in net operating income between the two methods ($30,000) can be reconciled by multiplying the number of units in beginning inventory (5,000 units ) by the fixed manufacturing overhead per unit ($6) that is released from beginning inventory under absorption costing.2. Across the two-year time frame, both methods reported the same total net operating income ($350,000). This is because over an extended period of time sales cannot exceed production, nor canproduction much exceed sales. The shorter the timeperiod, the more the net operating income figureswill tend to differ.D. Summary of key insightsi.Whenunits produced equals units sold, the twomethods report the same net operating income .ii. When units produced are greater than units sold , asin year 1 for Harvey, absorption net operating incomeis greater than variable costing net operating income . iii. When units produced are less than units sold , as inyear 2 for Harvey, absorption costing net operatingincome is less than variable costing net operatingincome .III. Advantages of variable costing and the contribution approachA. Enabling CVP analysisi. Variable costing categorizes costs as fixed and variable so it is much easier to use this income statement format for CVP analysis.ii.Absorption costing assigns per unit fixed manufacturing overhead costs to production. This can potentiallyproduce positive net operating income even whenthe number of units sold is less than the breakevenpoint.B. Explaining changes in net operating incomei.Variable costingnet operating income is only affectedby changes in unit sales. It is not affected by thenumber of units produced. As a general rule, when salesgo up net operating income goes up and vice versa.ii.Absorption costing net operating income is influenced by changes in unit sales and units of production. Netoperating income can be increased simply by producingmore units even if those units are not sold.D.Supporting decision makingi.Variable costing correctly identifies the additionalvariable costs incurred to make one more unit. Italso emphasizes the impact of fixed costs on profits.ii.Absorption costing gives the impression that fixed manufacturing overhead is variable with respect tothe number of units produced, but it is not. This canlead to inappropriate pricing decisions and productdiscontinuation decisions.IV. Segmented income statements and the contribution approach Learning Objective 4: Prepare a segmented incomestatement that differentiates traceable fixed costs fromcommon fixed costs and use it to make decisions.A.Key concepts/definitionsi. A segment is a part or activity of an organizationabout which managers would like cost, revenue, orprofit data.ii.Examples of segments include divisions of acompany, sales territories, individual stores, servicecenters, manufacturing plants, marketingdepartments, individual customers, and product lines.iii.There are two keys to building segmented income statements.1.First, a contribution format should be usedbecause it separates fixed from variable costsand it enables the calculation of a contributionmargin.a.The contribution margin is especially useful indecisions involving temporary uses ofcapacity such as special orders.2.Second, traceable fixed costs should be separatedfrom common fixed costs to enable thecalculation of a segment margin. Furtherclarification of these terms is as follows:a. A traceable fixed cost of a segment is a fixed cost that is incurred because of the existence of the segment. If the segment were eliminated, the fixed cost would disappear. Examples of traceable fixed costs include: (1). The salary of the Fritos product manager at PepsiCo is a traceable fixed cost of the Fritos business segment of PepsiCo. (2). The maintenance cost for the building in which Boeing 747s are assembled is a traceable fixed cost of the 747 business segment of Boeing.b. A common fixed cost is a fixed cost that supports the operations of more than one segment, but is not traceable in whole or in part to any one segment . Examples of common fixed costs include: (1). The salary of the CEO of General Motors is a common fixed cost of the various divisions of General Motors. (2). The cost of heating a Safeway or Kroger grocery store is a common fixed cost of the various departments – groceries, produce, bakery, etc. c. It is important to realize that the traceable fixed costs of one segment may be a common fixed cost of another segment . For example: (1). The landing fee paid to land an airplane atan airport is traceable to a particular flight, but it is not traceable to first-class, business-class, and economy-class passengers.Helpful Hint: In practice, a great deal of disagreement exists about what costs are traceable and what costs are common. Some people claim that except for direct materials, virtually all costs are common fixed costs that cannot be traced to products. Others assert that all costs are traceable toproducts; there are no common costs. The truth probably lies somewhere in the middle – many costs can be traced to products but not all costs.d. A segment margin is computed by subtracting the traceable fixed costs of a segment from itscontribution margin.(1). The segment margin is a valuable tool forassessing the long-run profitability of asegment.(2). Allocating common costs to segmentsreduces the value of the segment marginas a guide to long-run segmentprofitability.Helpful Hint: Explain that a segment should notautomatically be eliminated if its segment margin is negative. If a company that produces hair-styling productsdiscontinues its styling gel, sales on its shampoo and conditioner might fall due to the unavailability of the eliminated product.B. Segmented income statements – an examplei.Assume that Webber, Inc. has two divisions –the Computer Division and the Television Division.1. The contribution format income statement for the Television Division is as shown. Notice:a. Cost of goods sold consists of variable manufacturing costs.b. Fixed and variable costs are listed in separate sections .c. Contribution margin is computed by taking sales minus variable costs.d. The divisional segment margin represents the Television Division’s contribution to overall company profits. 2. The Television Division’s results can be rolled into Webber, Inc.’s overall results as shown. Notice: a. The results of the Television and Computer Divisions sum to the results shown for the whole company. b. The common costs for the company as a whole ($25,000) are not allocated to the divisions . 3. The Television Division’s results can also be broken down into smaller segments. This enables us to see how traceable fixed costs of the Television Division can become common costs of smaller segments . a. Assume that the Television Division can be broken down into two major product lines – Regular and Big Screen . b. Assume that the segment margins for these two product lines are as shown. c. Of the $90,000 of fixed costs that were previously traceable to the Television Division, $80,000 (= $45,000 + $35,000) is traceable to the two product lines and $10,000 is a common cost.C. Segmented income statements —decision making and break-even analysisi.To illustrate how the Television Division’s results can be used fordecision making, assume Webber believes that if the Television Division spends $5,000 additionaldollars on advertising it will increase sales of Regular and Big Screen televisions by 5%. Webber can compute the profit impact of this course of action as follows:1. The Regular product line contribution margin would increase by $5,250.2. The Big Screen product line contribution margin would increase by $2,250.3. The Television Division’s segment margin would increase by $2,500. Learning Objective 5: Compute companywide and segment break-even points for a company with traceable fixed costs. ii. To demonstrate how to calculate companywide and segmented break-even points , let’s refer back to the companywide income statement segmented into the Television and Computer Divisions. 1. The companywide break-even point is computed by dividing the sum of the company’s traceable fixed costs and common fixed costs by the company’s overall contribution margin ratio . a. This equation can be used to compute Webber’s companywide break-even point of $361,111.2. A business segment’s break-even point is computedby dividing its traceable fixed costs by itscontribution margin ratio.a. Using this equation, the break-even point for theTelevision Division is $180,000.b. The break-even point for the Computer Divisionis $133,333.3. Notice that the companywide common fixed costsare excluded from the segment break-evencalculations. This occurs because the common fixed costs are not traceable to segments and they are not influenced by segment-level decisions.Segmented income statements—common mistakesA.Omission of costsi.The costs assigned to a segment should include all thecosts attributable to that segment from the company’sentire value chain as discussed in Chapter 12.1.Since only manufacturing costs are included inproduct costs under absorption costing, thosecompanies that choose to use absorption costing forsegment reporting purposes will omit from theirprofitability analysis all “upstream” and“downstream” costs.a.“Upstream” costs include research anddevelopment and product design costs.b.“Downstream” costs include marketing,distribution, and customer service costs.c. Although these “upstream” and “downstream” costs are nonmanufacturing costs, they are just as essential to determining product profitability asare manufacturing costs. Omitting them fromprofitability analysis will result in theundercosting of products.Helpful Hint: An example of a company with a very high amount of upstream and downstream costs is apharmaceutical company such as Merck. A great deal of its costs are comprised of research and development and marketing.B. Inappropriate methods for assigning traceable costs to segmentsi.Failure to trace costs directly1. Costs that can be traced directly to specific segments of a company should not be allocated to othersegments . Rather, such costs should be chargeddirectly to the responsible segment. For example: a. The rent for a branch office of an insurancecompany should be charged directly against thebranch office rather than included in acompanywide overhead pool and then spreadthroughout the company.ii. Inappropriate allocation base1. Some companies allocate costs to segments using arbitrary bases . Costs should be allocated tosegments for internal decision making purposes only when the allocation base actually drives the cost being allocated. For example:a. Sales are frequently used to allocate selling and administrative expenses to segments. This should only be done if sales drive these expenses.C. Arbitrarily dividing common costs among segments i. Common costs should not be arbitrarily allocated to segments based on the rational e that “someone has to cover the common costs” for two reasons:1. First, this practice may make a profitable business segment appear to be unprofitable. If the segment is eliminated the revenue lost may exceed the real traceable costs that are avoided.2. Second, allocating common fixed costs forcesmanagers to be held accountable for costs that they cannot control.Quick Check – common costsV. Income statements—an external reporting perspectiveA. Companywide income statementsi.Practically speaking,absorption costing is requiredfor external reports in the United States. IFRS alsorequire absorption costing for external reports.ii.Probably because of the cost of maintaining twoseparate costing systems, most companies useabsorption costing for their external and internal reports.iii.W ith all of the advantages of the contribution approach, one may wonder why the absorption approach is used atall. Perhaps the biggest reason is because:1.Advocates of absorption costing argue that it bettermatches costs with revenues. They contend thatfixed manufacturing costs are just as essential tomanufacturing products as are the variable costs.2.Advocates of variable costing view fixedmanufacturing costs as capacity costs. They arguethat fixed manufacturing costs would be incurredeven if no units were produced.B. Segmented financial informationi. U.S. GAAP and IFRS require publicly-tradedcompanies to include segmented financial data intheir annual reports. These rulings have implications forinternal segment reporting because:.1. They mandate that companies must prepare external Array segmented reports using the same methods that theyuse for internal segmented reports. This requirement motivates managers to avoid using the contribution approach for internal reporting purposes because if they did they would be required to:a. Share this sensitive data with the public.b. Reconcile these reports with applicable rules forconsolidated reporting purposes.。
加里森管理会计教学课件最新英文精品Garrison16e_PPTch13A

The Mathematics of Interest – Example – Part 2
Assume a bank pays 8% interest on a $100 deposit made today. How much will
the $100 be worth in one year?
Present Value – Example – Part 4
$100 × 0.797 = $79.72 present value
Periods 1 2 3 4 5
10% 0.909 0.826 0.751 0.683 0.621
Rate 12% 0.893 0.797 0.712 0.636 0.567
of this stream of cash payments when the discount rate is 12%?
Present Value of a Series of Cash Flows – Example – Part 2
We could solve the problem like this . . .
c. $90.90
d. $51.90
Present Value of a Series of Cash Flows
An investment that involves a series of identical cash flows at the end of each year is called
Fn = P(1 + r)n F1 = $100(1 + .08)1 F1 = $108.00
Compound Interest – Example – Part 1
What if the $108 was left in the bank for a second year? How much would the
加里森管理会计讲义笔记英文版最新精品GNB_16e_CH05_LectureNotes
Chapter 5 Lecture NotesChapter theme: Cost-volume-profit (CVP) analysis helps managers understand the interrelationships among cost,volume, and profit by focusing their attention on theinteractions among the prices of products, volume ofactivity, per unit variable costs, total fixed costs, andmix of products sold. It is a vital tool used in manybusiness decisions such as deciding what products andservices to offer, what prices to charge, what marketingstrategy to use, and what cost structure to maintain.I.Assumptions of CVP analysisA.Three key assumptions underlie CVP analysis:i.Selling price is constant.ii.Costs are linear and can be accurately divided into variable and fixed components. The variable costsare constant per unit, and the fixed costs areconstant in total over the entire relevant range.iii.In multiproduct companies, the mix of products sold remains constant.Helpful Hint: Point out that nothing is sacred aboutthese assumptions. When violations of theseassumptions are significant, managers can and domodify the basic CVP model. Spreadsheets allowpractical models that incorporate more realisticassumptions. For example, nonlinear cost functionswith step fixed costs can be modeled using “If…Then”functions.II. The basics of cost-volume-profit (CVP) analysi sLearning Objective 1: Explain how changes in activity affect contribution margin and net operating income.A. The contribution format income statement is helpful to managers in judging the impact on profits of changes in selling price, cost, or volume. For example, let's look at a hypothetical contribution format income statement for Racing Bicycle Company (RBC). Notice:i. The emphasis is on cost behavior . Variable expenses are separate from fixed expenses. ii. The contribution margin is defined as the amount remaining from sales revenue after variableexpenses have been deducted.iii. Contribution margin is used first to cover fixed expenses . Any remaining contribution margincontributes to net operating income .iv. Sales, variable expenses, and contribution margincan also be expressed on a per unit basis . Thus:1. For each additional unit RBC sells, $200 more in contribution margin will help to cover fixedexpenses and provide a profit.2. Notice, each month RBC must generate at least $80,000 in total contribution margin to break-even (which is the level of sales at whichprofit is zero).3. Therefore, if RBC sells 400 units a month, itwill be operating at the break-even point .4.If RBC sells one more bike (401 bikes), netoperating income will increase by $200.v.You do not need to prepare an income statement to estimate profits at a particular sales volume. Simply multiply the number of units sold above break-evenby the contribution margin per unit.1.For example, if RBC sells 430 bikes, its netoperating income will be $6,000.B.CVP relationships in equation form (for those whoprefer an algebraic approach to solving problems in the chapter)i.The contribution format income statement can beexpressed in equation form as shown on this slide.1.This equation can be used to show the profitRBC earns if it sells 401 bikes. Notice, theanswer of $200 mirrors our earlier solution.ii.When a company has only one product we can further refine this equation as shown on this slide.1.This equation can also be used to show the$200 profit RBC earns if it sells 401 bikes.iii.The profit equation can also be expressed in terms of unit contribution margin as shown on this slide.1.This equation can also be used to computeRBC’s $200 profit if it sells 401 bikes.Learning Objective 2: Prepare and interpret a cost-volume-profit (CVP) graph and a profit graph.C. CVP relationships in graphic formi. The relationships among revenue, cost, profit, and volume can be expressed graphically by preparing a cost-volume-profit (CVP) graph. To illustrate, we will use contribution format income statements for RBC at 0, 200, 400, and 600 units sold. Helpful Hint: Mention to students that the graphic form of CVP analysis may be preferable to them if they are uncomfortable with algebraic equations.ii. In a CVP graph, unit volume is represented on the horizontal (X) axis and dollars on the vertical (Y) axis . A CVP graph can be prepared in three steps . 1. Draw a line parallel to the volume axis to represent total fixed expenses. 2. Choose some sales volume (e.g., 400 units ) and plot the point representing total expenses (e.g., fixed and variable) at that sales volume. Draw a line through the data point back to where the fixed expenses line intersects the dollar axis. 3. Choose some sales volume (e.g., 400 units ) and plot the point representing total sales dollars at the chosen activity level. Draw a line through the data point back to the origin.iii. Interpreting the CVP graph .1. The break-even point is where the total revenue and total expense lines intersect.2. The profit or loss at any given sales level is measured by the vertical distance between thetotal revenue and the total expense lines.Helpful Hint: Ask students what the CVP graph would look like for a public agency like a county hospital receiving a fixed budget each year and collecting fees less than its variable costs. It would look like this:This is the reverse of the usual situation. If such an organization has volume above the break-even point, it will experience financial difficulties.iv. An even simpler form of the CVP graph is calledthe profit graph . The profit graph is based on the equation shown on this slide.1. To plot the graph, compute the profit at two different sales volumes, plot the points, andthen connect them with a straight line. This slide contains the profit graph for RBC. Notice: a. The sales volumes plotted on this graph are 300 and 500 bikes.b. The breakeven point is 400 bikes.D. Contribution margin ratio (CM ratio) and the variable expense ratioLearning Objective 3: Use the contribution margin ratio (CM ratio) to compute changes in contribution margin and net operating income resulting from changes in sales volume. i. The CM ratio is calculated by dividing the total contribution margin by total sales.1. For RBC, the CM ratio is 40%. Thus, each $1.00 increase in sales results in a total contribution margin increase of 40¢. ii. The CM ratio can also be calculated by dividing the contribution margin per unit by the selling price per unit .1. For RBC, the CM ratio is 40%.iii. Similarly, variable expenses as a percentage of sales is referred to as the variable expense ratio.1. For RBC, the variable expense ratio is 60%.iv.The contribution margin ratio and the variableexpense ratio can be mathematically related to one another: CM ratio = 1 – Variable expense ratio.v. If RBC increases sales from 400 to 500 bikes, the increase in contribution margin ($20,000) can be calculated by multiplying the increase in sales ($50,000) by the CM ratio (40%).Quick Check – contribution margin ratiovi. The relation between profit and the CM ratio canalso be expressed in terms of the equation shown on this slide. 1. For example, we can use this equation tocalculate RBC’s profit of $20,000 at a volume of 500 bikes .E. Applications of CVP concepts Learning Objective 4: Show the effects on net operating income of changes in variable costs, fixed costs, selling price, and volume.Helpful Hint: The five examples that are forthcoming should indicate to students the range of uses of CVP analysis. In addition to assisting management in determining the level of sales that is needed to break-even or generate a certain dollar amount of profit, the examples illustrate how the results of alternative decisions can be quickly determined.i. Change in fixed cost and sales volume.1. What is the profit impact if RBC can increase unit sales from 500 to 540 by increasing the monthly advertising budget by $10,000? a. Preparing a contribution format income statement reveals a $2,000 decrease in profits. b. A shortcut solution using incremental analysis also reveals a $2,000 decrease in profits.ii. Change in variable costs and salesvolume .1. What is the profit impact if RBC can usehigher quality raw materials, thus increasing variable costs per unit by $10, to generate an increase in unit sales from 500 to 580? a. The contribution format income statement reveals a $10,200 increase in profits.iii. Change in fixed cost, sales price, and sales volume .1. What is the profit impact if RBC: (1) cuts itsselling price $20 per unit, (2) increases its advertising budget by $15,000 per month, and (3) increases unit sales from 500 to 650 units per month? a. The contribution format income statementreveals a $2,000 increase in profits.iv.Change in variable cost, fixed cost, and salesvolume. 1. What is the profit impact if RBC: (1) pays a $15 sales commission per bike sold instead of paying salespersons flat salaries that currently total $6,000 per month, and (2) increases unit sales from 500 to 575 bikes? a. The contribution format income statement reveals a $12,375 increase in profits. v. Change in regular sales price. 1. If RBC has an opportunity to sell 150 bikes to a wholesaler without disturbing sales to other customers or fixed expenses, what price should it quote to the wholesaler if it wants to increase monthly profits by $3,000? a. The price quote should be $320 per bike .III. Break-even analysisLearning Objective 5: Determine the break-even point.A.The equation and formula methods can be used to determine the unit sales and dollar sales needed toachieve a target profit of zero. For example, let’s revisit the information from RBC:i.Suppose RBC wants to know how many bikes must be sold to break-even (i.e. earn a target profit of $0). The equation shown on this slide can be used toanswer this question.1. The equation method reveals that 400 bikes must be sold to breakeven.2. The formula method can also be used to determine that 400 bikes must be sold to breakeven. ii. Suppose RBC wants to compute the sales dollars required to break-even (i.e. earn a target profit of $0). The equation shown here can be used to answer this question. 1. The equation method reveals that sales of $200,000 will enable the company to break-even. 2. The formula method can also be used to determine that sales of $200,000 will enable the company to break-even. Quick Check – break-even calculationsB.Target profit analysisLearning Objective 6: Determine the level of sales needed to achieve a desired target profit.i.Intarget profit analysis, we estimate what salesvolume is needed to achieve a specific target profit.We can compute the number of unitsthat must besold to attain a target profit using either theequation method or theformula method.1.The equation method is summarized on thisslide. Our goal is to solve for the unknown “Q”which represents the quantity of units that must be sold to attain the target profit.2.For example: Suppose RBC wants to knowhow many bikes must be sold to earn a targetprofit of $100,000.a.The equation method can be used todetermine that 900 bikes must be sold toearn the desired target profit.b.The formula method is summarized on thisslide. It can also be used to compute thequantity of units that must be sold to attain atarget profit.3.For example:Suppose RBC wants to knowhow many bikes must be sold to earn a targetprofit of $100,000.a.The formula method can be used todetermine that 900 bikes must be sold toearn the desired target profit.ii. We can also compute the target profit in terms of sales dollars using either the equation method or the formula method .1. The equation method is summarized on this slide . Our goal is to solve for the unknown“Sales,” which represents the dollar amount of sales that must be sold to attain the target profit.2. For example: Suppose RBC wants to compute the sales dollars required to earn a targetprofit of $100,000.a. The equation method can be used todetermine that sales must be $450,000 toearn the desired target profit.b. The formula method is summarized on this slide. It can also be used to compute thedollar sales needed to attain a target profit.Quick Check – target profit calculationsC. The margin of safetyLearning Objective 7: Compute the margin of safety and explain its significance. i. The margin of safety in dollars is the excess of budgeted (or actual) sales over the break-even volume of sales .1. For example: If we assume that RBC has actual sales of $250,000, given that we have already determined the break-even sales to be $200,000, the margin of safety is $50,000.2. The margin of safety can be expressed as a percent of sales. a. For example: RBC’s margin of safety is 20% of sales .3. The margin of safety can be expressed in terms of the number of units sold.a. For example: RBC’s margin of safety is100 bikes .Quick Check – margin of safety calculationsIV.CVP considerations in choosing a cost structur eA. Cost structure and profit stabilityi. Cost structure refers to the relative proportion of fixed and variable costs in an organization. Managers often have some latitude in determining their organization's cost structure.ii. There are advantages and disadvantages to high fixed cost (or low variable cost) and low fixed cost (or high variable cost) structures.1. An advantage of a high fixed cost structure is that income will be higher in good yearscompared to companies with a lowerproportion of fixed costs.2. A disadvantage of a high fixed cost structure is that income will be lower in bad years compared to companies with a lower proportion of fixed costs.3. Companies with low fixed cost structures enjoy greater stability in income across good and bad years.Learning Objective 8: Compute the degree of operating leverage at a particular level of sales and explain how it can be used to predict changes in net operating income.B. Operating leveragei. Operating leverage is a measure of how sensitive net operating income is to percentage changes in sales . i. The degree of operating leverage is a measure, atany given level of sales, of how a percentagechange in sales volume will affect profits. It is computed as shown on this slide.ii. To illustra te, let’s revisit the contribution format income statement for RBC: 1. RBC’s degree of operating leverage is 5 ($100,000/$20,000). 2. With an operating leverage of 5, if RBC increases its sales by 10%, net operatingincome would increase by 50%.a.The 50% increase can be verified bypreparing a contribution approach income statement.Quick Check –operating leverage calculationsHelpful Hint: Emphasize that the degree of operating leverage is not a constant like unit variable cost or unit contribution margin that a manager can apply withconfidence in a variety of situations. The degree ofoperating leverage depends on the level of sales andmust be recomputed each time the sales level changes.Also, note that operating leverage is greatest at saleslevels near the break-even point and it decreases assales and profits rise.V.Structuring sales commission spanies generally compensate salespeople bypaying them either a commission based on sales or asalary plus a sales commission. Commissions based onsales dollars can lead to lower profits in a company.Consider the following illustration:i.Pipeline Unlimited produces two types ofsurfboards, the XR7 and the Turbo. The XR7 sellsfor $100 and generates a contribution margin perunit of $25. The Turbo sells for $150 and earns acontribution margin per unit of $18.ii. Salespeople compensated based on sales commission will push hard to sell the Turbo even-though the XR7 earns a higher contribution margin per unit.iii. To eliminate this type of conflict,commissions canbe based on contribution margin rather than on selling price alone.VI. The concept of sales mi xLearning Objective 9: Compute the break-even point for a multiproduct company and explain the effects ofshifts in the sales mix on contribution margin and the break-even point.A. The term sales mix refers to the relative proportions in which a company’s products are sold. Since different products have different selling prices, variable costs, and contribution margins, when a company sells more than one product, break-even analysis becomes more complex as the following example illustrates:Helpful Hint: Mention that these calculations typically assume a constant sales mix. The rationale for this assumption can be explained as follows. To use simple break-even and target profit formulas, we must assume the firm has a single product. So we do just that – even for multi-product companies. The trick is to assume the company is really selling baskets of products and each basket always contains the various products in the same proportions.i. Assume the RBC sells bikes and carts. The bikes comprise 45% of the company’s total sales revenue and the carts comprise the remaining 55%. The contribution margin ratio for both products combined is 48.2%.ii. The break-even point in sales would be $352,697. The bikes would account for 45% of this amount, or $158,714. The carts would account for 55% of the break-even sales, or $193,983.1. Notice a slight rounding error of $176.。
加里森管理会计讲义笔记英文版最新精品GNB_16e_CH04_LectureNotes

Chapter 4Lecture NotesChapter theme: Managers need to assign costs to products to facilitate external financial reporting and internal decision making. This chapter illustrates an absorption costing approach to calculating product costs known as process costing .I. Comparison of job-order and process c ostingA. Similarities between job-order and process costingi. Both systems assign material , labor, andoverhead costs to products and they provide a mechanism for computing unit product costs.ii. Both systems use the same manufacturing accounts,including Raw Materials, Work in Process,Manufacturing Overhead, and Finished Goods . iii. The flow of costs through the manufacturingaccounts is basically the same in both systems.B. Differences between job-order and process costingi. Process costing is used when a single product is produced on a continuing basis or for a long periodof time. Job-order costing is used when many different jobs having different productionrequirements are worked on each period.ii. Process costing systems accumulate costs by department and assign them uniformly to all units processed during the period. Job-order costing systems accumulate costs by individual jobs .iii. Process costing systems compute unit costs bydepartment. Job-order costing systems compute unit costs by job on the job cost sheet.Quick Check - process vs. job-order costing II.Cost flows in process costingA. Processing departments - An organizational unit where materials, labor, or overhead costs are added to the product.i. The activity performed in a processing department is performed uniformly on all units passing through it. Furthermore, the output of a processing department must be homogeneous . ii. Products in a process costing environment typically flow in a sequence from one department to another.Learning Objective 1: Record the flow of materials, labor, and overhead through a process costing system.B.The flow of materials, labor, and overhead costsi.The flow of costs through the manufacturing accounts is basically the same for process and job-order costing.1.Direct materials, direct labor, andmanufacturing overhead are added to Work inProcess. When work in process is completed,the costs are transferred to Finished Goods.When finished goods are sold, the costs aretransferred to Cost of Goods Sold.ii.Nonetheless, there is a key fundamental difference between process and job-order costing systems.1.Job-order costing systems trace and applymanufacturing costs to jobs.a.One Work in Process account is often usedto accumulate costs for all jobs. Theindividual job cost sheets serve as asubsidiary ledger.2.Process costing systems trace and applymanufacturing costs to departments.a.A separate Work in Process account ismaintained for each processing department.b.Material, labor, and overhead coststransferred from one department’s Work inProcess account to another department’sWork in Process account are calledtransferred-in costs.iii.T-account and journal entry views of process cost flows (For purposes of this example, assume there are two processing departments—A and B).Helpful Hint: Explain that the journal entries for job-order and process costing are similar, with theexception of the specific Work in Process account for each department under process costing.1.The flow of raw material costs.a.In T-account form:(1).Direct material costs are debited to theappropriate departmental Work inProcess account depending upon wherethe materials were added to theproduction process. The Raw Materialsaccount is credited for thecorresponding amounts.b.In journal entry form:(1).Debit the respective departmental Workin Process accounts. Credit RawMaterials.2.The flow of labor costs.a.In T-account form:(1).Direct labor costs are debited to theappropriate departmental Work inProcess account depending upon wherethe labor was added to the productionprocess. Salaries and Wages Payable iscredited for the corresponding amounts.b. In journal entry form: (1). Debit the respective departmental Work in Process accounts. Credit Salaries and Wages Payable. 3. The flow of manufacturing overhead costs. a. In T-account form: (1). Manufacturing overhead costs are debited to the respective departmental Work in Process accounts. Manufacturing Overhead is credited by the corresponding amounts. (a). Predetermined overhead rates are usually used to apply overhead to the departments. b. In journal entry form: (1). Debit the appropriate departmental Work in Process accounts. Credit Manufacturing Overhead.4. The flow of manufacturing costs for partially completed units transferred fromDepartment A to Department B:a. In T-account form:(1). The cost of direct materials, direct labor,and manufacturing overhead assignedto partially completed units fromDepartment A is debited to DepartmentB and credited to Department A.(3). The transferred-in costs from Department A are added to the manufacturing costs incurred in Department B. b. In journal entry form: (1). Debit Work in Process - Department B and credit Work in Process - Department A. 5. The flow of manufacturing costs from the final processing department to finished goods . a. In T-account form: (1). Debit Finished Goods and credit Work in Process - Department B for the amount of the cost of goods manufactured. b. In journal entry form: (1). Debit Finished Goods and credit Work in Process - Department B. 6. The flow of manufacturing costs from Finished Goods to Cost of Goods Sold. a. In T-account form: (1). Debit Cost of Goods Sold and credit Finished Goods. b. In journal entry form: (1). Debit Cost of Goods Sold and credit Finished Goods.III. Process costing computations: three key conceptsA. Key concept #1: Two methodsi. Equivalent units can be calculated two ways .1. The FIFO method is covered in the appendix;theweighted-average method is includedwithin the main portion of the chapter (and it is covered next).2. Characteristics of the weighted-averagemethod:a. This method makes no distinction between work done in the prior and current periods.It blends together units and costs from theprior and current periods.b. The equivalent units of production for adepartment are the number of unitstransferred to the next department (orfinished goods) plus the equivalent units inthe department’s ending work in processinventory.B. Key concept #2: Conversion costsi. Direct labor costs are often small in comparison to the other product costs in process cost systems.1. Therefore, direct labor and manufacturing overhead are often combined into one classification of product cost called conversion costs . The example combines these costs.C. Key concept #3: Equivalent unitsi. Equivalent units - Defined as the product of the number of partially completed units and the percentage completion of those units. ii. Equivalent units need to be calculated because a department usually has some partially completed units in its beginning and ending inventories. These partially completed units complicate the determination of a department’s output for a given period and the unit cost that should be assigned to that output.Helpful Hint: Explain that equivalent units simply restate the ending work in process inventory as if it were comprised of a smaller number of fully completed units.iii. Equivalent units - the basic idea: 1. Two half completed products are equivalent to one complete product. 2. 10,000 units 70% completed are equivalent to 7,000 complete units. Quick Check - calculating equivalent unitsLearning Objective 2: Compute the equivalent units of production using the weighted-average method.IV. W eighted-average method--ExampleA. Assume that Smith Company’s Assembly Department reported activity for June as shown on this slide. i. Step 1: Compute the equivalent units of production (weighted average method)1. The first component in the calculation of the equivalent units is to identify the units completed and transferred out of the department in June (5,400 units for materials and conversion ).2. The second component is to identify the equivalent units of production in ending work in process with respect to materials for the month (540 units ) and adding this to the 5,400 units from step one.3. The third component is to identify the equivalent units of production in ending work in process with respect to conversion for the month (270 units ) and adding this to the 5,400 units from step one.Helpful Hint: Explain that there will most likely be differences in the equivalent unit calculations between materials and conversion costs, as materials are usually added at the beginning of production, while conversion costs are added during the period.4. The equivalent units of production equals the units completed and transferred out (5,400 units ) plus the equivalent units remaining in work in process (540 units for materials and 270 units for conversion ).5. A different visual depiction of the equivalent units calculation for materials is shown on this slide.6. A different visual depiction of the equivalent units calculation for conversion is shown on this slide. Helpful Hint: The treatment of beginning inventory under the weighted-average method often puzzles students, since work done in the prior periods is included in the equivalent units. Explain that this is called the weighted-average method precisely because it averages together beginning inventory and work performed in the current period. Costs and units are treated consistently. Both the equivalent units and the costs that go into the unit cost calculations under the weighted-average method include amounts already in beginning inventory.Learning Objective 3: Compute the cost per equivalent unit using the weighted-average method. ii. Step 2: Computing the cost per equivalent unit (weighted average method)1. Assume the following additional facts with respect to Smith Company’s Assembly Department.2. The formula for computing the cost per equivalent units is as shown.3. The numerators for Smith Company ($124,740 for materials and $85,050 for conversion ) are computed as shown.4. The cost per equivalent unit for materials ($21.00) and conversion ($15.00) is computed as shown.a. The equivalent units of production (5,940for materials and 5,670 for conversion )were computed on a prior slide.iii. Step 3: Assign costs to units (weightedaverage method)Learning Objective 4: Assign costs to units using the weighted-average method.1. Computing the cost of ending work in processinventory. a. The first component of the calculation is to record the equivalent units of production inending work in process inventory (540 unitsfor materials and 270 units forconversion).b. The second component of the calculation is to record the cost per equivalent unit ($21.00for materials and $15.00 for conversion).compute the cost of ending work in process inventory ($11,340 for materials, $4,050 for conversion, and $15,390 in total).2.Computing the cost of units transferred out .a.The first component of the calculation is to record the units transferred out to the next department (5,400 units for materials and conversion ). b. The second component of the calculation is to record the cost per equivalent unit ($21.00 for materials and $15.00 for conversion ). c. The third component of the calculation is to compute the cost of units transferred out ($113,400 for materials, $81,000 for conversion, and $194,400 in total ). Learning Objective 5: Prepare a cost reconciliation report using the weighted-average method. iv. Step 4: Prepare a cost reconciliation report1. Computing the costs to be accounted for: a. The first component of the calculation is to record the cost of beginning work in process as shown on slide 43 ($10,039).to record the costs added to production during the period as shown on slide 43 ($199,751). c. The third component of the calculation is to sum these two costs ($209,790). 2. Computing the costs accounted for : a. The first component of the calculation is to record the previously computed cost of ending working process inventory ($15,390). b. The second component of the calculation isto record the previously computed cost ofunits transferred out ($194,400).c. The third component of the calculation is to sum these two costs ($209,790).3. Notice the two totals agree indicating that all costs have been accounted for.V.Operation costingA. Operation costing is a hybrid of job-order and process costing because it possesses attributes of both approaches. i. Operation costing is commonly used when batches of many different products pass through the same processing departments.1.For example, similar to job-order costing, a Array shoe manufacturer may charge each batch ofshoes for its own specific material costs (e.g., shoes made with expensive leather would becharged accordingly, as would shoes madewith inexpensive synthetic materials).2.Similar to process costing, the shoemanufacturer may accumulate the labor andoverhead costs by department and assign thesame conversion cost per unit to each shoeregardless of the shoe style.。
- 1、下载文档前请自行甄别文档内容的完整性,平台不提供额外的编辑、内容补充、找答案等附加服务。
- 2、"仅部分预览"的文档,不可在线预览部分如存在完整性等问题,可反馈申请退款(可完整预览的文档不适用该条件!)。
- 3、如文档侵犯您的权益,请联系客服反馈,我们会尽快为您处理(人工客服工作时间:9:00-18:30)。
Chapter 11Lecture NotesChapter theme: Managers in large organizations have to Array delegate some decisions to those who are at lower levels inthe organization. This chapter explains how responsibilityaccounting systems, return on investment (ROI),residual income, operating performance measures, andthe balanced scorecard are used to help controldecentralized organizations.I.Decentralization in organizationsA. A decentralized organization does not confinedecision-making authority to a few top executives;rather, decision-making authority is spreadthroughout the organization. The advantages anddisadvantages of decentralization are as follows:i.Advantages of decentralization1.It enables top management to concentrate onstrategy, higher-level decision making, andcoordinating activities.2.It acknowledges that lower-level managershave more detailed information about localconditions that enable them to make betteroperational decisions.3.It enables lower-level managers to quicklyrespond to customers.4.It provides lower-level managers with thedecision-making experience they will needwhen promoted to higher level positions.5. It often increases motivation , resulting in increased job satisfaction and retention, as well as improved performance.ii. Disadvantages of decentralization1. Lower-level managers may make decisionswithout fully understanding the “big picture.”2. There may be a lack of coordination amongautonomous managers.a. The balanced scorecard can help reducethis problem by communicating acompany’s strategy throughout theorganization.3. Lower-level managers may have objectivesthat differ from those of the entireorganization.a. This problem can be reduced by designingperformance evaluation systems thatmotivate managers to make decisions thatare in the best interests of the company.4. It may be difficult to effectively spreadinnovative ideas in a strongly decentralizedorganization.II. Responsibility accountingA. Responsibility accounting systems link lower-levelmanagers’ decision -making authority withaccountability for the outcomes of those decisions.The term responsibility center is used for any part of an organization whose manager has control over, and is accountable for cost, profit, or investments. Thethree primary types of responsibility centers are cost centers, profit centers, and investment centers.i.Cost center1.The manager of a cost center hascontrol overcosts, but not over revenue or investment funds.a.Service departments such as accounting,general administration, legal, and personnelare usually classified as cost centers, as aremanufacturing facilities.b.Standard cost variances and flexiblebudget variances, such as those discussedin Chapters 10 and 11, are often used toevaluate cost center performance.ii.Profit center1.The manager of a profit center has control overboth costs and revenue.a.Profit center managers are often evaluatedby comparing actual profit to targeted orbudgeted profit.iii.I nvestment center1.The manager of an investment center hascontrol over cost, revenue, and investmentsin operating assets.b.Investment center managers are usuallyevaluated using return on investment (ROI)or residual income, as discussed later in thischapter.III. Evaluating investment center performance – return on investmentLearning Objective 1: Compute return on investment Array (ROI) and show how changes in sales, expenses, andassets affect ROI.A. Key concepts/definitionsi. Investment center performance is often evaluatedusing a measure called return on investment(ROI), which is defined as follows:Net operating incomeROIAverage operating assetsii. Net operating income is income before taxes and is sometimes referred to as EBIT (earnings beforeinterest and taxes). Operating assets include cash,accounts receivable, inventory, plant andequipment, and all other assets held for operatingpurposes.1. Net operating income is used in the numeratorbecause the denominator consists only ofoperating assets.2. The operating asset base used in the formula istypically computed as the average of the assetsbetween the beginning and the end of the year.iii. N et book value versus gross cost1. Most companies use thenet book value (i.e.,acquisition cost less accumulated depreciation)of depreciable assets to calculate averageoperating assets.a. With this approach, ROI mechanicallyincreases over time as the accumulateddepreciation increases. Replacing a fully-depreciated asset with a new asset willdecrease ROI.2. An alternative to net book value is the grosscost of the asset, which ignores accumulateddepreciation.a. With this approach, ROI does not growautomatically over time, rather it staysconstant. Replacing a fully-depreciatedasset does not adversely affect ROI.B. Understanding ROIi. Du Pont pioneered the use of ROI and recognizedthe importance of looking at the components ofROI, namely margin and turnover.1. Margin is computed as shown and is improvedby increasing unit sales, increasing sellingprices, or reducing operating expenses. Thelower the operating expenses per dollar of sales,the higher the margin earned.2. Turnover is computed as shown. It incorporates a crucial area of a manager’s responsibility – the investment in operating assets. Excessive funds tied up in operating assets depress turnover and lower ROI.Helpful Hint: Emphasize that both margin and turnover affect profitability. As an example, ask students tocompare the margins and turnovers of grocery stores to jewelry stores. In equilibrium, every industry should have roughly the same ROI. Groceries, because of their short shelf life, have high turnovers relative to fine jewelry. If the ROIs are to be comparable in grocery stores and in jewelry stores, the margins would have to be higher in jewelry stores.ii. To illustrate how to increase ROI, assume that Regal Company reports the results shown:1. Given this information, its current ROI is 15%.2. Suppose that Regal’s manager invests in a $30,000 piece of equipment that increases sales by $35,000 while increasing operating expenses by $15,000. a. In this case, the ROI increases from 15% to 21.8%.C. Criticisms of ROIi. Just telling managers to increase ROI may not beenough. Managers may not know how toincrease ROI in a manner that is consistent with the company’s strategy.1. This is why ROI is best used as part of abalanced scorecard.ii. A manager who takes over a business segment typically inherits many committed costs over which the manager has no control. This may make it difficult to assess this manager relative to other managers.iii. A manager who is evaluated based on ROI may reject investment opportunities that areprofitable for the whole company but that would have a negative impact on the manager’sperformance evaluation.Helpful Hint: When discussing the criticisms of ROI and other measures of profitability, ask students to play the role of a manager who anticipates a short tenure. This manager will want to increase ROI as quickly as possible. Ask students to list the activities that could be undertaken to increase ROI that, in reality, would hurt the company as a whole.IV. Residual incomeLearning Objective 2: Compute residual income and understand its strengths and weaknesses.A. Defining residual incomei. Residual income is the net operating income that an investment center earns above the minimum required return on its assets .B. Calculating residual incomei. The equation for computing residual income is asshown. Notice: 1. This computationdiffers from ROI. ROI measures net operating income earned relativeto the investment in average operating assets. Residual income measures net operating income earned less the minimum required return on average operating assets. ii. Zepher, Inc. - an example1. Assume the information as given for a division of Zepher, Inc.2. The residual income ($10,000) is computed by subtracting the minimum required return ($20,000) from the actual income ($30,000).C.Motivation and residual income i. The residual income approach encourages managers to make investments that are profitable for the entire company but that would be rejected by managers who are evaluated using the ROI formula. More specifically:1. It motivates managers to pursue investmentswhere the ROI associated with thoseinvestments exceeds the company’s minimumrequired return but is less than the ROI beingearned by the managers.Quick Check – ROI versus residual incomeD.Divisional comparison and residual income i.The residual income approach has one majordisadvantage. It cannot be used to compare the performance of divisions of different sizes.ii. Zepher, Inc. – continued1. Recall that the Retail Division of Zepher hadaverage operating assets of $100,000, aminimum required rate of return of 20%, netoperating income of $30,000, and residualincome of $10,000.2. Assume that the Wholesale Division of Zepherhad average operating assets of $1,000,000, aminimum required rate of return of 20%, netoperating income of $220,000, and residualincome of $20,000.3. The residual income numbers suggest that the Wholesale Division outperformed the Retail Division because its residual income is $10,000 higher. However: a. The Retail Division earned an ROI of30% compared to an ROI of 22% forthe Wholesale Division. TheWholesale Division’s residual incomeis larger than the Retail Divisionsimply because it is a bigger division .V.Operating performance measuresLearning Objective 3: Compute throughput time,delivery cycle time, and manufacturing cycle efficiency (MCE).A. Key definitions/conceptsi. Throughput (manufacturing cycle) time is theelapsed time from when production is started until finished goods are shipped to customers.1. This includes process time, inspection time, move time, and queue time . Process time is the only value-added activity of the fourmentioned.ii. Delivery cycle time is the elapsed time from whena customer order is received until the finished goods are shipped.iii. Manufacturing cycle efficiency (MCE) iscomputed by dividing value-added time by throughput time.1. The goal is to increase this measure.2. Any non-value-added time results in an MCE of less than 1.0.Quick Check – internal business process measures VI. Balanced scorecardLearning Objective 4: Understand how to construct and use a balanced scorecard.A. Key conceptsi. A balanced scorecard consists of an integratedset of performance measures that are derived from and support a company’s strategy. Importantly, the measures included in a company’s balanced scorecard are unique to its specific strategy . ii. The balanced scorecard enables top managementto translate its strategy into four groups of performance measures – financial, customer, internal business process, and learning and growth − that employees can understand and influence.1.The premise of these four groups of measuresis that learning is necessary to improveinternal business processes, which in turnimproves the level of customer satisfaction, which in turn improves financial results.a.Note the emphasis on improvement, notjust attaining some specific objective.iii.The balanced scorecard relies onnon-financial measures in addition to financial measures fortwo reasons:1.Financial measures are lag indicators thatsummarize the results of past actions. Non-financial measures are leading indicators offuture financial performance.2.Top managers are ordinarily responsible forfinancial performance measures – not lowerlevel managers. Non-financial measures aremore likely to be understood and controlledby lower level managers.iv.While the entire organization has an overall balanced scorecard, each responsible individualshould have his or her own personal scorecard as well.1.A personal scorecard should contain measuresthat can be influenced by the individual beingevaluated and that support the measures in theoverall balanced scorecard.v. A balanced scorecard, whether for an individualor the company as a whole, should have measures that are linked together on a cause-and-effect basis .1. Each link can be read as a hypothesis in the form “If we improve this performance measure, then this other performance measure shouldalso improve.”2. In essence, the balanced scorecard lays out a theory of how a company can take concrete actions to attain desired outcomes. If the theory proves false or the company alters its strategy, the measures within the scorecard are subject to change .vi. Incentive compensation for employeesprobably should be linked to balanced scorecard performance measures .1. However, this should only be done after the organization has been successfully managed with the scorecard for some time – perhaps a year or more . Managers must be confident that the measures are reliable, not easilymanipulated, and understandable by those being evaluated with them.B. The balanced scorecard – an example i. Assume that Jaguar pursues a strategy as shown on this slide. Examples of measures that Jaguar might select with their corresponding cause-and-effect linkages include:1. If “employee skills in installing options ” increases, then the “number of options available ” should increase and the “time to install an option ” should decrease.2. If the “number of options available ” increases and the “time to install an option” decreases, then “customer surveys: satisfaction with options available” should increase.3. If the “customer surveys: satisfaction with options available ” increases, then the “number of cars sold ” should increase.4. If the “time to install an option ” decreases and the “customer surveys: satisfaction with options available ” increases, then the “contribution margin per car ” should increase.5. If the “number of cars sold ” and the “contribution margin per car ” increase, then the “profit ” should incr ease.。