2006美国数模特等奖论文
2014年美国大学生数学建模MCM-B题O奖论文
For office use only T1T2T3T4T eam Control Number24857Problem ChosenBFor office use onlyF1F2F3F42014Mathematical Contest in Modeling(MCM)Summary Sheet (Attach a copy of this page to each copy of your solution paper.)AbstractThe evaluation and selection of‘best all time college coach’is the prob-lem to be addressed.We capture the essential of an evaluation system by reducing the dimensions of the attributes by factor analysis.And we divide our modeling process into three phases:data collection,attribute clarifica-tion,factor model evaluation and model generalization.Firstly,we collect the data from official database.Then,two bottom lines are determined respectively by the number of participating games and win-loss percentage,with these bottom lines we anchor a pool with30to40 candidates,which greatly reduced data volume.And reasonably thefinal top5coaches should generate from this pool.Attribution clarification will be abundant in the body of the model,note that we endeavor to design an attribute to effectively evaluate the improvement of a team before and after the coach came.In phase three,we analyse the problem by following traditional method of the factor model.With three common factors indicating coaches’guiding competency,strength of guided team,competition strength,we get afinal integrated score to evaluate coaches.And we also take into account the time line horizon in two aspects.On the one hand,the numbers of participating games are adjusted on the basis of time.On the other hand,we put forward a potential sub-model in our‘further attempts’concerning overlapping pe-riod of the time of two different coaches.What’s more,a‘pseudo-rose dia-gram’method is tried to show coaches’performance in different areas.Model generalization is examined by three different sports types,Foot-ball,Basketball,and Softball.Besides,our model also can be applied in all possible ball games under the frame of NCAA,assigning slight modification according to specific regulations.The stability of our model is also tested by sensitivity analysis.Who’s who in College Coaching Legends—–A generalized Factor Analysis approach2Contents1Introduction41.1Restatement of the problem (4)1.2NCAA Background and its coaches (4)1.3Previous models (4)2Assumptions5 3Analysis of the Problem5 4Thefirst round of sample selection6 5Attributes for evaluating coaches86Factor analysis model106.1A brief introduction to factor analysis (10)6.2Steps of Factor analysis by SPSS (12)6.3Result of the model (14)7Model generalization15 8Sensitivity analysis189Strength and Weaknesses199.1Strengths (19)9.2Weaknesses (19)10Further attempts20 Appendices22 Appendix A An article for Sports Illustrated221Introduction1.1Restatement of the problemThe‘best all time college coach’is to be selected by Sports Illustrated,a magazine for sports enthusiasts.This is an open-ended problem—-no limitation in method of performance appraisal,gender,or sports types.The following research points should be noted:•whether the time line horizon that we use in our analysis make a difference;•the metrics for assessment are to be articulated;•discuss how the model can be applied in general across both genders and all possible sports;•we need to present our model’s Top5coaches in each of3different sports.1.2NCAA Background and its coachesNational Collegiate Athletic Association(NCAA),an association of1281institution-s,conferences,organizations,and individuals that organizes the athletic programs of many colleges and universities in the United States and Canada.1In our model,only coaches in NCAA are considered and ranked.So,why evaluate the Coaching performance?As the identity of a college football program is shaped by its head coach.Given their impacts,it’s no wonder high profile athletic departments are shelling out millions of dollars per season for the services of coaches.Nick Saban’s2013total pay was$5,395,852and in the same year Coach K earned$7,233,976in total23.Indeed,every athletic director wants to hire the next legendary coach.1.3Previous modelsTraditionally,evaluation in athletics has been based on the single criterion of wins and losses.Years later,in order to reasonably evaluate coaches,many reseachers have implemented the coaching evaluation model.Such as7criteria proposed by Adams:[1] (1)the coach in the profession,(2)knowledge of and practice of medical aspects of coaching,(3)the coach as a person,(4)the coach as an organizer and administrator,(5) knowledge of the sport,(6)public relations,and(7)application of kinesiological and physiological principles.1Wikipedia:/wiki/National_Collegiate_Athletic_ Association#NCAA_sponsored_sports2USAToday:/sports/college/salaries/ncaaf/coach/ 3USAToday:/sports/college/salaries/ncaab/coach/Such models relatively focused more on some subjective and difficult-to-quantify attributes to evaluate coaches,which is quite hard for sports fans to judge coaches. Therefore,we established an objective and quantified model to make a list of‘best all time college coach’.2Assumptions•The sample for our model is restricted within the scale of NCAA sports.That is to say,the coaches we discuss refers to those service for NCAA alone;•We do not take into account the talent born varying from one player to another, in this case,we mean the teams’wins or losses purely associate with the coach;•The difference of games between different Divisions in NCAA is ignored;•Take no account of the errors/amendments of the NCAA game records.3Analysis of the ProblemOur main goal is to build and analyze a mathematical model to choose the‘best all time college coach’for the previous century,i.e.from1913to2013.Objectively,it requires numerous attributes to judge and specify whether a coach is‘the best’,while many of the indicators are deemed hard to quantify.However,to put it in thefirst place, we consider a‘best coach’is,and supposed to be in line with several basic condition-s,which are the prerequisites.Those prerequisites incorporate attributes such as the number of games the coach has participated ever and the win-loss percentage of the total.For instance,under the conditions that either the number of participating games is below100,or the win-loss percentage is less than0.5,we assume this coach cannot be credited as the‘best’,ignoring his/her other facets.Therefore,an attempt was made to screen out the coaches we want,thus to narrow the range in ourfirst stage.At the very beginning,we ignore those whose guiding ses-sions or win-loss percentage is less than a certain level,and then we determine a can-didate pool for‘the best coach’of30-40in scale,according to merely two indicators—-participating games and win-loss percentage.It should be reasonably reliable to draw the top5best coaches from this candidate pool,regardless of any other aspects.One point worth mentioning is that,we take time line horizon as one of the inputs because the number of participating games is changing all the time in the previous century.Hence,it would be unfair to treat this problem by using absolute values, especially for those coaches who lived in the earlier ages when sports were less popular and games were sparse comparatively.4Thefirst round of sample selectionCollege Football is thefirst item in our research.We obtain data concerning all possible coaches since it was initiated,of which the coaches’tenures,participating games and win-loss percentage etc.are included.As a result,we get a sample of2053in scale.Thefirst10candidates’respective information is as below:Table1:Thefirst10candidates’information,here Pct means win-loss percentageCoach From To Years Games Wins Losses Ties PctEli Abbott19021902184400.5Earl Abell19281930328141220.536Earl Able1923192421810620.611 George Adams1890189233634200.944Hobbs Adams1940194632742120.185Steve Addazio20112013337201700.541Alex Agase1964197613135508320.378Phil Ahwesh19491949193600.333Jim Aiken19461950550282200.56Fred Akers19751990161861087530.589 ...........................Firstly,we employ Excel to rule out those who begun their coaching career earlier than1913.Next,considering the impact of time line horizon mentioned in the problem statement,we import our raw data into MATLAB,with an attempt to calculate the coaches’average games every year versus time,as delineated in the Figure1below.Figure1:Diagram of the coaches’average sessions every year versus time It can be drawn from thefigure above,clearly,that the number of each coach’s average games is related with the participating time.With the passing of time and the increasing popularity of sports,coaches’participating games yearly ascends from8to 12or so,that is,the maximum exceed the minimum for50%around.To further refinethe evaluation method,we make the following adjustment for coaches’participating games,and we define it as each coach’s adjusted participating games.Gi =max(G i)G mi×G iWhere•G i is each coach’s participating games;•G im is the average participating games yearly in his/her career;and•max(G i)is the max value in previous century as coaches’average participating games yearlySubsequently,we output the adjusted data,and return it to the Excel table.Obviously,directly using all this data would cause our research a mass,and also the economy of description is hard to achieved.Logically,we propose to employ the following method to narrow the sample range.In general,the most essential attributes to evaluate a coach are his/her guiding ex-perience(which can be shown by participating games)and guiding results(shown by win-loss percentage).Fortunately,these two factors are the ones that can be quantified thus provide feasibility for our modeling.Based on our common sense and select-ed information from sports magazines and associated programs,wefind the winning coaches almost all bear the same characteristics—-at high level in both the partici-pating games and the win-loss percentage.Thus we may arbitrarily enact two bottom line for these two essential attributes,so as to nail down a pool of30to40candidates. Those who do not meet our prerequisites should not be credited as the best in any case.Logically,we expect the model to yield insight into how bottom lines are deter-mined.The matter is,sports types are varying thus the corresponding features are dif-ferent.However,it should be reasonably reliable to the sports fans and commentators’perceptual intuition.Take football as an example,win-loss percentage that exceeds0.75 should be viewed as rather high,and college football coaches of all time who meet this standard are specifically listed in Wikipedia.4Consequently,we are able tofix upon a rational pool of candidate according to those enacted bottom lines and meanwhile, may tender the conditions according to the total scale of the coaches.Still we use Football to further articulate,to determine a pool of candidates for the best coaches,wefirst plot thefigure below to present the distributions of all the coaches.From thefigure2,wefind that once the games number exceeds200or win-loss percentage exceeds0.7,the distribution of the coaches drops significantly.We can thus view this group of coaches as outstanding comparatively,meeting the prerequisites to be the best coaches.4Wikipedia:/wiki/List_of_college_football_coaches_ with_a_.750_winning_percentageFigure2:Hist of the football coaches’number of games versus and average games every year versus games and win-loss percentageHence,we nail down the bottom lines for both the games number and the win-loss percentage,that is,0.7for the former and200for the latter.And these two bottom lines are used as the measure for ourfirst round selection.After round one,merely35 coaches are qualified to remain in the pool of candidates.Since it’s thefirst round sifting,rather than direct and ultimate determination,we hence believe the subjectivity to some extent in the opt of bottom lines will not cloud thefinal results of the best coaches.5Attributes for evaluating coachesThen anchored upon the35candidate selected,we will elaborate our coach evaluation system based on8attributes.In the indicator-select process,we endeavor to examine tradeoffs among the availability for data and difficulty for data quantification.Coaches’pay,for example,though serves as the measure for coaching evaluation,the corre-sponding data are limited.Situations are similar for attributes such as the number of sportsmen the coach ever cultivated for the higher-level tournaments.Ultimately,we determine the8attributes shown in the table below:Further explanation:•Yrs:guiding years of a coach in his/her whole career•G’:Gi =max(G i)G mi×G i see it at last section•Pct:pct=wins+ties/2wins+losses+ties•SRS:a rating that takes into account average point differential and strength of schedule.The rating is denominated in points above/below average,where zeroTable2:symbols and attributessymbol attributeYrs yearsG’adjusted overall gamesPct win-lose percentageP’Adjusted percentage ratioSRS Simple Rating SystemSOS Strength of ScheduleBlp’adjusted Bowls participatedBlw’adjusted Bowls wonis the average.Note that,the bigger for this value,the stronger for the team performance.•SOS:a rating of strength of schedule.The rating is denominated in points above/below average,where zero is the average.Noted that the bigger for this value,the more powerful for the team’s rival,namely the competition is more fierce.Sports-reference provides official statistics for SRS and SOS.5•P’is a new attribute designed in our model.It is the result of Win-loss in the coach’s whole career divided by the average of win-loss percentage(weighted by the number of games in different colleges the coach ever in).We bear in mind that the function of a great coach is not merely manifested in the pure win-loss percentage of the team,it is even more crucial to consider the improvement of the team’s win-loss record with the coach’s participation,or say,the gap between‘af-ter’and‘before’period of this team.(between‘after’and‘before’the dividing line is the day the coach take office)It is because a coach who build a comparative-ly weak team into a much more competitive team would definitely receive more respect and honor from sports fans.To measure and specify this attribute,we col-lect the key official data from sports-reference,which included the independent win-loss percentage for each candidate and each college time when he/she was in the team and,the weighted average of all time win-loss percentage of all the college teams the coach ever in—-regardless of whether the coach is in the team or not.To articulate this attribute,here goes a simple physical example.Ike Armstrong (placedfirst when sorted by alphabetical order),of which the data can be ob-tained from website of sports-reference6.We can easily get the records we need, namely141wins,55losses,15ties,and0.704for win-losses percentage.Fur-ther,specific wins,losses,ties for the team he ever in(Utab college)can also be gained,respectively they are602,419,30,0.587.Consequently,the P’value of Ike Armstrong should be0.704/0.587=1.199,according to our definition.•Bowl games is a special event in thefield of Football games.In North America,a bowl game is one of a number of post-season college football games that are5sports-reference:/cfb/coaches/6sports-reference:/cfb/coaches/ike-armstrong-1.htmlprimarily played by teams from the Division I Football Bowl Subdivision.The times for one coach to eparticipate Bowl games are important indicators to eval-uate a coach.However,noted that the total number of Bowl games held each year is changing from year to year,which should be taken into consideration in the model.Other sports events such as NCAA basketball tournament is also ex-panding.For this reason,it is irrational to use the absolute value of the times for entering the Bowl games (or NCAA basketball tournament etc.)and the times for winning as the evaluation measurement.Whereas the development history and regulations for different sports items vary from one to another (actually the differentiation can be fairly large),we here are incapable to find a generalized method to eliminate this discrepancy ,instead,in-dependent method for each item provide a way out.Due to the time limitation for our research and the need of model generalization,we here only do root extract of blp and blw to debilitate the differentiation,i.e.Blp =√Blp Blw =√Blw For different sports items,we use the same attributes,except Blp’and Blw’,we may change it according to specific sports.For instance,we can use CREG (Number of regular season conference championship won)and FF (Number of NCAA Final Four appearance)to replace Blp and Blw in basketball games.With all the attributes determined,we organized data and show them in the table 3:In addition,before forward analysis there is a need to preprocess the data,owing to the diverse dimensions between these indicators.Methods for data preprocessing are a lot,here we adopt standard score (Z score)method.In statistics,the standard score is the (signed)number of standard deviations an observation or datum is above the mean.Thus,a positive standard score represents a datum above the mean,while a negative standard score represents a datum below the mean.It is a dimensionless quantity obtained by subtracting the population mean from an individual raw score and then dividing the difference by the population standard deviation.7The standard score of a raw score x is:z =x −µσIt is easy to complete this process by statistical software SPSS.6Factor analysis model 6.1A brief introduction to factor analysisFactor analysis is a statistical method used to describe variability among observed,correlated variables in terms of a potentially lower number of unobserved variables called factors.For example,it is possible that variations in four observed variables mainly reflect the variations in two unobserved variables.Factor analysis searches for 7Wikipedia:/wiki/Standard_scoreTable3:summarized data for best college football coaches’candidatesCoach From To Yrs G’Pct Blp’Blw’P’SRS SOS Ike Armstrong19251949252810.70411 1.199 4.15-4.18 Dana Bible19151946313860.7152 1.73 1.0789.88 1.48 Bernie Bierman19251950242780.71110 1.29514.36 6.29 Red Blaik19341958252940.75900 1.28213.57 2.34 Bobby Bowden19702009405230.74 5.74 4.69 1.10314.25 4.62 Frank Broyles19571976202570.7 3.162 1.18813.29 5.59 Bear Bryant19451982385080.78 5.39 3.87 1.1816.77 6.12 Fritz Crisler19301947182080.76811 1.08317.15 6.67 Bob Devaney19571972162080.806 3.16 2.65 1.25513.13 2.28 Dan Devine19551980222800.742 3.16 2.65 1.22613.61 4.69 Gilmour Dobie19161938222370.70900 1.27.66-2.09 Bobby Dodd19451966222960.713 3.613 1.18414.25 6.6 Vince Dooley19641988253250.715 4.47 2.83 1.09714.537.12 Gus Dorais19221942192320.71910 1.2296-3.21 Pat Dye19741992192400.707 3.16 2.65 1.1929.68 1.51 LaVell Edwards19722000293920.716 4.69 2.65 1.2437.66-0.66 Phillip Fulmer19922008172150.743 3.87 2.83 1.08313.42 4.95 Woody Hayes19511978283290.761 3.32 2.24 1.03117.418.09 Frank Kush19581979222710.764 2.65 2.45 1.238.21-2.07 John McKay19601975162070.7493 2.45 1.05817.298.59 Bob Neyland19261952212860.829 2.65 1.41 1.20815.53 3.17 Tom Osborne19731997253340.8365 3.46 1.18119.7 5.49 Ara Parseghian19561974192250.71 2.24 1.73 1.15317.228.86 Joe Paterno19662011465950.749 6.08 4.9 1.08914.01 5.01 Darrell Royal19541976232970.7494 2.83 1.08916.457.09 Nick Saban19902013182390.748 3.74 2.83 1.12313.41 3.86 Bo Schembechler19631989273460.775 4.12 2.24 1.10414.86 3.37 Francis Schmidt19221942212670.70800 1.1928.490.16 Steve Spurrier19872013243160.733 4.363 1.29313.53 4.64 Bob Stoops19992013152070.804 3.74 2.65 1.11716.66 4.74 Jock Sutherland19191938202550.81221 1.37613.88 1.68 Barry Switzer19731988162090.837 3.61 2.83 1.16320.08 6.63 John Vaught19471973253210.745 4.24 3.16 1.33814.7 5.26 Wallace Wade19231950243070.765 2.24 1.41 1.34913.53 3.15 Bud Wilkinson19471963172220.826 2.83 2.45 1.14717.54 4.94 such joint variations in response to unobserved latent variables.The observed vari-ables are modelled as linear combinations of the potential factors,plus‘error’terms. The information gained about the interdependencies between observed variables can be used later to reduce the set of variables in a putationally this technique is equivalent to low rank approximation of the matrix of observed variables.8 Why carry out factor analyses?If we can summarise a multitude of measure-8Wikipedia:/wiki/Factor_analysisments with a smaller number of factors without losing too much information,we have achieved some economy of description,which is one of the goals of scientific investi-gation.It is also possible that factor analysis will allow us to test theories involving variables which are hard to measure directly.Finally,at a more prosaic level,factor analysis can help us establish that sets of questionnaire items(observed variables)are in fact all measuring the same underlying factor(perhaps with varying reliability)and so can be combined to form a more reliable measure of that factor.6.2Steps of Factor analysis by SPSSFirst we import the decided datasets of8attributes into SPSS,and the results can be obtained below after the software processing.[2-3]Figure3:Table of total variance explainedFigure4:Scree PlotThefirst table and scree plot shows the eigenvalues and the amount of variance explained by each successive factor.The remaining5factors have small eigenvalues value.Once the top3factors are extracted,it adds up to84.3%,meaning a great as the explanatory ability for the original information.To reflect the quantitative analysis of the model,we obtain the following factor loading matrix,actually the loadings are in corresponding to the weight(α1,α2 (i)the set ofx i=αi1f1+αi2f2+...+αim f j+εiAnd the relative strength of the common factors and the original attribute can also be manifested.Figure5:Rotated Component MatrixThen,with Rotated Component Matrix above,wefind the common factor F1main-ly expresses four attributes they are:G,Yrs,P,SRS,and logically,we define the com-mon factor generated from those four attributes as the guiding competency of the coach;similarly,the common factor F2mainly expresses two attributes,and they are: Pct and Blp,which can be de defined as the integrated strength of the guided team; while the common factor F3,mainly expresses two attributes:SOS and Blw,which can be summarized into a‘latent attribute’named competition strength.In order to obtain the quantitative relation,we get the following Component Score Coefficient Matrix processed by SPSS.Further,the function of common factors and the original attributes is listed as bel-low:F1=0.300x1+0.312x2+0.023x3+0.256x4+0.251x5+0.060x6−0.035x7−0.053x8F2=−0.107x1−0,054x2+0.572x3+0.103x4+0.081x5+0.280x6+0.372x7+0.142x8 F3=−0.076x1−0,098x2−0.349x3+0.004x4+0.027x5−0.656x6+0.160x7+0.400x8 Finally we calculate out the integrated factor scores,which should be the average score weighted by the corresponding proportion of variance contribution of each com-mon factor in the total variance contribution.And the function set should be:F=0.477F1+0.284F2+0.239F3Figure6:Component Score Coefficient Matrix6.3Result of the modelwe rank all the coaches in the candidate pool by integrated score represented by F.Seetable4:Table4:Integrated scores for best college football coach(show15data due to the limi-tation of space)Rank coaches F1F2F3Integrated factor1Joe Paterno 3.178-0.3150.421 1.3622Bobby Bowden 2.51-0.2810.502 1.1113Bear Bryant 2.1420.718-0.142 1.0994Tom Osborne0.623 1.969-0.2390.8205Woody Hayes0.140.009 1.6130.4846Barry Switzer-0.705 2.0360.2470.4037Darrell Royal0.0460.161 1.2680.4018Vince Dooley0.361-0.442 1.3730.3749Bo Schembechler0.4810.1430.3040.32910John Vaught0.6060.748-0.870.26511Steve Spurrier0.5180.326-0.5380.18212Bob Stoops-0.718 1.0850.5230.17113Bud Wilkinson-0.718 1.4130.1050.16514Bobby Dodd0.08-0.2080.7390.16215John McKay-0.9620.228 1.870.151Based on this model,we can make a scientific rank list for US college football coach-es,the Top5coaches of our model is Joe Paterno,Bobby Bowden,Bear Bryant,TomOsborne,Woody Hayes.In order to confirm our result,we get a official list of bestcollege football coaches from Bleacherreport99Bleacherreport:/articles/890705-college-football-the-top-50-coTable5:The result of our model in football,the last column is official college basketball ranking from bleacherreportRank Our model Integrated scores bleacherreport1Joe Paterno 1.362Bear Bryant2Bobby Bowden 1.111Knute Rockne3Bear Bryant 1.099Tom Osborne4Tom Osborne0.820Joe Paterno5Woody Hayes0.484Bobby Bowden By comparing thoes two ranking list,wefind that four of our Top5coaches ap-peared in the offical Top5list,which shows that our model is reasonable and effective.7Model generalizationOur coach evaluation system model,of which the feasibility of generalization is sat-isfying,can be accommodated to any possible NCAA sports concourses by assigning slight modification concerning specific regulations.Besides,this method has nothing to do with the coach’s gender,or say,both male and female coaches can be rationally evaluated by this system.And therefore we would like to generalize this model into softball.Further,we take into account the time line horizon,making corresponding adjust-ment for the indicator of number of participating games so as to stipulate that the evaluation measure for1913and2013would be the same.To further generalize the model,first let’s have a test in basketball,of which the data available is adequate enough as football.And the specific steps are as following:1.Obtain data from sports-reference10and rule out the coaches who begun theircoaching career earlier than1913.2.Calculate each coach’s adjusted number of participating games,and adjust theattribute—-FF(Number of NCAA Final Four appearance).3.Determine the bottom lines for thefirst round selection to get a pool of candidatesaccording to the coaches’participating games and win-loss percentage,and the ideal volumn of the pool should be from30to40.Hist diagrams are as below: We determine800as the bottom line for the adjusted participating games and0.7 for the win-loss percentage.Coincidently,we get a candidate pool of35in scale.4.Next,we collect the corresponding data of candidate coaches(P’,SRS,SOS etc.),as presented in the table6:5.Processed by z score method and factor analysis based on the8attributes anddata above,we get three common factors andfinal integrated scores.And among 10sports-reference:/cbb/coaches/Figure7:Hist of the basketball coaches’number of games versus and average gamesevery year versus games and win-loss percentagethe top5candidates,Mike Krzyzewski,Adolph Rupp,Dean SmithˇcˇnBob Knightare the same with the official statistics from bleacherreport.11We can say theeffectiveness of the model is pretty good.See table5.We also apply similar approach into college softball.Maybe it is because the popularity of the softball is not that high,the data avail-able is not adequate to employ ourfirst model.How can our model function in suchsituation?First and foremost,specialized magazines like Sports Illustrated,its com-mentators there would have more internal and confidential databases,which are notexposed publicly.On the one hand,as long as the data is adequate enough,we can saythe original model is completely feasible.While under the situation that there is datadeficit,we can reasonably simplify the model.The derivation of the softball data is NCAA’s official websites,here we only extractdata from All-Division part.12Softball is a comparatively young sports,hence we may arbitrarily neglect the re-stricted condition of‘100years’.Subsequently,because of the data deficit it is hard toadjust the number of participating games.We may as well determine10as the bottomline for participating games and0.74for win-loss percentage,producing a candidatepool of33in scaleAttributed to the inadequacy of the data for attributes,it is not convenient to furtheruse the factor analysis similarly as the assessment model.Therefore,here we employsolely two of the most important attributes to evaluate a coach and they are:partic-ipating games and win-loss percentage in the coach’s whole career.Specifically,wefirst adopt z score to normalize all the data because of the differentiation of various dimensions,and then the integrated score of the coach can be reached by the weighted11bleacherreport:/articles/1341064-10-greatest-coaches-in-ncaa-b 12NCAA softball Coaching Record:/Docs/stats/SB_Records/2012/coaches.pdf。
2007美国大学生数学建模竞赛B题特等奖论文
American Airlines' Next Top ModelSara J. BeckSpencer D. K'BurgAlex B. TwistUniversity of Puget SoundTacoma, WAAdvisor: Michael Z. SpiveySummaryWe design a simulation that replicates the behavior of passengers boarding airplanes of different sizes according to procedures currently implemented, as well as a plan not currently in use. Variables in our model are deterministic or stochastic and include walking time, stowage time, and seating time. Boarding delays are measured as the sum of these variables. We physically model and observe common interactions to accurately reflect boarding time.We run 500 simulations for various combinations of airplane sizes and boarding plans. We analyze the sensitivity of each boarding algorithm, as well as the passenger movement algorithm, for a wide range of plane sizes and configurations. We use the simulation results to compare the effectiveness of the boarding plans. We find that for all plane sizes, the novel boarding plan Roller Coaster is the most efficient. The Roller Coaster algorithm essentially modifies the outside-in boarding method. The passengers line up before they board the plane and then board the plane by letter group. This allows most interferences to be avoided. It loads a small plane 67% faster than the next best option, a midsize plane 37% faster than the next best option, and a large plane 35% faster than the next best option.IntroductionThe objectives in our study are:To board (and deboard) various sizes of plane as quickly as possible."* To find a boarding plan that is both efficient (fast) and simple for the passengers.With this in mind:"* We investigate the time for a passenger to stow their luggage and clear the aisle."* We investigate the time for a passenger to clear the aisle when another passenger is seated between them and their seat.* We review the current boarding techniques used by airlines.* We study the floor layout of planes of three different sizes to compare any difference between the efficiency of a given boarding plan as plane size increases and layouts vary."* We construct a simulator that mimics typical passenger behavior during the boarding processes under different techniques."* We realize that there is not very much time savings possible in deboarding while maintaining customer satisfaction."* We calculate the time elapsed for a given plane to load under a given boarding plan by tracking and penalizing the different types of interferences that occur during the simulations."* As an alternative to the boarding techniques currently employed, we suggest an alternative plan andassess it using our simulator."* We make recommendations regarding the algorithms that proved most efficient for small, midsize, and large planes.Interferences and Delays for BoardingThere are two basic causes for interference-someone blocking a passenger,in an aisle and someone blocking a passenger in a row. Aisle interference is caused when the passenger ahead of you has stopped moving and is preventing you from continuing down the aisle towards the row with your seat. Row interference is caused when you have reached the correct row but already-seated passengers between the aisle and your seat are preventing you from immediately taking your seat. A major cause of aisle interference is a passenger experiencing rowinterference.We conducted experiments, using lined-up rows of chairs to simulate rows in an airplane and a team member with outstretched arms to act as an overhead compartment, to estimate parameters for the delays cause by these actions. The times that we found through our experimentation are given in Table 1.We use these times in our simulation to model the speed at which a plane can be boarded. We model separately the delays caused by aisle interference and row interference. Both are simulated using a mixed distribution definedas follows:Y = min{2, X},where X is a normally distributed random variable whose mean and standard deviation are fixed in our experiments. We opt for the distribution being partially normal with a minimum of 2 after reasoning that other alternative and common distributions (such as the exponential) are too prone to throw a small value, which is unrealistic. We find that the average row interference time is approximately 4 s with a standard deviation of 2 s, while the average aisle interference time is approximately 7 s with a standard deviation of 4 s. These values are slightly adjusted based on our team's cumulative experience on airplanes.Typical Plane ConfigurationsEssential to our model are industry standards regarding common layouts of passenger aircraft of varied sizes. We use an Airbus 320 plane to model a small plane (85-210 passengers) and the Boeing 747 for a midsize plane (210-330 passengers). Because of the lack of large planes available on the market, we modify the Boeing 747 by eliminating the first-class section and extending the coach section to fill the entire plane. This puts the Boeing 747 close to its maximum capacity. This modified Boeing 747 has 55 rows, all with the same dimensions as the coach section in the standard Boeing 747. Airbus is in the process of designing planes that can hold up to 800 passengers. The Airbus A380 is a double-decker with occupancy of 555 people in three different classes; but we exclude double-decker models from our simulation because it is the larger, bottom deck that is the limiting factor, not the smaller upper deck.Current Boarding TechniquesWe examine the following industry boarding procedures:* random-order* outside-in* back-to-front (for several group sizes)Additionally, we explore this innovative technique not currently used by airlines:* "Roller Coaster" boarding: Passengers are put in order before they board the plane in a style much like those used by theme parks in filling roller coasters.Passengers are ordered from back of the plane to front, and they board in seatletter groups. This is a modified outside-in technique, the difference being that passengers in the same group are ordered before boarding. Figure 1 shows how this ordering could take place. By doing this, most interferencesare avoided.Current Deboarding TechniquesPlanes are currently deboarded in an aisle-to-window and front-to-back order. This deboarding method comes out of the passengers' desire to be off the plane as quickly as possible. Any modification of this technique could leadto customer dissatisfaction, since passengers may be forced to wait while others seated behind them on theplane are deboarding.Boarding SimulationWe search for the optimal boarding technique by designing a simulation that models the boarding process and running the simulation under different plane configurations and sizes along with different boarding algorithms. We then compare which algorithms yielded the most efficient boarding process.AssumptionsThe environment within a plane during the boarding process is far too unpredictable to be modeled accurately. To make our model more tractable,we make the following simplifying assumptions:"* There is no first-class or special-needs seating. Because the standard industry practice is to board these passengers first, and because they generally make up a small portion of the overall plane capacity, any changes in the overall boarding technique will not apply to these passengers."* All passengers board when their boarding group is called. No passengers arrive late or try to board the plane early."* Passengers do not pass each other in the aisles; the aisles are too narrow."* There are no gaps between boarding groups. Airline staff call a new boarding group before the previous boarding group has finished boarding the plane."* Passengers do not travel in groups. Often, airlines allow passengers boarding with groups, especially with younger children, to board in a manner convenient for them rather than in accordance with the boarding plan. These events are too unpredictable to model precisely."* The plane is full. A full plane would typically cause the most passenger interferences, allowing us to view the worst-case scenario in our model."* Every row contains the same number of seats. In reality, the number of seats in a row varies due to engineering reasons or to accommodate luxury-class passengers.ImplementationWe formulate the boarding process as follows:"* The layout of a plane is represented by a matrix, with the rows representing rows of seats, and each column describing whether a row is next to the window, aisle, etc. The specific dimensions vary with each plane type. Integer parameters track which columns are aisles."* The line of passengers waiting to board is represented by an ordered array of integers that shrinks appropriately as they board the plane."* The boarding technique is modeled in a matrix identical in size to the matrix representing the layout of the plane. This matrix is full of positive integers, one for each passenger, assigned to a specific submatrix, representing each passenger's boarding group location. Within each of these submatrices, seating is assigned randomly torepresent the random order in which passengers line up when their boarding groups are called."* Interferences are counted in every location where they occur within the matrix representing the plane layout. These interferences are then cast into our probability distribution defined above, which gives ameasurement of time delay."* Passengers wait for interferences around them before moving closer to their assigned seats; if an interference is found, the passenger will wait until the time delay has finished counting down to 0."* The simulation ends when all delays caused by interferences have counted down to 0 and all passengers have taken their assigned seats.Strengths and Weaknesses of the ModelStrengths"* It is robust for all plane configurations and sizes. The boarding algorithms that we design can be implemented on a wide variety of planes with minimal effort. Furthermore, the model yields reasonable results as we adjust theparameters of the plane; for example, larger planes require more time to board, while planes with more aisles can load more quickly than similarlysized planes with fewer aisles."* It allows for reasonable amounts of variance in passenger behavior. While with more thorough experimentation a superior stochastic distribution describing the delays associated with interferences could be found, our simulationcan be readily altered to incorporate such advances."* It is simple. We made an effort to minimize the complexity of our simulation, allowing us to run more simulations during a greater time period and mini mizing the risk of exceptions and errors occurring."* It is fairly realistic. Watching the model execute, we can observe passengers boarding the plane, bumping into each other, taking time to load their baggage, and waiting around as passengers in front of them move out of theway. Its ability to incorporate such complex behavior and reduce it are key to completing our objective. Weaknesses"* It does not account for passengers other than economy-class passengers."* It cannot simulate structural differences in the boarding gates which couldpossibly speed up the boarding process. For instance, some airlines in Europeboard planes from two different entrances at once."* It cannot account for people being late to the boarding gate."* It does not account for passenger preferences or satisfaction.Results and Data AnalysisFor each plane layout and boarding algorithm, we ran 500 boarding simulations,calculating mean time and standard deviation. The latter is important because the reliability of plane loading is important for scheduling flights.We simulated the back-to-front method for several possible group sizes.Because of the difference in thenumber of rows in the planes, not all group size possibilities could be implemented on all planes.Small PlaneFor the small plane, Figure 2 shows that all boarding techniques except for the Roller Coaster slowed the boarding process compared to the random boarding process. As more and more structure is added to the boarding process, while passenger seat assignments continue to be random within each of the boarding groups, passenger interference backs up more and more. When passengers board randomly, gaps are created between passengers as some move to the back while others seat themselves immediately upon entering the plane, preventing any more from stepping off of the gate and onto the plane. These gaps prevent passengers who board early and must travel to the back of the plane from causing interference with many passengers behind them. However, when we implement the Roller Coaster algorithm, seat interference is eliminated, with the only passenger causing aisle interference being the very last one to boardfrom each group.Interestingly, the small plane's boarding times for all algorithms are greater than their respective boarding time for the midsize plane! This is because the number of seats per row per aisle is greater in the small plane than in the midsize plane.Midsize PlaneThe results experienced from the simulations of the mid-sized plane areshown in Figure 3 and are comparable to those experienced by the small plane.Again, the Roller Coaster method proved the most effective.Large PlaneFigure 4 shows that the boarding time for a large aircraft, unlike the other plane configurations, drops off when moving from the random boarding algorithm to the outside-in boarding algorithm. Observing the movements by the passengers in the simulation, it is clear that because of the greater number of passengers in this plane, gaps are more likely to form between passengers in the aisles, allowing passengers to move unimpeded by those already on board.However, both instances of back-to-front boarding created too much structure to allow these gaps to form again. Again, because of the elimination of row interference it provides for, Roller Coaster proved to be the most effective boarding method.OverallThe Roller Coaster boarding algorithm is the fastest algorithm for any plane pared to the next fastest boarding procedure, it is 35% faster for a large plane, 37% faster for a midsize plane, and 67% faster for a small plane. The Roller Coaster boarding procedure also has the added benefit of very low standard deviation, thus allowing airlines a more reliable boarding time. The boarding time for the back-to-front algorithms increases with the number of boarding groups and is always slower than a random boarding procedure.The idea behind a back-to-front boarding algorithm is that interference at the front of the plane is avoided until passengers in the back sections are already on the plane. A flaw in this procedure is that having everyone line up in the plane can cause a bottleneck that actually increases the loading time. The outside-in ("Wilma," or window, middle, aisle) algorithm performs better than the random boarding procedure only for the large plane. The benefit of the random procedure is that it evenly distributes interferences throughout theplane, so that they are less likely to impact very many passengers.Validation and Sensitivity AnalysisWe developed a test plane configuration with the sole purpose of implementing our boarding algorithms on planes of all sizes, varying from 24 to 600 passengers with both one or two aisles.We also examined capacities as low as 70%; the trends that we see at full capacity are reflected at these lower capacities. The back-to-front and outside-in algorithms do start to perform better; but this increase inperformance is relatively small, and the Roller Coaster algorithm still substantially outperforms them. Underall circumstances, the algorithms we test are robust. That is, they assign passenger to seats in accordance with the intention of the boarding plans used by airlines and move passengers in a realistic manner.RecommendationsWe recommend that the Roller Coaster boarding plan be implemented for planes of all sizes and configurations for boarding non-luxury-class and nonspecial needs passengers. As planes increase in size, its margin of success in comparison to the next best method decreases; but we are confident that the Roller Coaster method will prove robust. We recommend boarding groups that are traveling together before boarding the rest of the plane, as such groups would cause interferences that slow the boarding. Ideally, such groups would be ordered before boarding.Future WorkIt is inevitable that some passengers will arrive late and not board the plane at their scheduled time. Additionally, we believe that the amount of carry-on baggage permitted would have a larger effect on the boarding time than the specific boarding plan implemented-modeling this would prove insightful.We also recommend modifying the simulation to reflect groups of people traveling (and boarding) together; this is especially important to the Roller Coaster boarding procedure, and why we recommend boarding groups before boarding the rest of the plane.。
数学建模竞赛论文写作方法

1
数学建模竞赛论文的一般结构 数学建模竞赛论文的评判
2
一、数学建模论文的一般结构
摘要 问题重述与分析 问题假设 符号说明 模型建立与求解 模型检验 结果分析 模型的进一步讨论 模型优缺点
3
☻摘要 主要理解 主要方法 主要结果 主要特点 ☻问题重述与分析 —向导
1. 先要对问题进行全面分析,简明建模的依据。 2. 尽量采用成熟的数学方法和已有的模型。 3. 有时针对问题的具体情况,可以先建立简单的、 基本的模型,再作改进或修正。 4. 当然,也要注意应用新方法。”
—— 数模竞赛中建好数学模型之研究
7
☻模型检验
稳定性检验 敏感性检验 误差分析
仿真检验
算法复杂度分析
4. 参加各种类型的数学建模竞赛或模拟赛 (校内赛,地区赛,全国赛,美国赛,…)
25
11
CMCM—96A(最优捕鱼策略) 有的队假设产卵的过程服从正态分布,这样的假 设是可以的,但大大增加了问题的难度。在不失生 物学的真实的前提下,使模型的分析尽量简单的假 设应该是假设鱼群的个体在后四个月的第一天集中 一次产卵。
12
结果的正确性 模型的正确性。
计算的正确性(方法、结果)。 例一:99年“自动化车床”,在计算刀具 发 生故障后的损失时未考虑条件概率,导致计算 错误。 例二:98年“投资组合策略”,使用均方风险 函数,违背题义要求。
好方法的结果一般比较好;但不一定是最好的
清晰性:摘要应理解为详细摘要,提纲挈领 表达严谨、简捷,思路清新 格式符合规范,严禁暴露身份
21
CUMCM评阅标准: 一些常见问题
数学模型最好明确、合理、简洁: 有些论文不给出明确的模型,只是根据赛题的情况, 实际上是用“凑”的方法给出结果,虽然结果大致是 对 的,没有一般性,不是数学建模的正确思路。 有的论文过于简单,该交代的内容省略了,难以看懂
2006年全国百篇优秀博士论文

2006年全国优秀博士学位论文名单(按学科排列)学科门类一级学科名称作者姓名指导教师论文题目学校名称哲学哲学徐英瑾俞吾金维特根斯坦哲学转型期中的“现象学”之谜复旦大学刘怀玉张异宾现代日常生活批判道路的开拓与探索——列斐伏尔哲学思想研究南京大学经济学理论经济学梁琦刘厚俊产业集聚论南京大学法学法学易军王利明法律行为制度研究——以私人自治为中心中国人民大学政治学王保庆文选德传统文化与执政党建设研究湖南师范大学教育学心理学吕勇沈德立汉语双字词语义和语音启动的ERP研究天津师范大学体育学王凯珍任海中国社会转型与城市社区体育发展北京体育大学文学中国语言文学杨宝忠王宁大型字书疑难字考释与研究北京师范大学沈立岩陈洪先秦语言观念及其文学意义南开大学张小艳张涌泉敦煌书仪语言研究浙江大学新闻传播学彭兰方汉奇花环与荆棘——中国网络媒体的第一个十年中国人民大学艺术学毕斐范景中历代名画记校笺与研究中国美术学院历史学历史学李玉偿葛剑雄环境与人:江南传染病史研究(1820-1953)复旦大学韩小忙李范文西夏文正字研究陕西师范大学理学数学章复熹钱敏耦合扩散过程北京大学王春朋尹景学奇异非线性扩散方程的若干问题吉林大学宋永忠沈祖和解奇异线性方程组的迭代法南京大学梁兴蒋继发不动点指标理论及其在K型单调和竞争动力系统中的应用中国科学技术大学胡俊石钟慈弹性力学问题的四边形Locking-free元中国科学院数学与系统科学研究院韩丕功曹道民关于半线性椭圆型方程和方程组的研究中国科学院数学与系统科学研究院物理学刘魁勇赵光达正负电子湮灭中粲夸克偶素的产生北京大学邓富国龙桂鲁量子通信理论研究清华大学钱冬金晓峰3d金属超薄膜的结构和磁性研究复旦大学黄运锋郭光灿量子纠缠态制备、操纵的实验研究中国科学技术大学陈军许宁生新型低维结构冷阴极材料的研制及其电子发射机理研究中山大学张广宇王恩哥微波辅助化学气相沉积制备一维新的碳纳米材料及其结构表征中国科学院物理研究所涂展春欧阳钟灿生物膜弹性的几何理论及碳纳米管的若干物理性质中国科学院理论物理研究所化学王训李亚栋过渡金属氧化物一维纳米结构液相合成、表征及性能研究清华大学赵斌程鹏d-f混合金属配位聚合物的合成和性质研究南开大学张皓杨柏碲化镉纳米晶的制备及其与聚合物的复合吉林大学范杰赵东元介孔材料结构和孔道的模板合成及其在生物和电池中的应用复旦大学李震宇杨金龙新材料物性的第一性原理研究中国科学技术大学郭雪峰朱道本功能分子的设计、合成及原理性的分子尺寸器件的研究中国科学院化学研究所金永东董绍俊纳米结构界面组装及电化学SPR研究中国科学院长春应用化学研究所石峰邓友全非光气含氮化合物羰化催化基础中国科学院兰州化学物理研究所许叶春蒋华良老年痴呆相关蛋白靶标结构与功能关系的分子动力学模拟研究中国科学院上海药物研究所天文学杨小虎褚耀泉宇宙大尺度结构的统计研究中国科学技术大学地理学朴世龙方精云近20年来中国植被对气候变化的响应北京大学大气科学段晚锁穆穆非线性优化方法在ENSO可预报性研究中的应用中国科学院大气物理研究所地球物理学陈耀胡友秋多成份太阳风模型中国科学技术大学地质学窦立荣李任伟苏丹被动裂谷盆地的油气成藏机理和成藏模式中国科学院地质与地球物理研究所生物学文波金力Y染色体、mtDNA多态性与东亚人群的遗传结构复旦大学樊金波贺林精神分裂症侯选基因的传递不平衡分析中国科学院上海生命科学研究院张景明段树民胶质细胞释放的ATP对海马突触传递的抑制作用中国科学院上海生命科学研究院王彪耿建国Slit2在肿瘤新生血管形成中的功能研究中国科学院上海生命科学研究院高华裴钢β-Arrestin2承担G蛋白偶联受体与其它信号通路间通讯的功能中国科学院上海生命科学研究院柳振峰常文瑞菠菜主要捕光复合物2.72Å分辨率的晶体结构研究中国科学院生物物理研究所乔红薛勇彪金鱼草S位点编码的F-box基因AhSLF-S 2 的功能分析中国科学院遗传与发育生物学研究所工学力学冯雪黄克智铁磁材料本构关系的理论和实验研究清华大学丁建文颜晓红低维纳米结构体系的电性质和应力效应湘潭大学机械工程赵景山冯之敬空间并联机构自由度的终端约束分析理论与数学描述方法清华大学周明蔡兰激光层裂法定量测试界面结合强度与诊析技术研究江苏大学魏正英卢秉恒迷宫型滴灌灌水器结构设计与快速开发技术研究西安交通大学光学工程程雪岷王涌天光学系统的智能化设计优化方法的研究北京理工大学王义平饶云江新型长周期光纤光栅特性研究重庆大学材料科学与工程彭奎庆朱静大面积硅纳米线阵列的制备、形成机制及其应用研究清华大学李国强介万奇高电阻Cd1-xZnxTe的晶体生长、性能表征及退火改性西北工业大学佟伟平卢柯纯Fe和38CrMoAl钢的表面纳米化及其渗氮行为研究中国科学院金属研究所冶金工程李谦周国治镁基合金氢化反应的物理化学北京科技大学动力工程及工程热物理周昊岑可法大型电站锅炉氮氧化物控制和燃烧优化中若干关键性问题的研究浙江大学电气工程邹晓兵罗承沐喷气式Z箍缩等离子体实验研究清华大学组合电器局放在线监测外置传感器和复小波抑制干扰的研唐炬孙才新重庆大学究李春光虞厥邦复杂网络建模及其动力学性质的若干研究电子科技大学电子科学与技术中国科学院上海微系统与万青林成鲁零维Ge和一维ZnO纳米结构与器件信息技术研究所控制科学与工程孙凯郑大钟大型电网灾变下基于OBDD的搜索解列策略的三阶段方法清华大学黄罡杨芙清反射式软件中间件原理与技术研究北京大学计算机科学与技术冯元应明生量子信息的分辨、克隆、删除与纠缠转化清华大学土木工程王亚宜彭永臻反硝化除磷脱氮机理及工艺研究哈尔滨工业大学王铁峰金涌气液(浆)反应器流体力学行为的实验研究和数值模拟清华大学化学工程与技术王巧纯陈孔常荧光轮烷分子机器的合成与性能研究华东理工大学地质资源与地质工程陈建平韩德馨中国西北地区侏罗纪煤成油地球化学中国矿业大学矿业工程柏建彪侯朝炯综放沿空掘巷围岩稳定性原理及控制技术研究中国矿业大学纺织科学与工程陈廷黄秀宝熔喷非织造气流拉伸工艺研究东华大学轻工技术与工程廖学品石碧基于皮胶原纤维的吸附材料制备及吸附特性研究四川大学交通运输工程孙会君高自友物流中心选址与库存控制的双层规划模型及求解算法研究北京交通大学船舶与海洋工程郭业才赵俊渭基于高阶统计量的水下目标动态谱特征增强研究西北工业大学兵器科学与技术何心怡蒋兴舟拖曳线列阵波达方位估计方法研究海军工程大学林业工程胡英成顾继友木质复合材料的动态特性研究东北林业大学环境科学与工程陈宝梁朱利中表面活性剂在土壤有机污染修复中的作用及机理浙江大学农学园艺学周艳虹喻景权低温对黄瓜光合机构光能吸收、电子流分配和CO 2 同化的影响及其调控机制浙江大学农业资源利用冯雄汉刘凡土壤中几种常见氧化锰矿物的合成、转化及表面化学性质华中农业大学植物保护崔晓峰周雪平双生病毒DNAβ分子βC1基因的功能研究浙江大学畜牧学宋国隆李德发高油玉米组织化学、超微结构及饲用营养价值研究中国农业大学兽医学王晓佳汪明副粘病毒入侵宿主细胞的分子机制研究中国农业大学医学基础医学陶永光曹亚EB病毒潜伏膜蛋白1调节表皮生长因子受体的分子机制中南大学陈涛涌曹雪涛来源于人树突状细胞的新型癌基因样小G蛋白RabJ的生物学功能研究第二军医大学临床医学王亮春朱学俊伴发Castleman's瘤的副肿瘤性天疱疮发病机理研究北京大学于春媛林东昕基质金属蛋白酶-2基因启动子遗传变异与肺癌及食管癌发生和转移风险中国协和医科大学顾柏炜陈赛娟白血病相关融合基因的克隆和功能研究上海交通大学张琪吴孟超双调控减毒增殖腺病毒CNHK500治疗肝癌的实验研究第二军医大学口腔医学单兆臣王松灵小型猪腮腺放射损伤模型建立及其结构功能变化和水通道基因治疗研究首都医科大学公共卫生与预防医学史春梦程天民真皮来源成体多能干细胞的生物学性状与促进创伤修复的实验研究第三军医大学药学周家国关永源ClC-3蛋白与血管平滑肌细胞容积调节性氯通道的关系及其对Ca 2+ 运动的影响中山大学张彦张志荣基于扩散、膨胀和渗透泵机理的定时脉冲给药系统研究四川大学李蓉涛孙汉董五种五味子属药用植物及东紫苏化学成分和生物活性研究中国科学院昆明植物研究所军事学军事思想及军事历史孙科佳张伊宁论中国特色的军事变革国防大学军队指挥学范淑琴韩文报指数和在密码学中的应用-环上序列的随机性和本原多项式系数分布解放军信息工程大学管理学管理科学与工程马卫民徐寅峰第三方物流配送优化问题及其竞争策略研究西安交通大学农林经济管理谭砚文李崇光中国棉花生产波动研究华中农业大学。
数学建模全国优秀论文范文
数学建模全国优秀论文范文随着科学技术特别是信息技术的高速发展,数学建模的应用价值越来越得到众人的重视,数学建模全国优秀论文1:《浅谈数学建模教育的作用与开展策略》数学建模本身是一个创造性的思维过程,它是对数学知识的综合应用,具有较强的创新性,以下是一篇关于数学建模教育开展策略探究的论文范文,欢迎阅读参考。
大学数学具有高度抽象性和概括性等特点,知识本身难度大再加上学时少、内容多等教学现状常常造成学生的学习积极性不高、知识掌握不够透彻、遇到实际问题时束手无策,而数学建模思想能激发学生的学习兴趣,培养学生应用数学的意识,提高其解决实际问题的能力。
数学建模活动为学生构建了一个由数学知识通向实际问题的桥梁,是学生的数学知识和应用能力共同提高的最佳结合方式。
因此在大学数学教育中应加强数学建模教育和活动,让学生积极主动学习建模思想,认真体验和感知建模过程,以此启迪创新意识和创新思维,提高其素质和创新能力,实现向素质教育的转化和深入。
一、数学建模的含义及特点数学建模即抓住问题的本质,抽取影响研究对象的主因素,将其转化为数学问题,利用数学思维、数学逻辑进行分析,借助于数学方法及相关工具进行计算,最后将所得的答案回归实际问题,即模型的检验,这就是数学建模的全过程。
一般来说",数学建模"包含五个阶段。
1.准备阶段主要分析问题背景,已知条件,建模目的等问题。
2.假设阶段做出科学合理的假设,既能简化问题,又能抓住问题的本质。
3.建立阶段从众多影响研究对象的因素中适当地取舍,抽取主因素予以考虑,建立能刻画实际问题本质的数学模型。
4.求解阶段对已建立的数学模型,运用数学方法、数学软件及相关的工具进行求解。
5.验证阶段用实际数据检验模型,如果偏差较大,就要分析假设中某些因素的合理性,修改模型,直至吻合或接近现实。
如果建立的模型经得起实践的检验,那么此模型就是符合实际规律的,能解决实际问题或有效预测未来的,这样的建模就是成功的,得到的模型必被推广应用。
信息检索练习题(1)
1.小王在某个数据库中检索到了50篇文献,查准率和查全率分别为40%、80%,则全部相关文档有25篇。
2.INTERNET是基于TCP/IP 协议的。
3.文件ABC.001.TXT的后缀名是TXT 。
文件类型是文本文件。
4.多数网页采用HTML编写,这里的HTML指的是:超文本标识语言。
5.目录型搜索引擎主要提供族性检索模式,索引型搜索引擎主要提供特性检索模式。
6.在使用搜索引擎检索时,URL:ustc可以查到网址中带有ustc的网页。
7.根据索引编制方式的不同,可以将搜索引擎分为索引型搜索引擎和网络目录型搜索引擎。
8.按文献的相对利用率来划分,可以把文献分为核心文献、相关文献、边缘文献。
9.定期(多于一天)或不定期出版的有固定名称的连续出版物是期刊。
10.检索工具具有两个方面的职能:存储职能、检索职能。
11.以单位出版物为著录对象的检索工具为:目录。
12.将文献作者的姓名按字顺排列编制而成的索引称为:作者索引。
13.利用原始文献所附的参考文献,追踪查找参考文献的原文的检索方法称为追溯法,又称为引文法。
14.已知一篇参考文献的著录为:”Levitan, K. B. Information resource management. New Brunswick: RutgersUP,1986”,该作者的姓是:Levitan 。
15.检索语言可分为两大类:分类语言、主题词语言。
16.LCC指的是美国国会图书馆分类法。
17.当检索关键词具有多个同义词和近义词时,容易造成漏检,使得查全率较低。
18.主题词的规范化指的是词和概念一一对应,一个词表达一个概念。
19.国际上通常根据内容将数据库划分为:参考数据库、源数据库、混合数据库。
20.查询关键词为短语"DA TA OUTPUT",可以用位置算符(W)改写为:DA TA(W) OUTPUT 。
21.著录参考文献时,对于三个以上的著者,可以在第一著者后面加上et al. ,代表"等人"的意思。
数学建模经典论文五篇
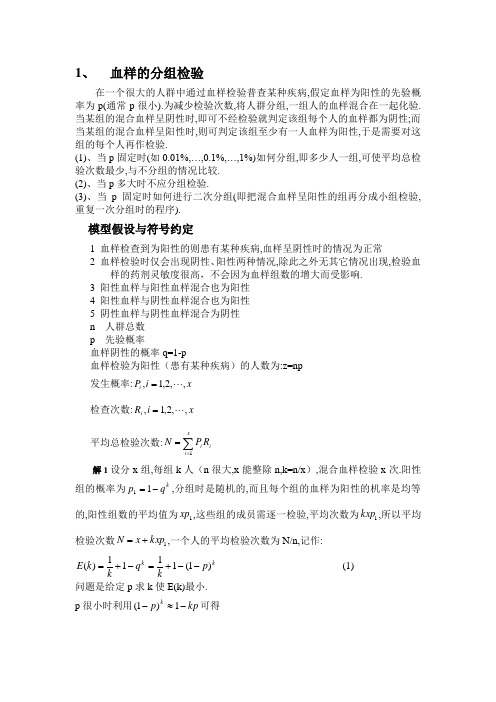
1、 血样的分组检验在一个很大的人群中通过血样检验普查某种疾病,假定血样为阳性的先验概率为p(通常p 很小).为减少检验次数,将人群分组,一组人的血样混合在一起化验.当某组的混合血样呈阴性时,即可不经检验就判定该组每个人的血样都为阴性;而当某组的混合血样呈阳性时,则可判定该组至少有一人血样为阳性,于是需要对这组的每个人再作检验.(1)、当p 固定时(如0.01%,…,0.1%,…,1%)如何分组,即多少人一组,可使平均总检验次数最少,与不分组的情况比较. (2)、当p 多大时不应分组检验.(3)、当p 固定时如何进行二次分组(即把混合血样呈阳性的组再分成小组检验,重复一次分组时的程序).模型假设与符号约定1 血样检查到为阳性的则患有某种疾病,血样呈阴性时的情况为正常2 血样检验时仅会出现阴性、阳性两种情况,除此之外无其它情况出现,检验血样的药剂灵敏度很高,不会因为血样组数的增大而受影响. 3 阳性血样与阳性血样混合也为阳性 4 阳性血样与阴性血样混合也为阳性 5 阴性血样与阴性血样混合为阴性 n 人群总数 p 先验概率血样阴性的概率q=1-p血样检验为阳性(患有某种疾病)的人数为:z=np 发生概率:x i P i ,,2,1, = 检查次数:x i R i ,,2,1, = 平均总检验次数:∑==xi i i R P N 1解1设分x 组,每组k 人(n 很大,x 能整除n,k=n/x ),混合血样检验x 次.阳性组的概率为k q p -=11,分组时是随机的,而且每个组的血样为阳性的机率是均等的,阳性组数的平均值为1xp ,这些组的成员需逐一检验,平均次数为1kxp ,所以平均检验次数1kxp x N +=,一个人的平均检验次数为N/n,记作:k k p kq k k E )1(1111)(--+=-+=(1) 问题是给定p 求k 使E(k)最小. p 很小时利用kp p k -≈-1)1(可得kp kk E +=1)( (2) 显然2/1-=p k 时E(k)最小.因为K 需为整数,所以应取][2/1-=p k 和1][2/1+=-p k ,2当E (k )>1时,不应分组,即:1)1(11>--+k p k,用数学软件求解得k k p /11-->检查k=2,3,可知当p>0.307不应分组.3将第1次检验的每个阳性组再分y 小组,每小组m 人(y 整除k,m=k/y ).因为第1次阳性组的平均值为1xp ,所以第2次需分小组平均检验1yxp 次,而阳性小组的概率为m q p -=12(为计算2p 简单起见,将第1次所有阳性组合在一起分小组),阳性小组总数的平均值为21yp xp ,这些小组需每人检验,平均检验次数为21yp mxp ,所以平均总检验次数211yp mxp yxp x N ++=,一个人的平均检验次数为N/n,记作(注意:n=kx=myx)p q q q mk p p m p k m k E m k -=-+-+=++=1),1()1(111),(211 (3) 问题是给定p 求k,m 使E (k,m )最小.P 很小时(3)式可简化为21),(kmp mkpk m k E ++≈ (4)对(4)分别对k,m 求导并令其等于零,得方程组:⎪⎪⎩⎪⎪⎨⎧=+-=++-0012222kp m kp mp mp k 舍去负数解可得:2/14/3,21--==p m p k (5)且要求k,m,k/m 均为整数.经在(5)的结果附近计算,比较E(k,m),得到k,m 的最与表1比较可知,二次分组的效果E(k,m)比一次分组的效果E(k)更好.2、铅球掷远问题铅球掷远比赛要求运动员在直径2.135m 的圆内将重7.257kg 的铅球投掷在 45的扇形区域内,建立模型讨论以下问题1.以出手速度、出手角度、出手高度 为参数,建立铅球掷远的数学模型;2.考虑运动员推铅球时用力展臂的动 作,改进以上模型.3.在此基础上,给定出手高度,对于 不同的出手速度,确定最佳出手角度 问题1模型的假设与符号约定1 忽略空气阻力对铅球运动的影响.2 出手速度与出手角度是相互独立的.3 不考虑铅球脱手前的整个阶段的运动状态. v 铅球的出手速度 θ 铅球的出手角度 h 铅球的出手高度 t 铅球的运动时间 L 铅球投掷的距离g 地球的重力加速度(2/8.9s m g=)铅球出手后,由于是在一个竖直平面上运动.我们,以铅球出手点的铅垂方向为y 轴,以y 轴与地面的交点到铅球落地点方向为x 轴构造平面直角坐标系.这样,铅球脱手后的运动路径可用平面直角坐标系表示,如图.因为,铅球出手后,只受重力作用(假设中忽略空气阻力的影响),所以,在x 轴上的加速度0=,在y 轴上的加速度g a y -=.如此,从解析几何角度上,以时间 t 为参数,易求得铅球的运动方程:⎪⎩⎪⎨⎧+-==h gt t v y t v x 221sin cos θθ 对方程组消去参数t ,得h x x v gy ++-=)(tan cos 2222θθ……………………………………………(1) 当铅球落地时,即是0=y ,代入方程(1)解出x 的值v ggh gh v g v x θθθθθ2222sin 22cos sin cos sin 2-++=对以上式子化简后得到铅球的掷远模型θθθ22222cos 22sin 222sin g v h g v g v L +⎪⎪⎭⎫ ⎝⎛+=………………………………(2) 问题2我们观察以上两个阶段,铅球从A 点运动到B 点,其运动状态是匀加速直线运动的,加速距离是2L 段.且出手高度与手臂长及出手角度是有一定的联系,进而合理地细化各个因素对掷远成绩的约束,改进模型Ⅰ.在投掷角度为上进行受力分析,如图(3)由牛顿第二定 律可得,ma mg F =-θsin 再由上式可得,θsin g mFa -=………………………………………(3) 又,22022aL v v =-,即22022aL v v += (4)将(3)代入(4)可得,θsin 2222202g L m FL v v -⎪⎭⎫⎝⎛+= ………………………(5) (5)式进一步说明了,出手速度v 与出手角度θ有关,随着θ的增加而减小.模型Ⅰ假设出手速度与出手角度相互独立是不合理的. 又根据图(2),有θsin 1'L h h += (6)由模型Ⅰ,同理可以得到铅球脱手后运动的距离θθθ22222cos 22sin 222sin g v h g v g v L +⎪⎪⎭⎫ ⎝⎛+= 将 (4)、(5)、(6)式代入上式整理,得到铅球运动的距离()⎥⎥⎥⎥⎥⎦⎤⎢⎢⎢⎢⎢⎣⎡⎥⎦⎤⎢⎣⎡-⎪⎭⎫⎝⎛++++-⎪⎭⎫ ⎝⎛+=θθθθθ22220'2220sin sin 22sin 2112sin 2sin 22g L m FL v h g g g L m FL v L 对上式进行化简:将m=7.257kg,2/8.9s m g = 代入上式,再令m h 60.1'= (我国铅球运动员的平均肩高),代入上式进一步化简得,()⎪⎪⎭⎫ ⎝⎛-++-++⨯θθθθθ2222232222sin sin 6.192756.06.19sin 6.19sin 2756.0sin 1L FL v L FL v ………………(7) 所以,运动员投掷的总成绩θcos 1L L S +=问题3给定出手高度,对于不同的出手速度,要确定最佳的出手角度.显然,是求极值的问题,根据微积分的知识,我们要先求出驻点,首先,模型一中L 对θ求导得,g hv g v g hv v g v d dL θθθθθθθθ22224242cos 82sin sin cos 42cos 2sin 2cos +-+=令0=θd dL,化简后为, 0sin cos 42cos 2sin cos 82sin 2cos 2422242=-++θθθθθθθhgv v hgv v v根据倍角与半角的三角关系,将以上方程转化成关于θ2cos 的方程,然后得,hv g g vgh gh222cos +=+=θ (3)()θθ2sin sin 6.192756.051.0222L FL v L -+=从(3)式可以看出,给定铅球的出手高度h ,出手速度v 变大,相应的最佳出手角度θ也随之变大.对(3)式进行分析,由于0,0>>θh ,所以02cos >θ,则40πθ≤<.所以,最佳出手角度为)arccos(212vgh gh +=θ θ是以π2为周期变化的,当且仅当N k k ∈⎪⎭⎫⎝⎛∈±,4,02ππθ时,πθk 2±为最佳出手角度.特别地,当h=0时(即出手点与落地点在同一高度),最佳出手角度︒=45α3、零件的参数设计粒子分离器某参数(记作y )由7个零件的参数(记作x x 12,,…x 7)决定,经验公式为:y x x x x x x x x x x x =⎛⎝ ⎫⎭⎪-⎛⎝ ⎫⎭⎪⨯--⎛⎝ ⎫⎭⎪⎡⎣⎢⎢⎤⎦⎥⎥⎛⎝ ⎫⎭⎪-17442126210361532108542056324211667......y 的目标值(记作y 0)为1.50。
数模
I
II
数 模
2004 年
第 1 卷第 1 期 2004 年 11 月
MATHEMATICALMODELING数模 出品
SHUMO
2004. 1
Vol. 1 No. 1
声
明
本资料仅供参考, 文章作者保留全部权力, 任何将该资料全部或 部分内容用于商业的行为, 均须事先征得作者本人同意。 转载或传播 时,请保持该资料的完整性,并保留该声明。
《数
模》
MATHEMATICAL MODELING
∗ 作者简介: 王瑛,
创始人之一,网站程序员,曾获 2001 年全国大学数学建模竞赛一等奖,现为国防科
技大学硕士研究生。
2
数 模
2004 年
想到付出的努力, 一想到机会的难得, 我们只有鼓足勇气、 坚持到底。 三天过去了, 很快。 那是一段难忘的时光, 可是还有更精彩的生活。 我们拿了全国一等奖, 取得了参 加国际比赛的资格。为了军队的荣誉,我们继续向前。国际比赛的题目本身并不难,难在论文必须用英 文写。也正是因为这点,中国大学生几乎没有什么好成绩。 (国防科大拿过特等奖)基于前人的经验,我 们积极准备英文写作,加强英文资料的检索。更重要的是,我们考虑到“一张图胜过千言万语” ,而中国 人的英语水平毕竟有限,所以图文并茂应该是最佳的信息表达方式。不巧的是,2002 年的国际数学建模 竞赛正好在春节期间进行。 过年也不能休息了, 但是我们心无挂碍, 一心取胜。 当时很投入, 我们一点也 不觉得苦, 只是赶火车回家的时候, 却都在公共汽车上睡着了。 累也累过, 苦也苦过, 国际比赛确实是我 们一生都珍贵的回忆。
- 1、下载文档前请自行甄别文档内容的完整性,平台不提供额外的编辑、内容补充、找答案等附加服务。
- 2、"仅部分预览"的文档,不可在线预览部分如存在完整性等问题,可反馈申请退款(可完整预览的文档不适用该条件!)。
- 3、如文档侵犯您的权益,请联系客服反馈,我们会尽快为您处理(人工客服工作时间:9:00-18:30)。
A Schedule for Lazy but Smart RanchersWe present our three-stage model constructing process in this paper. Firstly, we determine the number of sprinklers to use by analyzing the energy and motion of water in the pipe and examining the engineering parameters of sprinklers available in the market.Secondly, we build a model to determine how to layout the pipe each time the equipment is reinstalled. This model leads to a computer simulation of catch-can tests of the irrigation system and an estimation of both distribution uniformity (DU) and application efficiency of different schemes of where to move the pipe. In this stage, DU is the most important factor we considered. We also found a schedule in which one of the sprinklers will be positioned out of the field in some moves, but it results in higher DU (92.1%) and actually saves more water.In the final stage, we figure out two schedules to irrigate the field. In one schedule, the field receives water evenly in time during a cycle of irrigation (in our schedule, 4 days), while the other one costs least labor force and time. In this stage, the time and labor force required are the most important factors we considered.Our suggested solution, which is easy to implement, includes a detailed timetable and the arrangement of the pipes. It costs 12.5 irrigation hours and 6 equipment resets in every cycle of 4 days to irrigate the field with DU as high as 92.1%.ContentContent (1)Problem Review (3)Assumptions and Definitions (3)The Development of Models (5)Stage1: Water Pressure and Velocity (5)Information and Analysis of Sprinklers (8)Stage2: Scheduling the Irrigation (10)Catch-can Analysis (11)Layout of the Pipe Set (14)Calculation of the Precipitation (17)Scheduling the Irrigation Time (18)Stage3: Schedule Design (19)Evaluation of Results (22)Comparison between Two Designs (22)Strengths and Weaknesses (22)Strengths (22)Weaknesses (22)Further Discussion (23)References (23)Problem Review“Hand-move” irrigation system is one of various techniques for irrigating a field. Pipes with sprinkler heads are put in place across fields, and they are moved by hand at periodic intervals to insure that the whole field receives an adequate amount of water. This type of system is cheaper and easier to maintain but requires a great deal of time and effort to move and set up the equipment at regular intervals.Use this system to irrigate an 80m×30m field and work out a scheme to minimize the amount of time required by a rancher to maintain the irrigation system and maximize the uniformity. Given a pipe set whose total length is 20m, try to determine the number of sprinklers and the spacing between sprinklers and find a schedule to move the pipes, including where to move them. Each pipe has a 10cm inner diameter with rotating spray nozzles that have a 0.6cm inner diameter. At the water source, the pressure is 420kPa and has a flow rate of 150lpm. No part of the field should receive more than 0.75cmph of water, and each part of the field should receive at least 2cm of water every 4 days.Assumptions and Definitions●The weather is assumed to be “fine” while the influence of wind can beneglected.●The whole system is assumed to be “ideal” while evaporation, leaking and otherways of water loss can be neglected.●The water source can be moved and put at any position of the field. In practice, atube can be used to transport water from the pump to the pipe set.●No mainline is assumed to exist so that all pipes join together and can be put atany position of the field.●The time for a rancher to uncouple, move and reinstall the pipe set is assumed tobe half an hour.●The discharge of any sprinkler is assumed to be the same.●The manufacturer design pressure of sprinklers is assumed to be about 400kPawhich is a most appropriate pressure in this problem and the type of rotating sprinkler is impact driven sprinkler (see details in Information & Analysis of Sprinklers section).●The diameter of the riser is assumed to be the same as that of the pipe.●The water pressures in pipes are assumed to be the same. In practice, there is aslight difference.Table 1.Variables.Variable Definition Units p in Water pressure in the pipe before a junction kPa p out Water pressure in the pipe after a junction kPa p up Water pressure at the sprinkler upon a junction kPa v in Water velocity in the pipe before a junction m/s v out Water velocity in the pipe after a junction m/s v up Water velocity at the sprinkler upon a junction m/sA in Section area in the pipe before a junction cm2 A out Section area in the pipe after a junction cm2 A up Section area at the sprinkler upon a junction cm2h Height of the sprinkler upon the pipe m∆t Change in time sv source Water velocity of the water source m/s n Number of sprinklers - distr(r) Distribution function of precipitation profile - p Precipitation rate - R Sprinkling range m r Distance from a sprinkler m r i Distance from the i th sprinkler m αObliquity of the precipitation profile rad pr(r) Precipitation function of one sprinkler cm/min DU Distribution Uniformity of an irrigation system -Table 2.Constants.Variable Definition Value ρDensity of water 1.0kg/Lg Acceleration of gravity 9.8m/s2Problem AnalysisOur goal is to determine the number of sprinklers and the spacing between sprinklers and find a schedule to move the pipes, including where to move them.Our approach can be divided into three stages.First, determine the number of sprinklers. In order to achieve the goal, we figure out the pressure and velocity of water from each sprinkler and then determine possible sprinkler number according to some engineering data.Second, determine where to put the pipes. We consider some major factors such as sprinkling time, moving time and distribution uniformity (DU) while DU is especially important for the purpose of saving time. Since the pipe positions depend on the sprinkler number and the precipitation profile, we just work out some problem specific cases. However, our method can be used to solve any practical cases.Third, determine the schedule to move the pipes. Referring to the water need of the field, a schedule is made to minimize the time cost, which, obviously, is closely related to the positions of the pipes to move.The Development of ModelsStage1: Water Pressure and VelocityFigure 1. Overall sketch map with 4 sprinklers, 4 junctions numbered from 1 to 4.The pressure of the shadow area is the same due to the last assumption.Figure 2. Sketch map at one junction.We apply the law of conservation of energy to solve.The work done by the forces ist v A p t v A p t v A p s F s F s F out out out up up up in in in out out up up in in ∆-∆-∆=--The decrease of potential energy is thv gA mgh up up ∆-=-ρ The increase in kinetic energy is 222222212121212121in in in out out out up up up in out up tv v A tv v A tv v A mv mv mv ∆-∆+∆=-+ρρρ Putting these together, because of the law of conservation of energy, gets=∆-∆-∆-∆th v gA t v A p t v A p t v A p up up out out out up up up in in in ρ222212121in in in out out out up up up tv v A tv v A tv v A ∆-∆+∆ρρρAs the fluid is incompressible, outout up up in in v A v A v A += The diameters are all the same: 2)2/10(*cm A A A out up in π=== According to assumptions, at every junction kPa p p out in 420== nv v source up /= when (1)(2) (3)(4)(5)s m cm L v source /3183.0)2/10(*min /1502==πTherefore, from (2),(3),(5), for the i th junction, its )11(n i v v source in --= and)1(n i v v source out -=Put (1),(2),(3),(4),(5) all together ,we can obtain p up at every junctions.Table 3.Pressure at every sprinkler when h =1m and n =4.Junction No. P up (Pa)1 4103142 4102573 4102194 410200In fact , at the last (i.e. the n th ) junction,n v v v sourceup in ==0=out vPut into (1), we can getgh p p in up ρ-=which means the pressure at the last sprinkler is independent of n.Commonly, h is about 0.5m to 1.5m, and even if assume h =1.5m, the v up at the last junction will be 405300Pa, not far from 420kPa. (if h =0.5m, the last v up will be 415100Pa)From these equations, we can also know that the last v up is the v up that differs most from 420KPa, and the v up at the first junction is the v up that close to 420kPa most (and below 420kPa),the values of v up are decreasing slowly from junction 1 to n.So we can come to this conclusion: all the values of v up at every junction will be very close (all about 400kPa, below 420kPa and close to 420kPa), no matter how many sprinklers are. That‟s why we assume “design pressure of sprinklers is assumed to be about 400 kPa” in assumptions.Information and Analysis of SprinklersTable 4.Data of sprinklers.[2](Medium pressure sprinklers have the best application uniformity.)Type Design Pressure (kPa) Range (m) Discharge (m 3/hour)Low Pressure Sprinkler (Low-Range Sprinkler)<200 <15.5 <2.5 Medium Pressure Sprinkler (Medium-Range Sprinkler)200-500 15.5-42 2.5-32 High Pressure Sprinkler (High-Range Sprinkler)>500 >42 >32 There are 5 different types of rotating sprinklers among which the impact driven sprinkler is the most widely used. In this article, we assume that the rotating sprinkler is impact driven sprinkler. Some rotating sprinklers have a sector mechanism that can wet either a full circle or a sector, while rotating sprinklers without sector mechanism can only wet a circle.There are three main structure parameters of sprinklers: intake line diameter, nozzle diameter, nozzle elevation angle.An experiential formula is used to calculate the spraying range of an impact driven sprinkler:45.0487.070.1ph d Rwhere d is the nozzle diameter, h p is the operational pressure head.We have looked up a wide range of different models of impact driven sprinklers, the following are the models with 6mm nozzle diameter. The manufactory and some other information are omitted here.[2]Table 5.Commonly available nozzle types whose diameter is 6mm.Model Nozzle diameter (mm) Design pressure (kPa) Discharge (m 3/hour) Range (m)PY 115 6 200 300 1.23 1.51 15.0 16.5PY 120 6 300 400 2.17 2.50 18.0 19.5PY 1S20A 6*4 300 400 2.99 3.41 17.5 19.0PY 1S20 6 300 400 2.22 2.53 18.0 19.515PY 222.5 6 350 400 2.40 2.56 17.0 17.515PY 230 6 350 400 2.40 2.56 18.0 18.5Sprinklers with higher manufacturer design pressure tend to have larger wetted diameters. However, deviations from manufacturer‟s recommended pressure may have the opposite effect (increase in pressure, decrease in diameter), and uniformity will probably be compromised.The following picture shows typical precipitation distribution of one sprinkler in low, correct, and high sprinkler pressure.Figure 3. Relation between pressure and precipitation distribution.[2](a) Pressure is too low (b) Pressure is ok (c) Pressure is too highIn practice, people use catch-can data to generate precipitation profile of a "hand move" irrigation system. That is to put catch-cans evenly in the field, and, after irrigation, the precipitation profile can be portrayed by the amounts of water contained in each catch-can (Figure 4).[3]Figure 4. Catch-can test.[3]One measure of how uniformly the water is applied to the field is Distribution Uniformity (DU), which is defined as:[3]%100_______⨯=rateion precipitat average quarter low of rate ion precipitat average DUUsually, DU s of less than 70% are considered poor, DU s of 70 - 90% are good, and DU s greater than 90% are excellent. In short, bad DU means that either too much water is applied, costing unnecessary expense, or too little water is applied, causing stress to crops. There must be good DU before there can be good irrigation efficiency.[4]To simplify our calculation, we approximate the precipitation profile of a single sprinkler (in Figure 3(b)) to a function: distr(r), which means the relative precipitation rate in the position with a distance r from the sprinkler (Figure 5).Figure 5. The precipitation rate plotted vs. the distance to the sprinkler.In this problem‟s case, surely w e should use medium pressure sprinklers (see Table 4).And In Table 5, for those sprinklers with a 6mm-diameter nozzle and working at 400kPa (as we assumed), their discharge is 2.5-3.5m 3/hour and spraying range is 18.5,19 or 19.5m. From now on, we‟ll use 19m as the range of sprinklers concerned.Note the discharge of the source is150 L/min = 9 m 3/hour ,thus, to fit every sprinkler‟s actual discharge to the design discharge, the number of sprinklers we ‟ll install should be 3 or 4. It is because 9/3=3 or 9/4=2.25, which is close to or within the range of the 2.5-3.5m 3/hour.Stage2: Scheduling the IrrigationActually, a schedule to move the pipes includes both where and in how long an interval to move them. For the previous one, we just imagine a fixed irrigation system consisting of several 20m pipes. If the system can nicely, i.e. with high Distribution Uniformity (DU), meet the needs of the crops, then the way of moving the pipe in the problem is just to move it from one pipe‟s position to another in the system. So, we‟ll determine where to move the pipe by laying out a system of several 20m pipes, and then decide for how long we should water the field before making a next move. First, (*)we use a simulation of catch-can analysis to choose a layout with a high DU. Catch-can AnalysisSince the water sprayed by a particular sprinkler has a determined distribution: distr(r), as we‟ve already defined, we use the following method to simulate the catch-can test.For rectangular spacing (Figure 6 Left), we consider the rectangular region between four adjacent sprinklers. In our simulation, we pick 900 positions evenly distributed in the region. For each position, we calculate its relative precipitation rate p:∑=iir distrp)(r i is the distance from the position to a sprinkler considered. Thus , for the i th position, we got p i,(1≤i≤900). With Equation (*), we then calculate the DU of this irrigation system.Figure 6. Left: Rectangular spacing; Right: Triangular spacing.As we‟ve already deduced, the number of the sprinklers should be 3 or 4, thus the sprinkler distance will be 10m (20m/(3-1)) or 6.67m (20m/(4-1))1. So the DU is a function of the lateral distance. And this can also be applied for triangular spacing (Figure 6 Right). After the simulation, we get:1That the sprinkler distance is evenly distributed along the pipe is because that it will have a higher DU and it is easy to operate.Figure 7. DU plotted vs. lateral distance, in 4 different situations.The simulation shows that when lateral distance ≤20, DU is acceptable (≥90%), regardless of the spacing and whether the sprinkler distance is 6.67m or 10m. But since larger lateral distance will result in smaller amount of time required to irrigate the field (the number of moves to make will be less), we pick 20m as the lateral distance. Figure 8and Figure 9show the precipitation profile for the irrigation systems with sprinkler distance 10m and lateral distance 20m.Figure 8.Left: Precipitation profile for rectangular spacing with sprinkler distance 10m and lateral distance 20m; right: the 3D form of the precipitation profile.DU=98.1%.Figure 9. Left: Precipitation profile for triangular spacing with sprinkler distance 10m and lateral distance 20m; right: the 3D form of the precipitation profile.DU=98.7%.Considering that the field (30m*80m) is not relatively large enough to implement triangular spacing when the pipe is 20m long, we will use rectangular spacing with an only 0.7% neglectably weaker DU. Before we layout the pipe set, we should first determine the max distance from the rim of the field to the sprinklers satisfying that the DU can be acceptable.We simulate a catch-can test on the rectangular region on the rim of the field as in Figure 10.Figure 10. Region to simulate a catch-can test.The result is in Figure 11. Thus, we can see that, the max length between the rim of the field and the sprinklers is 5m with an acceptable DU of 82.7%.Figure 11. DU plotted vs. distance from the rim to the sprinklerin 2 different situationsLayout of the Pipe SetAccording to the analysis above, having 3 or 4 sprinklers along the pipe only results in a slight difference. Considering that the spraying radius (19m) is too large compared with the sprinkler distance 6.67m when having 4 sprinklers, we choose to have 3. Thus the only two feasible layouts of the whole system exist 1(Figure12 and Figure 13). Simply speaking, Layout 1 implies that it requires 5 times of moving and setting up the pipes while Layout 2 requires 6. But it‟s too early to judge which is better.Figure 12. Layout 1.Figure 13. Layout 2.1We are not considering the situation when the pipes are not parallel to the edge of the field, because layout of this kind is not practical.For further estimation, we should calculate DU (Distribution Uniformity) of both layouts. The result from the simulation of catch-can tests is shown in following figures:Figure 14. Catch-can test simulation result of layout 1.Figure 15. Catch-can test simulation result of Layout 2.We decide to abandon Layout 1 because it has a very poor DU. After slightly changing the lateral distance in Layout 2, we finally achieve a best DU of 89.5% in Layout 3 (see in Figure 16):Figure 16. Upper: Layout3; Lower: Catch-can test simulation result of Layout 3.Then, if we are brave enough to move some sprinklers out of the field, we‟ll achieve a higher DU in Layout 4 (see in Figure 17):Figure 17. Upper: Layout4; Lower: Catch-can test simulation result of Layout 4.Calculation of the PrecipitationIn order to meet the problem‟s constraints that in any part of the field,a) the precipitation rat e ≥ 2 cm/4 days………………(Constraint A),b) the precipitation rate ≤ 0.75 cm/hour………………(Constraint B),we should calculate the precipitation rate of the system in Layout 4 before scheduling the interval to irrigating the field and to move the pipe.The precipitation area of a sprinklershould be a circle with a radius R , as Figure18 shows. The profile of the precipitation ratedistribution is in Figure 5. In order to figureout the precipitation rate at a certain pointwhose distance from the sprinkler is r, wefirstly calculate the angle α in Figure 5. As wenormalize the distribution, we get⎰=⋅-R rdr r R 012tan )(πα, so 33tan R πα=, then the precipitation rate v Rr R r R v r pr 3)(3tan )()(πα-=-=, where R=19m, v=50lpm.With Matlab , we calculated the precipitation rate at each point in the 80m×30m field, with the irrigation system working only once (see in Figure 19 Right ) and after a complete cycle of moving the equipment and irrigating (see in Figure 19 Left). Figure 18. Precipitation area of a single sprinkler.Figure 19. Precipitation rate of water in the field with Layout 4.Left: the whole effect of 6 pipes together;Right: the effect of a 20m pipe working alone.Scheduling the Irrigation TimeFigure 19 Right shows that when the sprinklers (only one 20m pipe at a time) are working, the maximum precipitation rate is0.02561cm/min. To satisfy Constraint A, the period of irrigation should be less than=min/02561.0/75.0cm hour cm 29.30 min per hour. Because the smaller the period of irrigation is, the more frequently the farmer should stop to move the pipe, we thus choose a large but easy to implement one:25 min per hour.Figure 19 Left shows that after a complete cycle of irrigation the whole field, i.e. the equipment has been moved to and irrigated every required place of the field, and the minimum precipitation rate is0.01728 cm/min. To satisfy Constraint B, the period of irrigation should be longer than=min/01728.04/2cm days cm 115.7 min every 4 days. To meet this, in every 4 days, we plan to irrigate the same place 5 times, every time lasts 25 minutes, that is 125 minutes, well satisfies Constraint B.With the same method, we calculate the same parameters for Layout 3, and list the comparison in Table 6:Comparison between Layout 3 and Layout 4.Layout 3 Layout 4 Min precipitation rate (cm/min) 0.01598 0.01728 Total Irrigation time every 4 days (min) 150×6125×6DU, Distribution Uniformity 89.5% 92.1% It is clearly shown that Layout 4 not only has higher DU than Layout 3, but also saves 16.7% of water, in other words, has higher application efficiency, though one of its sprinklers is positioned out of the field in some situation. This is because that Layout 3 has a smaller min precipitation rate which leads to more irrigation time in order to satisfy Constraint A. So we choose Layout 4 as our solution.Stage3: Schedule DesignAs we‟ve discussed in the previous stage, our schedules will be able to achieve a DU as high as 92.1% after a cycle of 4-day-irrigation. We have two concrete design of irrigation timetable.The first design make the least moving time but, to some extent, is not so “average” as it gathers sprinkling processes of the same sprinkler together. (Table 7) The second design need more moving time but, as a kind of compensation, is more “average” (for instance, the field receives water much more evenly in time) than the first design. (Table 8)The first schedule for every four days(…*‟ means it is required to set up the pipe set in the referred position before irrigation. And the position code refers to pipe‟s position in Figure 17)Day Time Position code 1 7:00~7:25 1*8:00~8:25 19:00~9:25 110:00~10:25 111:00~11:25 113:00~13:25 6*14:00~14:25 615:00~15:25 62 7:00~7:25 68:00~8:25 69:00~9:25 2*10:00~10:25 211:00~11:25 213:00~13:25 214:00~14:25 215:00~15:25 4*3 7:00~7:25 48:00~8:25 49:00~9:25 410:00~10:25 411:00~11:25 3*13:00~13:25 314:00~14:25 34 7:00~7:25 38:00~8:25 39:00~9:25 5*10:00~10:25 511:00~11:25 513:00~13:25 514:00~14:25 5Table 8.The second schedule for every four days(position code refers to Figure 16)Day Time Position code 1 7:00~7:25 18:00~8:25 59:00~9:25 310:00~10:25 411:00~11:25 213:00~13:25 614:00~14:25 115:00~15:25 52 7:00~7:25 38:00~8:25 49:00~9:25 210:00~10:25 611:00~11:25 113:00~13:25 514:00~14:25 315:00~15:25 43 7:00~7:25 28:00~8:25 69:00~9:25 110:00~10:25 511:00~11:25 313:00~13:25 414:00~14:25 24 7:00~7:25 68:00~8:25 19:00~9:25 510:00~10:25 311:00~11:25 413:00~13:25 214:00~14:25 6Evaluation of ResultsComparison between Two DesignsTable 9.Comparison between Design 1 and Design 2.Parameters in one cycle of irrigationDesign 1 Design 2(4days)Equipment reset time (one reset cost3 1530min as assumed) (hour)Irrigation time (hour) 12.5 12.5DU, Distribution Uniformity 92.1% 92.1%Actually, Design 1 is the most time effective and labor saving schedule based on Layout 4. If the water source, i.e. the pump, has a timing mechanism (there is such product in market), the whole irrigation only costs 3 hours labor time every 4 days. But as we‟ve discussed, Design 2 has a more “average”irrigation, which may be better for crops or plants. So it is easy to arrange a more compromising schedule good for plants and with longer but acceptable required labor time.It is also worthy mentioning that with the sector mechanism, we can control the rotating range of the sprinkler on the edge of or out of the field to reduce the water waste.Strengths and WeaknessesStrengths●We use real data of sprinklers to determine the parameters of the sprinklers we choose anddetermine the number of sprinklers.●We establish a model based on the engineering knowledge of sprinklers, and findout the overall precipitation distribution, and then manage to find out an optimal schedule. All the results are based on calculations.●Our model to analyze the layout of the irrigation system is sprinkler-independent.This means, for whatever kind of sprinkler, if its single precipitation profile is known (e.g. though a real catch-can test), we can determine the precipitation profile across the whole field.●The placement and schedule is very clear and easy to implement. Weaknesses●Water pressure in the pipe may diverse, and so the discharge of the sprinklersmay not be exactly the same.Further DiscussionThe analysis should further include the consideration of wind, evaporation, the characters of the soil type and penetration.References[1] Wikipedia, the free encyclopedia - entry: Bernoulli's equation,/wiki/Bernoulli%27s_equation[2]Handbook of sprinkling irrigation engineering, Water Resources and Electric Power Press,1989:p.32-36,40-42,44[3]Gary P. Merkley , Richard G. Allen, Sprinkle and Trickle Irrigation Lecture Notes, Utah State University, Fall Semester 2004,/documents/sprinkle%20and%20trickle%20irrigation.pdf:p.25-27,29,40[4]RainBird - Distribution Uniformity for Sprinkler Irrigation/ag/du.htm。