矢步解列说明书
SSD540U失步解列说明书V1.00

版本声明
本说明书适用于基本型的 SSD 540U 失步解列装置。如基本型的 SSD 540U 装置无法满足需求以随装置 提供的工程说明为准,本说明书仅供参考。 本说明书包含技术内容介绍、使用说明和现场验收说明。 本说明书适用于 SSD 540U 失步解列装置 V1.00 版本保护软件。
产品说明书版本修改记录表
国 电 南 自 Q/GDNZ.J.01.86-2008 标准备案号:148-2008
SSD 540U 失步解列装置 说 明 书
国电南京自动化股份有限公司
GUODIAN NANJING AUTOMATION CO.,LTD
SSD 540U 失步解列装置 说明书
V 1.00
国电南京自动化股份有限公司 2011 年 7 月
10 9 8 7 6 5 4 3 2 1 序号 V1.00 说明书版本号 修 第一版 改 摘 要 2011.7 修改日期
*
业务联系及服务
电话:(025)51183776 传真: (025)51183776
* * *
本说明书可能会被修改,请注意核对实际产品与说明书的版本是否相符,本公司根据用户需求采用最
目
安全声明 版本声明
录
1.装置简介 ........................................................................................................................................................................ 1 1.1 主要用途.................................................................................................................................................................. 1 1.2 基本功能及技术特点 ............................................................................................................................................. 1 2.技术参数 ........................................................................................................................................................................ 3 2.1 2.2 2.3 2.4 2.5 2.6 2.7 额定电气参数 ......................................................................................................................................................... 3 主要技术指标 ......................................................................................................................................................... 3 环境条件 ................................................................................................................................................................. 4 绝缘性能 ................................................................................................................................................................. 4 耐湿热性能 ............................................................................................................................................................. 4 电磁兼容性 ............................................................................................................................................................. 4 机械性能 ................................................................................................................................................................. 5
电厂失步解列装置培训、失步解列装置介绍、失步解列主要组成部分、功能及动作逻辑介绍、日常维护注意事项

装置组成
• 型号:UFV-200F4
输入两回线路的三相相电压和三相电流,判断两条线路的失步
情况,具有两轮失步解列输出。
“
正面面板布置图。 “运行”灯是绿色,装置正常运行时闪烁; “启动”灯是红色,装置进入启动状态后点亮,启动状态 退出时自动熄灭; “动作”灯是红色,装置动作出口后点亮,按“信号复归 ”后熄灭; “异常”灯是红色,装置异常时点亮,异常状态消失后自 动熄灭; “PT断线”灯是红色,装置发生电压回路断线时点亮,电 压正常后自动熄灭; “装置闭锁”灯是红色,当装置出现异常足以影响到装置 运行时,该灯点亮,异常状态消失后自动熄灭;
Ⅰ—>Ⅳ,则判为:振荡中心在装置安装处附近(送端)
Ⅳ—>Ⅰ,则判为:振荡中心在装置安装处附近(受端)
2. 装置定值
a) Uls:失步振荡解列动作区范围低电压定值; b) Power Sign Set :失步振荡的事故前功率方向选择
。 P<0:Y/N (事故前功率为正允许/不允许失步解列动 作); P>0:Y/N (事故前功率为正允许/不允许失步解列动作) ;
数可验证相关的判断逻辑。 b) 采用继电保护仪试验
通过设置保护仪的两机模型的阻抗参数和TA极性等 参数可验证相关的判断逻辑。
1、线路1低频功能 f≤flqs1 t≥tflqs1 低频启动 f ≤ fls1 t≥tfls1 低频动作,输出第2轮 若频率变化率df/dt≥ df/tb1,则认为由于负荷反 馈,高次谐波,电压回路接触不良等原因引起频 率变化异常,闭锁低频功能。
• SCM-380(开入光隔离插件)
• SCM-320(通信插件)用于装置间的通信功能,不同的装置间可以通过本板进行快速 交换数据,达到区域控制的目
051101UFV-200F失步解列装置技术及使用说明书v1.0介绍

UFV-200F型失步解列装置 技术及使用说明书
(Ver1.0)
国电自动化研究院稳定技术研究所 南京南瑞集团公司稳定技术分公司 二零零四年十月
南瑞稳定
UFV-200F 失步解列装置技术及使用说明书
编写:邵俊松,曹一中 审核:李雪明 批准:方勇杰
南京南瑞集团公司稳定技术分公司版权所有2004.10
Ver1.0
本公司保留对此说明书修改的权利,本说明书和产品今后可能会有小的改动,请 注意核对实际产品与说明书的版本是否相符。 更多产品信息,请访问互联网: 技术支持 电话:025-83460421 传真:025-83460422 产品订购 电话:025-83429715 传真:025-83429516
2.4.1 2.4.2 2.4.4 2.4.5 2.4.6 2.4.7 2.4.7 电气量测量精度 ....................................................................................................4 开关量输入 ............................................................................................................4 电磁兼容性、绝缘耐压性及装置遵循的标准 ....................................................4 输出接点容量 ........................................................................................................5 通信接口 ................................................................................................................5 输入输出接口 ........................................................................................................5 供电电源 ................................................................................................................6
omniidl
1.4
Forward-declared interfaces
interface I; interface J { attribute I the_I; };
If you have an IDL file like:
then omniidl will normally issue a warning:
test.idl:1: Warning: Forward declared interface ‘::I’ was never fully defined
2 -Idir -E -Ycmd -N -T -Wparg[,arg. . . ] -bback-end -Wbarg[,arg. . . ] -nf -k -K -Cdir -i -d -pdir -V -u -v
1
INTRODUCTION
Include dir in the preprocessor search path. Only run the preprocessor, sending its output to stdout. Use cmd as the preprocessor, rather than the normal C preprocessor. Do not run the preprocessor. Use a temporary file, not a pipe, for preprocessor output. Send arguments to the preprocessor. Run the specified back-end. For the C++ ORB, use -bcxx. Send arguments to the back-end. Do not warn about unresolved forward declarations. Keep comments after declarations, to be used by some back-ends. Keep comments before declarations, to be used by some back-ends. Change directory to dir before writing output files. Run the front end and back-ends, then enter the interactive loop. Dump the parsed IDL then exit, without running a back-end. Use dir as a path to find omniidl back-ends. Print version information then exit. Print usage information. Verbose: trace compilation stages.
失步解列装置通用技术规范

失步解列装置通用技术规范失步解列装置通用技术规范本规范对应的专用技术规范目录失步解列装置通用技术规范失步解列装置采购标准技术规范使用说明1. 本物资采购标准技术规范分为通用部分、专用部分。
2. 项目单位根据需求选择所需设备的技术规范。
技术规范通用部分条款、专用部分标准技术参数表和使用条件表固化的参数原则上不能更改。
3. 项目单位应按实际要求填写“项目需求部分”。
如确实需要改动以下部分,项目单位应填写专用部分“项目单位技术差异表”,并加盖该网、省公司物资部(招投标管理中心)公章,与辅助说明文件随招标计划一起提交至招标文件审查会:1)改动通用部分条款及专用部分固化的参数;2)项目单位要求值超出标准技术参数值范围;3)根据实际使用条件,需要变更环境温度、湿度、海拔高度、耐受地震能力、用途和安装方式等要求。
经招标文件审查会同意后,对专用部分的修改形成“项目单位技术差异表”,放入专用部分表格中,随招标文件同时发出并视为有效,否则将视为无差异。
4. 投标人逐项响应技术规范专用部分中“1标准技术参数表”、“2项目需求部分”和“3投标人响应部分”三部分相应内容。
填写投标人响应部分,应严格按招标文件技术规范专用部分的“招标人要求值”一栏填写相应的投标人响应部分的表格。
投标人还应对项目需求部分的“项目单位技术差异表”中给出的参数进行响应。
“项目单位技术差异表”与“标准技术参数表”和“使用条件表”中参数不同时,以差异表给出的参数为准。
投标人填写技术参数和性能要求响应表时,如有偏差除填写“投标人技术偏差表”外,必要时应提供证明参数优于招标人要求的相关试验报告。
5. 对扩建工程,如有需要,项目单位应在专用部分提出与原工程相适应的一次、二次及土建的接口要求。
6. 技术规范范本的页面、标题等均为统一格式,不得随意更改。
7. 一次设备的型式、电气主接线和一次系统情况对二次设备的配置和功能要求影响较大,应在专用部分中详细说明。
目次失步解列装置采购标准技术规范使用说明 (43)1总则 (45)1.1引言 (45)1.2卖方职责 (45)2技术规范要求 (45)2.1使用环境条件 (45)2.2装置额定参数 (46)2.3装置功率消耗 (46)2.4装置总的技术要求 (46)2.5柜结构的技术要求 (49)3试验 (50)3.1工厂试验 (50)3.2现场试验 (50)4技术服务、设计联络、工厂检验和监造 (50)4.1技术文件 (50)4.2设计联络会议 (51)4.3工厂验收和现场验收 (51)4.4质量保证 (52)4.5项目管理 (52)4.6现场服务 (52)4.7售后服务 (52)4.8备品备件、专用工具、试验仪器 (52)失步解列装置通用技术规范1总则1.1引言投标人应具备招标公告所要求的资质,具体资质要求详见招标文件的商务部分。
6Differential Absorption Spectroscopy
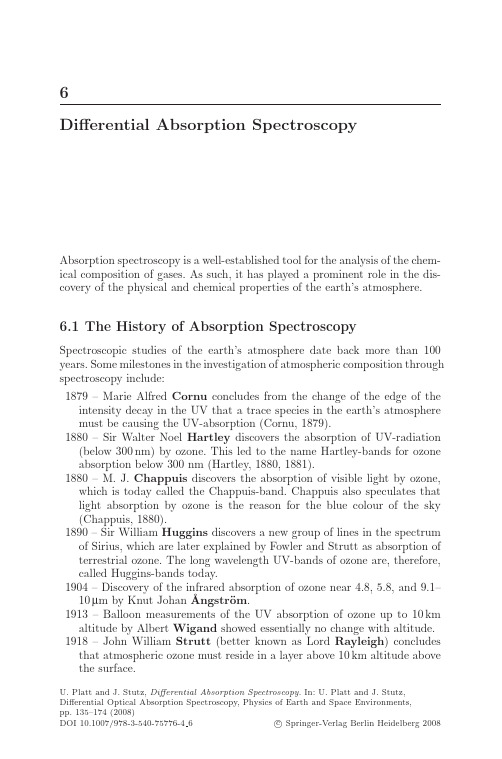
6Differential Absorption SpectroscopyAbsorption spectroscopy is a well-established tool for the analysis of the chem-ical composition of gases.As such,it has played a prominent role in the dis-covery of the physical and chemical properties of the earth’s atmosphere. 6.1The History of Absorption SpectroscopySpectroscopic studies of the earth’s atmosphere date back more than100 years.Some milestones in the investigation of atmospheric composition through spectroscopy include:1879–Marie Alfred Cornu concludes from the change of the edge of the intensity decay in the UV that a trace species in the earth’s atmosphere must be causing the UV-absorption(Cornu,1879).1880–Sir Walter Noel Hartley discovers the absorption of UV-radiation (below300nm)by ozone.This led to the name Hartley-bands for ozone absorption below300nm(Hartley,1880,1881).1880–M.J.Chappuis discovers the absorption of visible light by ozone, which is today called the Chappuis-band.Chappuis also speculates that light absorption by ozone is the reason for the blue colour of the sky (Chappuis,1880).1890–Sir William Huggins discovers a new group of lines in the spectrum of Sirius,which are later explained by Fowler and Strutt as absorption of terrestrial ozone.The long wavelength UV-bands of ozone are,therefore, called Huggins-bands today.1904–Discovery of the infrared absorption of ozone near4.8,5.8,and9.1–10μm by Knut Johan˚A ngstr¨o m.1913–Balloon measurements of the UV absorption of ozone up to10km altitude by Albert Wigand showed essentially no change with altitude. 1918–John William Strutt(better known as Lord Rayleigh)concludes that atmospheric ozone must reside in a layer above10km altitude above the surface.U.Platt and J.Stutz,Differential Absorption Spectroscopy.In:U.Platt and J.Stutz,Differential Optical Absorption Spectroscopy,Physics of Earth and Space Environments,pp.135–174(2008)DOI10.1007/978-3-540-75776-46c Springer-Verlag Berlin Heidelberg20081366Differential Absorption Spectroscopy1920–First ozone column measurements were made by Charles Fabry and Henri Buisson,who determine a column of about3mm(at atmospheric pressure),with large variations.1925–First application of a dedicated ozone spectrometer by Gordon Miller Bourne Dobson(Dobson and Harrison,1926).1926–Paul G¨o tz confirms the theory of an ozone layer by observing the so-called‘Umkehr’effect,and determines its altitude to be about25km. 1934–Direct observation of the ozone layer by UV-spectroscopy by Erich Regener(TH Stuttgart).1948–Marcel Migeotte(Ohio State University)discovers methane and carbon monoxide in the earth atmosphere by near-infrared absorption spectroscopy(Migeotte,1948,1949).1950–Discovery of the emission bands of the hydroxyl radical(OH)in the nightglow(the Meinel bands of the OH-radical).As a consequence, HO x-chemistry is viewed in connection with ozone chemistry by David R.Bates and Marcel Nicolet(1950),and Bates and Witherspoon (1952).1975–First detection of OH in the atmosphere by Dieter Perner and col-leagues using differential optical absorption spectroscopy(Perner et al., 1976).This list illustrates the role that spectroscopy has played in the measure-ment of reactive trace gases in the atmosphere,most notably ozone.The reader may notice that the identification and quantification of gases was primarily accomplished by the analysis of atmospheric absorptions.This is still the case in most current applications of atmospheric spectroscopy.The use of emission bands is restricted to the thermal infrared wavelength region(see Chap.5) or to the excited gas molecules in the upper atmosphere,which emit light at higher energies,i.e.shorter wavelength.Both applications are in use today, but are not the topic of discussion in this book.The initial use of spectroscopy in the atmosphere concentrated on the identification of various gases.Soon,however,this method was put in use to quantify the concentrations(or column densities)of these species.In particu-lar,the contributions of Dobson,who constructed thefirst instrument for the regular measurement of atmospheric ozone,should be singled out(Dobson and Harrison,1926).This chapter focuses on a modern method to quantitatively measure a large variety of trace gases in the atmosphere.DOAS is now one of the most commonly used spectroscopic methods to measure trace gases in the open atmosphere.At the beginning,we give a general introduction to absorption spectroscopy and DOAS.This is followed by an overview of different exper-imental approaches of DOAS and a discussion of the precision and accuracy of this method.The last section of this chapter is dedicated to a rigorous mathematical description of the various DOAS applications.6.2Classical Absorption Spectroscopy 1376.2Classical Absorption SpectroscopyThe basis of the early spectroscopic measurements,and many present quanti-tative trace gas analytical methods in the atmosphere and the laboratory,is Lambert–Beer’s law,often also referred to as Bouguer–Lambert law.The law was presented in various forms by Pierre Bouguer in 1729,Johann Heinrich Lambert in 1760,and August Beer in 1852.Bouguer first described that,‘In a medium of uniform transparency the light remaining in a collimated beam is an exponential function of the length of the path in the medium’.However,there was some confusion in the naming of this law,which may be either the name of individual discoverer or combinations of their names.In this book,we have referred to it as Lambert–Beer’s law.A variety of spectroscopic techniques make use of the absorption of elec-tromagnetic radiation by matter (Fig.6.1).In a formulation suitable for the analysis of gaseous (or liquid)absorbers,Lambert–Beer’s law can be writ-ten as:I(λ)=I0(λ)·exp (−σ(λ)·c ·L).(6.1)Here,I 0(λ)denotes the initial intensity of a light beam emitted by a suitable source of radiation,while I (λ)is the radiation intensity of the beam after pass-ing through a layer of thickness L ,where the absorber is present at a uniform concentration of c .The quantity σ(λ)denotes the absorption cross-section at wavelength λ.The absorption cross-section as a function of wavelength is a characteristic property of any species.The determination of the light path length,L ,is usually trivial for active DOAS applications (see Chap.4).Once those quantities are known,the average trace gas concentration,c ,can be calculated from the measured ratio I 0(λ)/I (λ):c =ln I 0(λ)I(λ) σ(λ)·L=D σ(λ)·L .(6.2)DetectorL IntensityI 0(λ)I(λ)LightSource Absorber with concentration cFig. 6.1.The basic principle of absorption spectroscopic trace gas detection.A beam of light passes through a volume of length L containing the absorber with concentration c .At the end of the light path the intensity is measured by a suitable detector1386Differential Absorption SpectroscopyThe expressionD=lnI0(λ)I(λ),(6.3)is called the optical density of a layer of a given absorber.Note that,in the literature,the decadal as well as the natural logarithm is used in the definition of optical density.In this book,we will exclusively use the natural logarithm.Equation(6.2)is the basis of most absorption spectroscopic applications in the laboratory,where the intensities I(λ)and I0(λ)are determined by measurements with and without the absorber in the light beam.However,the application of Lambert–Beer’s law is more challenging in the open atmosphere.Here,the true intensity I0(λ),as it would be received from the light source in the absence of any atmospheric absorber,is difficult to determine.It would involve removing the air,or more precisely the absorbing gas,from the atmosphere.While this may seem to present a dilemma rendering atmospheric absorption spectroscopy useless in this case,the solution lies in measuring the so-called‘differential’absorption,i.e.the difference between the absorptions at two different wavelengths.This principle was used by Dobson in the1930s to determine the total column of atmospheric ozone.In an ingenious experimental setup,the Dobson spectrometer compares the intensity of direct solar light of two wavelengths–λ1,λ2–with different ozone absorption cross-section,σ1=σ(λ1),σ2=σ(λ2)(Dobson and Harrison,1926).6.3The DOAS PrincipleA schematic setup of an experiment to measure trace gas absorptions in the open atmosphere is shown in Fig.6.2.Similar to Fig.6.1,light emitted by a suitable spectral broadband source with an intensity I0(λ)passes through a volume with absorbers(here the open atmosphere),and is collected at the end of the light path.As the light travels through the atmosphere,its intensity is reduced through the absorption of a specific trace gas.However,it also undergoes extinction due to absorption by other trace gases,and scattering by air molecules and aerosol particles.The transmissivity of the instrument (mirrors,grating,retro-reflectors,etc.)will also decrease the light intensity, as will the light beam widening by turbulence.By expanding Lambert–Beer’s law,one can consider the various factors that influence the light intensity by an equation that includes the absorption of various trace gases with concentration c j and absorption cross-sectionsσj(λ),Rayleigh and Mie extinction,εR(λ) andεM(λ)(described byεR(λ)≈σR0(λ)·λ−4·c AIR andεM(λ)=σM0·λ−n·N A,respectively;see Chap.4),and instrumental effects and turbulence, summarised in A(λ):I(λ)=I0(λ)·exp−L·(σj(λ)·c j)+εR(λ)+εM(λ)·A(λ).(6.4)6.3The DOAS Principle 139I 0(~λ–4~λ–(1...3)Fig.6.2.Sketch of an experiment to measure trace gas absorptions in the open atmosphereTo determine the concentration of a particular trace gas,it would,in principle,be necessary to quantify all other factors influencing the intensity.In the laboratory,this can be achieved by removing the absorber from the light path.In the atmosphere,however,where this is impossible,the multiple factors influencing the intensity pose a dilemma.Differential optical absorption spectroscopy overcomes this challenge by using the fact that aerosol extinction processes,the effect of turbulence,and many trace gas absorptions show very broad or even smooth spectral charac-teristics.Certain trace gases,however,exhibit narrowband absorption struc-tures.The foundation of DOAS is thus to separate broad-and narrowband spectral structures in an absorption spectrum in order to isolate these narrow trace gas absorptions (Fig.6.3).The broad spectrum is then used as a new intensity spectrum I 0 (λ),and Lambert–Beer’s law can again be applied to the narrowband trace gas absorptions.Figure 6.3illustrates the separation of the narrow-and broadband struc-tures for one absorption band,both for the absorption cross-section and the intensity:σj (λ)=σj 0(λ)+σ j (λ)(6.5)σj 0in (6.5)varies ‘slowly’with the wavelength λ,for instance describing a gen-eral ‘slope’,such as that caused by Rayleigh and Mie scattering,while σ j (λ)shows rapid variations with λ,for instance due to an absorption band (see Fig.6.3).The meaning of ‘rapid’and ‘slow’variation of the absorption cross-section as a function of wavelength is,of course,a question of the observed wavelength interval and the width of the absorption bands to be detected.Inserting (6.5)into (6.4),we obtain:I(λ)=I 0(λ)·exp ⎡⎣−L ·⎛⎝ jσ j(λ)·c j ⎞⎠⎤⎦·exp ⎡⎣−L ·⎛⎝ j (σj0(λ)·c j )+εR (λ)+εM (λ)⎞⎠⎤⎦·A (λ),(6.6)1406Differential AbsorptionSpectroscopyFig.6.3.Principle of DOAS:I 0and σare separated by an adequate filtering pro-cedure into a narrow (D ,and σ )and broad band part (I 0and σb )where the first exponential function describes the effect of the structured ‘differential’absorption of a trace species,while the second exponential con-stitutes the slowly varying absorptions as well as the influence of Rayleigh and Mie scattering.The attenuation factor A (λ)describes the broad wavelength-dependent transmission of the optical system used and turbulence.Thus,we can define a quantity I 0as the intensity in the absence of differential absorption:I 0(λ)=I 0(λ)·exp ⎡⎣−L ·⎛⎝ j(σj0(λ)·c j )+εR (λ)+εM (λ)⎞⎠⎤⎦·A (λ).(6.7)The corresponding differential absorption cross-section σ j (λ)is then substi-tuted for σj (λ)in (6.1)and (6.2).σ j (λ)is determined in the laboratory (i.e.taken from literature data),just like σj (λ).Likewise,a differential optical den-sity,D ,can be defined in analogy to (6.3)as the logarithm of the quotient of the intensities I 0and I 0(as defined in (6.7)and (6.6),respectively):D=ln I 0(λ)I(λ)=L · j σ j (λ)·c j .(6.8)Atmospheric trace gas concentrations can then be calculated according to (6.2),with differential quantities D and σ (λ)substituted for D and σ(λ),respectively.A separation of the different absorptions in the sum of (6.8)is6.4Experimental Setups of DOAS Measurements141 possible because the structures of the trace gases are unique,like afingerprint (see Sect.6.5).Both the separation of broad and narrow spectral structures and the sep-aration of the various absorbers in(6.8)require the measurement of the radi-ation intensity at multiple wavelengths.In fact,DOAS measurements usually observe the intensity at500–2000individual wavelengths to accurately de-termine the concentrations of the various absorbing trace gases.The use of multiple wavelengths is an expansion of the principles used,for example,by Dobson,which were based on two or four wavelengths.The use of differential absorptions over an extended wavelength range has a number of major advantages.Because the transmission of optical instru-ments typically shows broad spectral characteristics,no calibration of the optical properties or their change with time is necessary.This often makes the instrumentation much simpler and less expensive.The use of a multi-tude of wavelengths allows the unique identification of trace gas absorptions.A further major advantage of this approach is the opportunity to observe and quantify extremely weak absorptions corresponding to optical densities around D =10−4.In particular,the ability to use very long light paths in the atmosphere,in active DOAS applications sometimes up to10–20km long (passive DOAS applications can reach1000km),increases the sensitivity of DOAS and,at the same time,provides spatially averaged values.Before giving a more rigorous mathematical description of the DOAS method,the basic experimental setups,the trace gases that are commonly measured,and the typical detection limits of DOAS will be reviewed in the following sections.6.4Experimental Setups of DOAS MeasurementsThe DOAS principle as outlined earlier can be applied in a wide variety of light path arrangements and observation modes(Fig.6.4).To provide a general overview of different setups,we introduce a classification system that will later be used in the description of the different analysis methods(see Sect.6.7 and Chap.8)and the technical details(Chap.7).According to their light sources,we distinguish between active and pas-sive DOAS.In short,active DOAS uses artificial light,while passive DOAS relies on natural light sources,i.e.solar,lunar,or stars.An overview of the most common experimental setups illustrates the breadth of DOAS applica-tions that are in use today(Fig.6.4).6.4.1Active DOASActive DOAS applications have one thing in common–they rely on an arti-ficial light source coupled to an optical setup that is used to send and receive1426Differential Absorption Spectroscopy1. Long-Path DOAS (LP-DOAS)2. Vertical Profiling LP-DOASReflectors Light sourceRetro-reflector3. Tomographic DOAS4. Folded-Path DOAS5. Direct Sunlight DOAS6. Balloon-borne (direct sunlight) DOASLPMA/DOAS Gondola + Balloon7. Satellite-borne DOAS - Occultation8. Zenith Scattered Light (ZSL-DOAS)9. Multi-Axis DOAS (MAX-DOAS)10. Airborne Multi-Axis DOAS (AMAX-DOAS)Fig.6.4.The DOAS principle can be applied in a wide variety of light path ar-rangements and observation modes using artificial (1–4)as well as natural direct (5–7)or scattered (8–14)light sources.Measurements can be done from the ground,balloons,aircrafts,and from space6.4Experimental Setups of DOAS Measurements14312. Satellite-borne DOAS -Nadir Geometry11. Imaging DOAS13. Satellite-borne DOAS - Scattered LightLimb Geometry14. Determination of the Photon Path length L (in Clouds) ‘inverse DOAS’Fig.6.4.Continuedlight in the atmosphere.Spectroscopic detection is achieved by a spectrom-eter at the end of the light path.In general,active DOAS is very similar to classical absorption spectroscopy,as employed in laboratory spectral pho-tometers.However,the low trace gas concentrations in the atmosphere require very long light paths (up to tens of kilometres in length,see above),making the implementation of these instruments challenging (see Chap.7for details).Active DOAS applications are typically employed to study tropospheric com-position and chemistry,with light paths that are often parallel to the ground.In addition,active DOAS systems are also used in smog and aerosol chamber experiments.The earliest applications of active DOAS,i.e.the measurement of OH radicals (Perner et al.,1976),used a laser as the light source along one single path (Fig.6.4,Plate 1).This long-path DOAS setup is today most com-monly used with broadband light sources,such as xenon-arc lamps,to mea-sure trace gases such as O 3,NO 2,SO 2,etc.(e.g.Stutz and Platt,1997a,b).Expansion of this method involves folding the light beam once by using retro-reflectors on one end of the light path (Axelsson et al.,1990).This setup simplifies the field deployment of long-path DOAS instruments.In ad-dition,applications that use multiple retro-reflector setups to probe on dif-ferent air masses are possible.Figure 6.4,Plate 2,shows the setup that is used to perform vertical profiling in the boundary layer with one DOAS sys-tem.An expansion that is currently under development is the use of mul-tiple crossing light paths to perform tomographic measurements (Fig.6.4,Plate 3).1446Differential Absorption SpectroscopyIn applications where detection in smaller air volumes with high sensitiv-ity is required,folded-path DOAS is often used(Fig.6.4,Plate4)(e.g. Ritz et al.,1992).Because the light can pass the multiple reflection cells in these systems up to144times,long light paths can be achieved in small air volumes.These systems are the most common DOAS setups in laboratory applications,where interference by aerosols makes the use of classical absorp-tion spectroscopy impossible(e.g.smog and aerosol chambers).Folded-path DOAS has also been used for the same applications as long-path DOAS(e.g. Alicke et al.,2003;Kurtenbach et al.,2002).In particular,the use of laser to measure OH has been successful(see Chap.10).Active DOAS measurements have contributed to the discovery and quan-tification of a number of important atmospheric trace species,most notably the radicals OH and NO3(Perner et al.,1976;Platt et al.,1979).The ele-gance of active DOAS is that the expanded Lambert–Beer’s law(6.4)can be directly applied to the calculation of trace gas concentrations based only on the absorption cross-section,without the need for calibration of the instru-ment in thefield.This gives active DOAS high accuracy and,with the long light paths,excellent sensitivity.6.4.2Passive DOASPassive DOAS utilises light from natural sources.The two most important sources are the sun and the moon.However,the use of light from other stars has also been reported.While the measurement of light directly from moon and stars is possible,sunlight offers two alternatives:direct sunlight and sun-light scattered in the atmosphere by air molecules and particles.We will fur-ther subdivide passive DOAS applications into direct and scattered light measurements(see also Chap.11).Direct measurements use the sun,moon,or stars as light sources,and thus share the advantage of active DOAS of directly applying Lambert–Beer’s law. However,since the light crosses the entire vertical extent of the atmosphere, a direct conversion of absorptions to concentrations is not possible.Instead, the column density,i.e.the concentration integrated along the path,is the direct result of these measurements.Only by using geometric and radiative transfer calculations can these measurements be converted into vertically in-tegrated column densities(VCD)or vertical concentration profiles.The most common example for VCDs is the total ozone column,which is measured in Dobson units.Figure6.4gives several examples for direct passive DOAS setups.Besides direct measurements of sun,moon,and star light from the ground(Fig.6.4,Plate5),balloon-borne solar measurements have been very successful(Fig.6.4,Plate6).The measurements during the ascent provide ver-tical profiles of various trace gases.With the recent deployment of space-borne DOAS instruments,i.e.SCIAMACHY,occultation measurements(Fig.6.4, Plate7)have also become possible.6.4Experimental Setups of DOAS Measurements145Scattered sunlight measurements are more universally used in passive DOAS since they offer the largest variety of applications.The measurement of scattered light from the zenith(Fig.6.4,Plate8)was one the earliest applications of passive DOAS(see Sect.11.2),and has contributed consider-ably to our understanding of stratospheric chemistry(e.g.Mount et al.,1987; Solomon et al.,1987,1988,1989).In addition,zenith scattered light has also been used to study the radiative transport in clouds(Fig.6.4,Plate14),which is an important topic in climate research(Pfeilsticker et al.,1998b,1999).A more recent development of passive scattered DOAS is the use of multiple viewing geometries(Fig.6.4,Plate9).This multi-axis DOAS(MAX-DOAS) uses the fact that,at low viewing elevations,the length of the light path in the lower troposphere is considerably elongated(e.g.H¨o nninger et al.,2004).It is thus possible to probe the lower troposphere sensitively.In addition,vertical profiles can be derived if enough elevation angles are measured.MAX-DOAS can also be employed from airborne platforms,allowing the measurements below and above theflight altitude(Fig.6.4,Plate10),as well as determina-tion of vertical concentration profiles.An expansion of MAX-DOAS,which is currently under development,is Imaging DOAS(Fig.6.4,Plate11),where a large number of viewing elevations are measured simultaneously to visualise pollution plumes.Over the past decade,DOAS has also been used for satellite-borne mea-surements(Fig.6.4,Plates12,13),which use sunlight scattered either by the atmosphere,the ground,or both(see Sect.11.5).Two viewing geometries of these measurements are possible(for details and examples,see Chap.11).In the nadir geometry,the DOAS system looks down towards the earth’s surface. Instruments such as GOME provide global concentrationfields of trace gases, such as O3,NO2,and HCHO.The SCIAMACHY instrument also employs measurements in limb geometry,which allow the determination of vertical trace gas profiles with high resolution(Fig.6.4,Plate13).The advantage of passive DOAS applications is the relatively simple exper-imental setup.For example,scattered light measurements require only small telescopes.In addition,no artificial light source is needed.However,a number of additional challenges have to be addressed in passive DOAS applications. Because solar and lunar light is spectrally highly structured,special care needs to be taken.To detect very small trace gas absorptions,the strong Fraunhofer bands must be accurately measured.In addition,the fact that the light source structure contains narrow and deep absorptions also makes the application of the DOAS technique,which was outlined in Sect.6.3,more difficult.This will be discussed in more detail below.The largest challenge in using passive DOAS is the conversion of the observed column densities to vertical column densities,concentrations,and vertical profiles.This is,in particular,the case for scattered light setups,where the length of the light path is difficult to de-termine.The interpretation of these measurements,therefore,must be based on detailed radiative transfer calculations(see Chap.9).1466Differential Absorption Spectroscopy6.5Trace Gases Measured by DOASThe separation of broad and narrow spectral structures(Sect.6.3),while making absorption spectroscopy usable in the atmosphere,restricts DOAS measurements to trace gases that have narrow band absorption structures with widths narrower than∼10nm.In theory,all gases that have these narrow absorption bands in the UV,visible,or near IR can be measured.However, the concentrations of these compounds in the atmosphere,and the detection limits of today’s DOAS instruments,restrict the number of trace gases that can be detected.As DOAS instruments improve in the future,this list will most likely grow.Figures6.5and6.6show the absorption cross-sections of a number of trace gases that are regularly measured by DOAS.A number of features about these cross-sections should be pointed out here.First and most importantly,each trace gas spectrum has a unique shape.Most of the trace gases only absorb in certain wavelength intervals.However,many spectral regions can contain a large number of simultaneous absorbers.For example,between300and 400nm,the following trace gases will show absorption features if they are present at high enough concentrations:O3,SO2,NO2,HONO,HCHO,and BrO.Because of their unique spectral structure,a separation of the absorp-tions is possible.From(6.8),it is clear that spectral regions with higherσ will show the largest optical densities.These spectral intervals are thus preferred for DOAS measurements since the sensitivity improves in these wavelength regions.In principle,each trace gas has an optimal wavelength interval.In practice,however,one has to often compromise in the choice of the wave-length interval to measure more than one trace gas simultaneously.Because expanding the wavelength window reduces the spectral resolution of typical grating spectrometers,the sensitivity is also reduced.The choice of trace gases thus depends on the specific application.In Fig.6.7,we have attempted to aid in the choice of the best wavelength re-gion by visualising the detection limits of an extended set of trace gases for long-path applications in the troposphere.It should be added that a number of other trace gases,besides those shown in Figs.6.5and6.6,can be measured.Table6.1gives an overview of the var-ious trace gases measured by DOAS,including stratospheric trace gases.At shorter wavelengths,the usable spectral range of DOAS is limited by rapidly increasing Rayleigh scattering and O2absorption(Volkamer et al.,1998). Those effects limit the maximum light path length to∼200m in the wave-length range from200–230nm,where,for instance,the sole usable absorption features of species such as NO(Tajime et al.,1978)and NH3are located(see Fig.6.7and Table6.1).6.5Trace Gases Measured by DOAS147200300400500600700NO 2NO 3SO 2A b s o r p t i o n c r o s s -s e c t i o n i n 10–19 c m 2 m o l e c u l e –1Wavelength in nmBrOHCHO CHOCHOIOOIOClOHONOO 4I 2OBrOOClO0100100.01.0 x 10–451000.00.802000602000100060050400100010001 × 102O 3 cross-section × 1000O 3Fig.6.5.Details of the absorption cross-section features of a number of species of atmospheric interest as a function of wavelength (in nm).Note the ‘fingerprint’nature of the different spectra1486Differential Absorption SpectroscopyFig.6.6.Details of the differential absorption cross-section features of a number of monocyclic aromatic species,O2,and O3as a function of wavelength(in nm).Note the‘fingerprint’nature of the different spectra。
CSC-391数字式失步解列控制装置

CSC-391C数字式失步解列控制装置装置助能失步助能D监測装置安芸处线路的电圧、电逍、劝率等运行状态(包祐电气量、开人、元件投停、异常)。
判斷系统是否失步。
一旦发生失步,采取解列、切柄、圧出力、幼负荷或启动貝它便系统再间期的控制措施;2)具有区分失步振葫、冋步按蒲和短路故障功能。
当系统发生失步振蒲时,装置正确动作。
当系统发生间步娠游、矯路枚障等非失步板葫怖况时,装置不误动作;3)装置能正确利别失形按葫中心正/反方向。
当振蒲中心在装置安装处附近时,芸置能可靠动作;4)装置能正确判别加速失步/績速失步;5)当系统允许采取再间涉控制时,芸置能通过设置失步捺葫周期次数定值址时动作,尽可能便系统实现再同步;6)装置能jfiiidj作区围定值、振蒲周期次数定IS整定,那闕松缁安装自之间失折解列装置的配合;7)装置具有事件记录与故障数摒录波功能;8)装置具有回路自检、异常报兽、自朋显示、扌I"等功能;9)装置具有灵活、方便的对时功能。
既可用建盘手动修孜廿算《1时卸,也可用GPS脉冲信号进行精确对时,并有航止GPS误对时功能;10)預因与就地监腔系统、I f? «站、调度系统等的接口。
IK^IK压、il^il压助能:1)测量装置安装处两目母线幼旗后的电圧、频率或測量找路的电压、頻率以及它01的变化率。
对失步解列装置中集成的頻率电压紧急控制功能,可以跟IS判斷糸筑是否失步的量电压、频率。
2)当电力系竦由干有功缺额引起频率下解BL装置自劝根据頻率解低値切除跚分电力用户负飢使系躱的电溫与负荷車新平悔。
本芸置设有3 f基本轮,2个狼立的特殊轮;3)当电力系统由于无功缺额引起电压下肾BL装置自劝根掘电压降低值切除部分电力用户负飢确保系筑无功的平働,使电网的电压恢复正常。
本芸置根据电压幼负荷的轮次相根醤颐率切负荷的轮次相同;4)由于有劝劝率过剝引起盹率上升时,装置根据顺率廿高值自动勿除电厂的跚分机组,使系统的电源与负荷車新平働。
失步解列运行规程
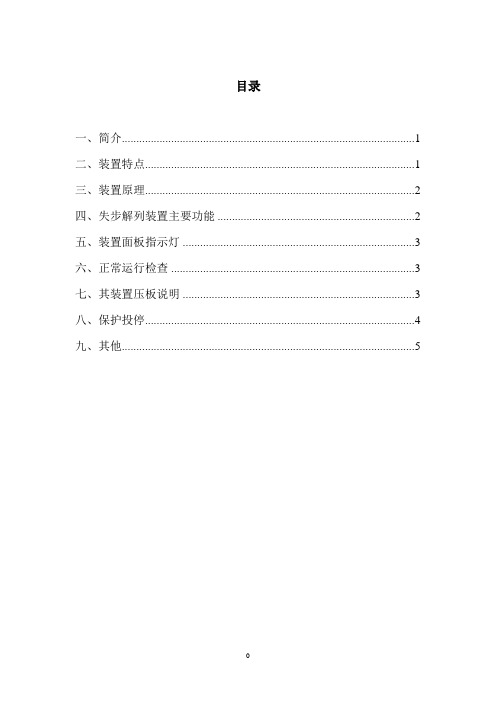
目录一、简介 (1)二、装置特点 (1)三、装置原理 (2)四、失步解列装置主要功能 (2)五、装置面板指示灯 (3)六、正常运行检查 (3)七、其装置压板说明 (3)八、保护投停 (4)九、其他 (5)失步解列装置运行规程一、简介:失步解列装置作为电力系统失步时的跳闸启动装置,当电力系统失步时,做出相应的处理,进行自动解列、切机、切负荷或启动其他系统再同期的控制措施,使处于失步状态的系统通过调整电力网络功率平衡达到恢复到稳定状态的目的,保证系统的安全,减少事故扩大的可能。
山西鲁晋王曲发电有限责任公司位于山西省潞城市,一期工程是2x600MW超临界机组,根据王曲电厂接入系统设计的要求,王曲电厂一期工程出双回线到潞城开闭站,在王潞一线和王潞二线的线路的两侧加装失步解列装置,并按照双重化配置,电厂侧配的是南京南瑞公司生产的RCS-993B型失步解列装置根据华北电网公司相关的规定,王曲电厂500KV升压站的失步解列装置的调度名称为“500kV王潞线RCS-993B失步解列装置A”和“500kV王潞线RCS-993B失步解列装置B”。
二、装置特点RCS-993B失步解列装置采用整体面板,全封闭机箱,单元采用双CPU结构,强电和弱电严格分离,同时,在软件设计上采用有效的抗干扰能力,装置具有很强的抗干扰能力和抗电磁辐射能力失步解列装置采用友好的人机界面,汉字显示,中文打印报表配置RS-485接口,保存128次最新动作报告,24次故障录波报告。
可对两回线路进行失步判别三、装置原理本装置采用ucosφ判别原理进行失步判别,以装置安装处测量电压最小值确定动作区域。
其主要性能有:失步继电器利用ucosφ的变化轨迹来判别电力系统失步,利用装置安装处采集到的500KV王潞一线及王潞二线的三相电压电流,通过计算ucosφ来反应中心振荡电压,根据振荡中心电压的变化规律来区分失步振荡和同步振荡及短路故障将ucosφ的变化范围分为7个区,振荡发生时ucosφ逐级穿过失步继电器快跳段需要穿过7个区域,慢跳段需要穿过4个区域失步解列装置快跳段可以测量180ms以上的失步周期,满跳段可以测量120ms以上的失步周期,并可以整定为失步后N个周期后出口跳闸,N的取值范围为1-15。
- 1、下载文档前请自行甄别文档内容的完整性,平台不提供额外的编辑、内容补充、找答案等附加服务。
- 2、"仅部分预览"的文档,不可在线预览部分如存在完整性等问题,可反馈申请退款(可完整预览的文档不适用该条件!)。
- 3、如文档侵犯您的权益,请联系客服反馈,我们会尽快为您处理(人工客服工作时间:9:00-18:30)。
IMP-3701微机失步解列装置使用说明书目录1.使用范围及特点 (1)1.1基本保护配置 (1)1.2护装置主要特点 (1)2.主要技术数据 (2)2.1额定参数 (2)2.2功率消耗 (2)2.3过载能力 (2)2.4工频耐压及抗干扰性能 (2)2.5工作条件 (3)2.6输出接点 (3)3.硬件结构说明 (3)3.1机箱外观视图 (3)3.2装置端子图 (6)4.保护功能原理 (10)4.1基本保护功能原理 (10)4.2其他功能 (13)5.使用操作指南 (14)5.1前面板配置及各部件功能 (14)5.2运行状态下的信息及各键功能 (14)6.使用维护及故障处理 (21)6.1装置投运前的检查 (21)6.2故障处理 (21)6.3标志、包装、运输、贮存 (21)7.装置安装说明 (22)1.使用范围及特点本装置作为电力系统失步时的跳闸启动装置,当电力系统失步时,做出相应的解列处理。
1.1基本保护配置✧失步解列功能1.2护装置主要特点✧处理器采用32位浮点DSP,具有处理速度快、多级流水线操作、快速中断处理能力等优点,电量采集采用14位A/D转换芯片,具有测量精度高等优点;✧中文图形液晶显示,人机界面清晰友好,调试方便,操作简单;✧具有完善的自诊断和监视功能,对故障具体定位,方便调试;✧具有完整的动作记录、SOE记录,所有信息掉电保持;✧装置提供2条线路的失步解列功能,分别提供2回定值和提供各自的独立出口;✧失步元件采用阻抗循序判别方式,在阻抗平面上表现为5个区域,并且可以设置穿越次数,达到规定的穿越次数后进行解列处理;✧失步元件设置了告警处理,当系统振荡第一次穿越到R4区域后,及时的发告警信号以便运行人员根据情况进行处理将系统拉入同步;✧失步启动采用电流检测方式,当检测到系统电流大于启动电流时认为系统出现扰动启动失步元件,启动电流的设置可以根据系统灵活整定;✧失步元件可以通过负序电流的检测区分是否发生了短路或接地故障,如果发生接地或短路故障闭锁失步元件;✧失步解列作于跳发电机断路器,装置在R4区域后才出口,排除了在180度的情况下跳断路器的情况,通过程序计算最大限度的减少冲击电流对系统的影响;✧具有GPS对时功能;✧具有对外部开关量监视功能;✧可实现电量数据零点满度自动校正功能。
武汉华工电气自动化有限责任公司 12.主要技术数据2.1额定参数1)额定频率:50Hz;2)交流电压输入额定值:57.74V;3)交流电流输入额定值:5A;4)电源额定电压:DC220V/AC220V。
2.2功率消耗1)交流电压回路:功率消耗不大于0.5VA;2)交流电流回路:功率消耗不大于0.5VA;3)整机电源功耗:不大于25W。
2.3过载能力1)交流电压回路:1.2倍额定电压,连续工作;1.4倍额定电压,允许10s;2)交流电流回路:2倍额定电流,连续工作;10倍额定电流,允许10s;40倍额定电流,允许0.1s。
2.4工频耐压及抗干扰性能2.4.1电磁兼容2.4.2绝缘与耐压2 武汉华工电气自动化有限责任公司2.5工作条件1)环境温度:-5℃~+50℃;2)相对湿度:5%~95%;3)大气压力:86~106kPa;4)环境介质:不允许有导致金属或绝缘损坏的腐蚀性气体及较严重的尘埃和霉菌。
2.6输出接点1)输出回路的触点容量:电压不超过250V,电流不超过0.5A,时间常数为5ms±0.75ms,容量为30W的直流有感负荷;2)动作速率为:1800次/h;3)装置应能可靠动作及返回次数:1000次,并无机械损坏现象。
3.硬件结构说明3.1机箱外观视图1)装置正视图武汉华工电气自动化有限责任公司 32)正视图说明如下:①液晶显示屏②信号指示灯(从上到下)依次为:运行(绿色)、通讯(绿色)、报警(红色)、跳闸(红色)、故障(红色)③功能按钮(从左到右)依次为:复位键、复归键、返回键、→键、↑键、↓键、←键、确认键④远方/现地切换锁3)装置侧面及背面视图如下依次为装置的左侧面板、上侧面板、下侧面板、右侧面板视图:如下为装置的背面板视图:②①③④4 武汉华工电气自动化有限责任公司武汉华工电气自动化有限责任公司 56 武汉华工电气自动化有限责任公司3.2装置端子图3.2.1模拟量端子图MN1 MN2MN4MN3武汉华工电气自动化有限责任公司 7ALARMKC2 KC1 KC3KC48 武汉华工电气自动化有限责任公司3.2.4 电源端子图3.2.5 通信接口装置提供RS-485,RS-232两种通讯方式,RS232为内部调试用,RS485端口通信协议采用DL/T667-1999 远动设备及系统 第5部分 传输规约 第103篇 继电保护设备信息接口配套标准(IEC60870-5-103继电保护设备信息接口配套标准),其通信接口用于现场远方调试和组建自动化系统。
装置提供一RS232打印通讯口,用于实现现地配置有打印机的现地打印功能。
KR2 KR4KR3KR1装置提供两个接口,分别为打印通讯口和计算机通讯口。
1)打印通讯以及调试通讯口(COM1):异步RS232 (波特率2400,数据位8,停止位12)上位机通讯口(COM2):异步RS485 (波特率9600,数据位8,停止位1个,无校验)3)跳线说明:调试时可使用调试通讯RS232口,调试通讯RS232和RS485通讯口不能同时使用,跳线方法如下:(1)JP5.1---JP5.3 JP5.2—JP5.4 短接选择RS232接口(IET-3A00板上);(2)JP5.3---JP5.5 JP5.4—JP5.6 短接选择RS485接口;(3)出厂默认为RS485方式通讯。
武汉华工电气自动化有限责任公司910 武汉华工电气自动化有限责任公司4.保护功能原理4.1基本保护功能原理如下图所示,阻抗元件1R ~4R 将阻抗平面分成0~4共五个区,这几个区域分别对应于一定的功角范围,此范围可以通过对阻抗元件1R ~4R 的整定来确定。
BC 对应于本侧系统电抗G X ,CA 对应于对侧系统联系电抗S X 。
失步在正常运行的情况下,系统的测量阻抗应位于0区。
系统在受到扰动后,发生振荡。
若扰动转矩使发电机转子加速,则阻抗轨迹穿越1R 进入I 区,对于稳定振荡,阻抗在I 区停留一段时间后会返回0区。
而对于失步振荡,阻抗轨迹会先后穿越II 区,III 区,IV 区并最终返回起始点,表示完成了一周期振荡或称滑极一次。
失步元件在阻抗轨迹第一次穿越到IV 区时,发失步信号。
信号可用于采取相应的措施来平息振荡。
如果不能使振荡平息,则进行滑极计数,当滑极次数超过整定次数则动作于解列发电机。
为了区分短路与振荡,装置设置有时间元件。
在上面的双遮挡器失步保护中,I ~武汉华工电气自动化有限责任公司 11IV 区对应的时间分别为1t ~4t 。
只有当在每一个区停留的时间大于其所整定的时间时,才认为对这一区的穿越是有效的。
否则认为穿越无效。
时间元件的整定与振荡周期有关,对于一个系统而言,其振荡周期并不是固定的,因此时间元件的整定通常要考虑最严重的情况。
失步启动元件检测到系统电流大于启动电流定值,置启动标志位,启动失步元件,在时间定值范围内有效。
无论是系统振荡还是失步,为区分短路或接地故障,其负序电流都应该小于0.2倍的启动电流值,由此作为失步解列的闭锁元件。
滑极次数计数过程中,在接收到前一个计数后,如果在时间定值内(计数极值),没有新的滑极次数或轨迹一直停留在区域内,计数器将清零,为下次计数做准备。
双遮挡器失步元件的边界阻抗1R ~4R 和1t ~4t 是整定本侧系统电抗G X 、系统电抗S X 和振荡周期时间us T ,通过如下公式计算而得,计算说明如下:1) 阻抗边界1R :为给断路器创造一个良好的断开条件,令1120δ︒=,4240δ︒=。
利用三角函数关系有:111()22G S R X X ctg δ=+ 其中,G X 为本侧系统电抗;S X 为对侧系统电抗。
2) 阻抗边界2R :2112R R =3) 阻抗边界3R :32R R =-4) 阻抗边界4R :41R R =-12 武汉华工电气自动化有限责任公司5) 测量阻抗在各区的停留时间1T 、2T 、3T 的整定:为使失步元件在系统短路故障时不误动,时间1T 、2T 、3T 应足够长。
另外,为使失步保护能可靠动作,1T 、2T 、3T 应小于最小振荡周期下测量阻抗在各区内的实际停留时间。
设系统振荡时最小的振荡周期为us T (具体值由系统计算整定而得,一般为0.5秒至1.5秒),并在系统振荡时,发电机功角δ的变化是匀速的,则测量阻抗在I 区内的停留时间为:21360usT δδ-式中2221()2G S R arcctgX X δ=+于是整定2110.5360us T T δδ-=。
系统振荡时测量阻抗在II 区的停留时间为:21802360usT δ- 整定221800.52360usT T δ-=⨯ 3T 整定小于系统振荡时测量阻抗在III 区停留时间整定31T T =。
6)启动电流的整定:set N.min I I K =⨯其中:N.min I 是系统在最小运行方式下的线路额定电流值,K 为可靠系数,一般取1.2。
4.2其他功能4.2.1 保护动作记录保护动作记录可以记录各种保护动作后的保护类型及相关事故信息,装置最多可永久性记录15次事故内容。
4.2.2 SOE记录SOE记录可以记录外部开关量位置变化情况。
本保护装置最多可永久性记录15次SOE记录。
4.2.3装置电源消失报警装置由外部交流或者直流220V电源供电,如果外部电源消失或者不能正常供电,装置将不能实现正常的保护功能,因此装置设置电源消失报警功能。
当接入装置的电源消失时,保护装置通过ALARM空接点输出口输出报警信号。
装置电源正常时,ALARM输出断开信号;装置电源消失时,ALARM输出闭合信号。
4.2.4定值替换装置总共提供5组定值,可以通过键盘选择运行定值组,也可以由上位机选择切换。
4.2.5装置故障告警本装置具有完整的装置自检功能,当装置本体发生故障时,装置报装置故障信号。
装置具有故障模拟功能,为了测试装置故障时能够正常的输出装置故障报警信号,当模拟装置故障时,装置故障继电器将出口。
装置可以模拟的故障有:出口通道故障,RAM故障,FLASH故障和A/D故障。
装置故障模拟的测试方法为:按住“←”键,再按装置“复位”键,启动系统,直到装置进入系统后放开,装置模拟“出口通道故障”;按住“↑”键,再按装置“复位”键,启动系统,直到装置进入系统后放开,装置模拟“RAM故障”;按住“↓”键,再按装置“复位”键,启动系统,直到装置进入系统后放开,装置模拟“FLASH故障”;按住“→”键,再按装置“复位”键,启动系统,直到装置进入系统后放开,装置模拟“A/D故障”。