Medical near-infrared imaging
四苯基乙烯衍生物的合成与生物成像研究

中文摘要四苯基乙烯衍生物的合成与生物成像研究生物成像已成为当今生物研究中的有力工具,因为它提供了一种独特的方法来可视化细胞的形态细节。
荧光成像是实时,非侵入性监测生物分子的最强大的生物成像技术之一。
在过去几十年中,荧光探针的发展已促进细胞生物学的重大进展。
各种荧光探针,如半导体量子点,荧光碳点,Ln离子掺杂纳米材料,光致发光硅纳米颗粒,金属纳米团簇,有机小分子和有机荧光纳米颗粒已被合成并广泛研究用于生物应用。
聚集诱导发光(AIE)材料由于其优异的光学性质在生物成像领域得到了广泛的研究。
本论文基于四苯基乙烯(TPE),合成了一系列具有聚集诱导发光性质的荧光材料,并利用这些材料制备的纳米粒子进行生物成像。
具体研究内容如下:1.以四苯基乙烯为核,通过选择电子供体(D)和受体(A)的适当组合来设计和合成AIE红光分子。
通过将二甲胺和氰基部分引入TPE中,合成了具有不同AIE特性的四种新的红光化合物1,2,3和4。
四种化合物在固态下的最高量子产率可达到40%。
该化合物可以容易地制造成均一稳定的荧光纳米粒子。
并且化合物1负载的Pluronic F127 纳米粒子的发射主峰位在650nm处,并且高荧光量子产率为15.2%。
化合物1和2的纳米粒子对A549肺癌细胞的生物学成像表明这些化合物是癌细胞的有效荧光探针。
2.基于四苯基乙烯,合成出一种新型有机荧光染料TPE-2NH2。
这种材料发绿光,在NO存在下能与其发生反应生成的产物发红光,因此这种材料具有检测NO的性质。
由于材料的疏水性,我们将此染料负载到二氧化硅介孔纳米粒子中,制备了的纳米粒子均一,稳定,具有120nm的平均粒径,良好的生物相容性,较高的灵敏度。
将此纳米粒子与MCF-7细胞共培养,在细胞质中发现红光信号。
因此,此探针在细胞内检测到NO,表现出良好的应用价值。
关键词:聚集诱导发光,四苯基乙烯,生物成像1AbstractSynthesis and Bioimaging Application of TetraphenyletheneDerivativesBiological imaging (bioimaging) has become a powerful tool in biological research today because it offers a unique approach to visualize the morphological details of cells. Fluorescence imaging is one of the most powerful bioimaging techniques for real-time, non-invasive monitoring of biomolecules of interest in their native environments with high spatial and temporal resolution, and is instrumental for revealing fundamental insights into the production, localization, trafficking, and biological roles of biomolecules in complex living systems. The development of fluorescent probes has facilitated the recent significant advances in cell biology and medical diagnostic imaging. Over the past few decades, a variety of fluorescent probes, such as semiconductor quantum dots, fluorescent carbon dots, Ln ion doped nanomaterials, photo-luminescent silicon nanoparticles, metallic nanoclusters, organic small molecules and organic fluorescent nanoparticles have been synthesized and extensively investigated for biological applications. Aggregation Induce Emision (AIE) materials have been extensively studied in the field of biomimetic imaging due to their excellent optical properties. In this paper, based on tetraphenyl ethylene (TPE), a series of fluorescent materials with aggregation induced luminescent properties were synthesized and biologically imaged using the nanoparticles prepared by these materials. The specific research contents are as follows:1. Organic fluorescent probes play an important role in modernbiomedical research, such as biological sensing and imaging. However, the development of organic fluorophores with efficient aggregate state emissions expanded to the red to near-infrared region is still challenging. Here, we present a series of highly efficient Far Red/Near-Infrared (FR/NIR)2fluorescent compounds with aggregation-induced emission (AIE) properties by attaching electron donor and accepter to tetraphenylethene (TPE) moieties through a simple synthesis method. These compounds exhibit the pronounced fluorescence enhancement in aggregate state, the red to near infrared emission, and facile fabrication into uniform compouds-loaded Pluronic F127 NPs. The emission maximum of the NPs fabricated by the self assembly method is in the range of 550nm-850nm and the highest fluorescent quantum yield is 15.2%. The biological imaging of NPs of compound 1 and 2 for A549 lung cancer cell indicates that these compounds are effective fluorescent probes for cancer cell with high specificity, high photostability and good fluorescence contrast.2. Based on tetraphenylethylene, a novel organic fluorescent dye TPE-2NH2 was synthesized. This material is green emision, it can be reacted and the product generated red emision the presence of NO, so this material has the nature of the detection of NO. Due to the hydrophobicity of the material, we loaded the dye into the silica mesoporous nanoparticles. The prepared nanoparticles were homogeneous and stable, with an average particle size of 120 nm, good biocompatibility and high sensitivity. The nanoparticles were co-cultured with MCF-7 cells, and red light was found in the cytoplasm. Therefore, this probe in the cell to detect NO, showing a good application value.Keywords:Aggregation-induced emission,Tetraphenylethene,bioimaging3目录第1章前言 (1)1.1引言 (1)1.2具有AIE性质的化合物 (3)1.3AIE小分子生物探针的制备及其应用 (16)1.4负载AIE化合物的荧光纳米粒子的制备及其应用 (28)1.5本论文设计思想和主要内容 (32)1.6参考文献 (33)第2章具有AIE性质的高效红光分子的合成及细胞成像 (45)2.1引言 (45)2.2实验部分 (46)2.3结果与讨论 (49)2.4本章小结 (57)2.5参考文献 (60)第3章基于AIE染料的RNS荧光探针的合成及性质研究 (62)3.1引言 (62)3.2实验部分 (63)3.3结果与讨论 (65)3.4本章小结 (70)3.5参考文献 (71)第4章结论 (74)作者简介 (83)致谢 (84)41第1章 前言1.1引言人们在分子水平上理解基本的发光过程已经取得了显著的成就。
术中甲状旁腺显影技术的研究进展
术中甲状旁腺显影技术的研究进展作者:向阳森杨昆宪来源:《中国医学创新》2023年第36期【摘要】随着健康体检与癌症筛查的普及,甲状腺肿瘤的早期检出率逐渐增加。
甲状腺肿瘤的治疗通常以手术切除为主,而甲状腺腺体后方的甲状旁腺对机体钙调节和维持内环境平衡至关重要,术中对于甲状旁腺的保护是避免术后发生甲状旁腺功能减退的关键步骤,故甲状腺术中对甲状旁腺的精准识别尤为重要。
目前,甲状旁腺的识别在很大程度上依赖手术医生的临床经验和技巧,术中准确而快速识别甲状旁腺的技术可为临床提供重要的辅助治疗手段。
最近几年,荧光图像引导手术,得到了广泛的研究,并越来越受欢迎。
为此,本文将对术中甲状旁腺荧光显影技术及其最新的研究进展进行简单的如下综述。
【关键词】甲状旁腺荧光显影自发荧光近红外自发荧光生物电阻抗波谱激光散斑对比成像Research Progress of Intraoperative Fluorescence Imaging of Parathyroid Gland/XIANG Yangsen, YANG Kunxian. //Medical Innovation of China, 2023, 20(36): -168[Abstract] With the popularity of physical examination and cancer screening, the early detection rate of thyroid tumors is gradually increasing. Surgical resection is usually the main treatment of thyroid tumors, and the parathyroid gland behind the thyroid gland is very important to regulate calcium and maintain the balance of the internal environment. The protection of parathyroid gland during operation is the key step to avoid hypoparathyroidism after operation, so the accurate identification of parathyroid gland during thyroid surgery is particularly important. At present, the recognition of parathyroid largely depends on the clinical experience and skills of surgeons. The technique of accurate and rapid recognition of parathyroid can provide important reference value for clinical practice. In recent years, fluorescence image-guided surgery has been widely studied and become more and more popular. For this reason, this article will briefly review the intraoperative fluorescence imaging of parathyroid gland and its latest research progress.[Key words] Parathyroid gland Fluorescence development Autofluorescence Near infrared autofluorescence Bioelectrical impedance spectroscopy Laser speckle contrast imagingFirst-author's address: School of Medicine, Kunming University of Science and Technology, Kunming 650500, Chinadoi:10.3969/j.issn.1674-4985.2023.36.037甲狀腺肿瘤的发病率在女性最常诊断的恶性肿瘤中排名第五[1]。
美容知识:无创性皮肤检测
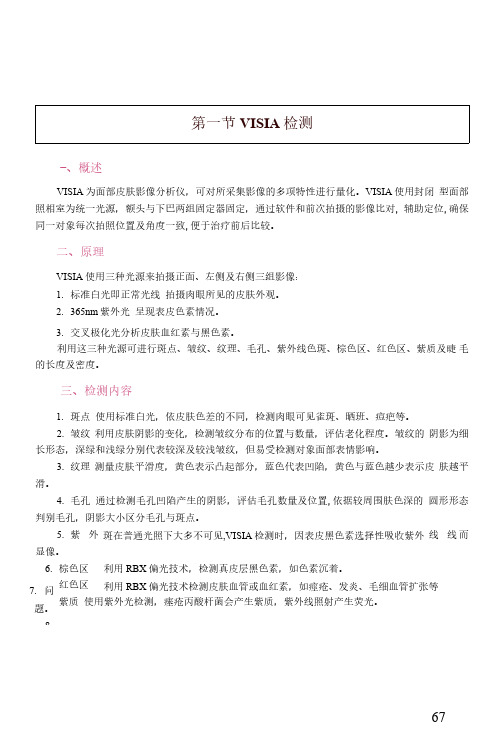
1. 斑点 使用标准白光,依皮肤色差的不同,检测肉眼可见雀斑、晒班、痘疤等。 2. 皱纹 利用皮肤阴影的变化,检测皱纹分布的位置与数量,评估老化程度。皱纹的 阴影为细 长形态,深绿和浅绿分别代表较深及较浅皱纹,但易受检测对象面部表情影响。 3. 纹理 测量皮肤平滑度,黄色表示凸起部分,蓝色代表凹陷,黄色与蓝色越少表示皮 肤越平 滑。 4. 毛孔 通过检测毛孔凹陷产生的阴影,评估毛孔数量及位置,依据较周围肤色深的 圆形形态 判别毛孔,阴影大小区分毛孔与斑点。 5. 紫 外 斑在普通光照下大多不可见,VISIA 检测时,因表皮黑色素选择性吸收紫外 线 线 而 显像。 6. 棕色区 利用 RBX 偏光技术,检测真皮层黑色素,如色素沉着。 7. 问 红色区 利用 RBX 偏光技术检测皮肤血管或血红素,如痙疮、发炎、毛细血管扩张等 紫质 使用紫外光检测,瘗疮丙酸杆菌会产生紫质,紫外线照射产生荧光。 题。 8.
4. 可对治疗结果进行客观地记录、评估与追踪,也有利于科学研究。 (李定达林长熙)
第二篇 美容皮肤科学基础► ► ►► ►
第二节皮肤生理检测
随着皮肤科学、化妆品科学、光电技术和电磁学代谢与分泌等生理指标的仪器,在皮肤病发病机制、治疗效果及化妆品功效评价等领 域 广泛应用。
一、 角质层含水量
(一) 原理 根据水及其溶解物的电学特性,测量皮肤电容、电导或电阻量,间接反映角质层含水量。 目前 商品化测量仪器见表 18-2-1,这些仪器间的测量结果虽不同,但相关性较好。
表 18-2.1 电学法测量角质层含水量的仪器
测量参数
仪器
电导 ASA-M2 Skicon 200 and 200 EX
第一节 VISIA 检测
-、概述
VISIA 为面部皮肤影像分析仪,可对所采集影像的多项特性进行量化。VISIA 使用封闭 型面部 照相室为统一光源,额头与下巴两组固定器固定,通过软件和前次拍摄的影像比对, 辅助定位,确保 同一对象每次拍照位置及角度一致,便于治疗前后比较。
安徽省皖西南名校2018年高三阶段性检测联考英语试题
安徽省皖西南名校2018年高三阶段性检测联考英语试题第一部分听力(共两节,满分30分)回答听力部分时,请先将答案标在试卷上。
听力部分结束前,你将有两分钟的时间将你的答案转涂到客观题答题卡上。
第一节(共5小题;每小题1.5分,满分7.5分)听下面5段对话。
每段对话后有一个小题,从题中所给的A、B、C三个选项中选出最佳选项,并标在试卷的相应位置。
听完每段对话后;你都有10秒钟的时间来回答有关小题和阅读下一小题。
每段对话仅读一遍。
例:How much is the shirt?A. £ 19. 15.B. £ 9. 18.C. £ 9. 15.答案是C。
1. What does the woman say about John?A. He won11 wait for her.B. He won’t come home today.C. He won’t be on time for dinner.2. Why does the man need a map?A. To tour Manchester.B. To find a restaurant.C. To learn about China,3. What does the woman ask for?A. A dress of different size.B. A dress of better quality.C. A dress of a bright color.4. What will the woman probably do next?A. Go to the man’s place.B. Call the Hillsboro Hotel.C. Reserve an exhibition hall.5. Where are the speakers?A. In a museum.B. At home.C. In the city square.第二节(共15小题;每小题1.5分,满分22.5分)听下面5段对话。
近红外光谱成像技术在医学中的应用

近红外光谱成像技术在医学中的应用近红外光谱成像技术(Near-infrared Spectroscopy Imaging,NIRSI)在医学中的应用越来越广泛,它具有无创、无辐射、高灵敏度、高分辨率等优点,在临床生物医学研究、疾病诊断、治疗和监测等方面都有着广泛的应用前景和重要的意义。
本文将阐述NIRSI的原理与应用,在医学领域中的研究现状和前景。
原理NIRSI是一种成像技术,基于近红外(NIR)光在组织中的散射和吸收特性,通过测量组织表面NIR光在不同波长下的吸收、散射和反射光谱,进而对组织的成分、生理功能和病理状态进行研究和分析。
NIR谱图可以获得有效的生物分子组成信息,如氧合血红蛋白、脱氧血红蛋白、水等指标,以及钙离子、荧光染料、药物等的分布情况,为生物医学研究提供了定量信息和高灵敏度的表征手段。
应用1. 脑功能成像NIRSI可以通过监测耳和额叶区域的组织NIR信号,实现对脑功能活动和缺血缺氧状态的观察和诊断。
在脑卒中、脑外伤等神经系统疾病治疗过程中,NIRSI可以帮助临床医生实时监控患者的脑部灌注、代谢情况,及时发现并处理潜在风险。
研究还表明,NIRSI能准确识别脑死亡患者,具有广泛的临床价值。
2. 心血管疾病诊断心血管疾病是全球范围内死亡率最高的疾病,NIRSI在心血管疾病的早期诊断和治疗中发挥着重要作用。
NIRSI可以实现对心脏及周围血管的血流、血氧饱和度、组织代谢等指标的测量与评估,同时也可以监测治疗的效果。
NIRSI技术支持的成像软件还可以通过对差异信号灰度值和高斯模型拟合来检测血管内皮功能异常,为心血管科医生提供了有力的辅助手段。
3. 肿瘤诊断NIRSI技术在肿瘤诊断和治疗中有着极大的潜力。
肿瘤组织与正常组织在信号反射、传输和吸收方面有较大的差异,这可以被NIRSI较为准确地测量和分析出来。
NIRSI成像技术可以通过测量组织氧合血红蛋白和脱氧血红蛋白的变化,来评估肿瘤组织的血供情况和代谢状态;同时,NIRSI技术也可以利用组织对荧光染料的吸收和散射特性,实现肿瘤的早期检测和定位。
荧光聚多巴胺-金量子点应用于癌细胞的高效成像检测

(b)DA、PDA 及 PDs 的傅里叶红外光谱图
(d)PDs 的不同波长激发下的荧光光谱图
2 结果和讨论
PDA 根据文献[15]制备,方法略有变化 . 首先, 将盐酸多巴胺、NaOH 溶液(20 mmol/L,50 mL)溶
2.1 聚多巴胺-金量子点(PDs-g)的表征与性能
解于去离子水中,50 ℃加热搅拌 5 h. 最后,将产品
聚多巴胺-金量子点的制备流程如图 1 所示 . 首
离心洗涤 3 遍,保存在黑暗的地方 .
1.4 荧光聚多巴胺-金量子点(PDs-g)的制备
且粒径分布相对较窄,粒径约为 40 nm. 图 2(b)则 展示了 PDs 的 TEM 图像,可在图中看到一颗颗均
将 1.3 所得产物加入含有氯金酸的溶液中,并 匀分布的球状纳米颗粒,且平均直径约为(12±3)
缓慢逐滴加入 NaBH(4 1 mL)溶液 . 将所得溶液室温 避光搅拌 30 min,可观察到颜色由黄色变为深黄
收稿日期:2021-05-19 基金项目:中央高校基本科研业务费专项基金项目(2020NZD01)资助 . 作者简介:周瑜,在读研究生,研究方向:分子遗传学与基因工程,E-mail:1695286791@.
第3期
周 瑜等:荧光聚多巴胺-金量子点应用于癌细胞的高效成像检测
103
胞中的 GSH,这为今后精准识别癌细胞提供了一 种有效的策略 .
红外反射成像(IRR)
红外反射成像(IRR)米尔科·登莱乌(Milko den Leeuw)1.分类红外反射成像(infrared reflectography,IRR)属于非侵入式成像技术。
它利用的红外线属于电磁频谱中非可见光波段。
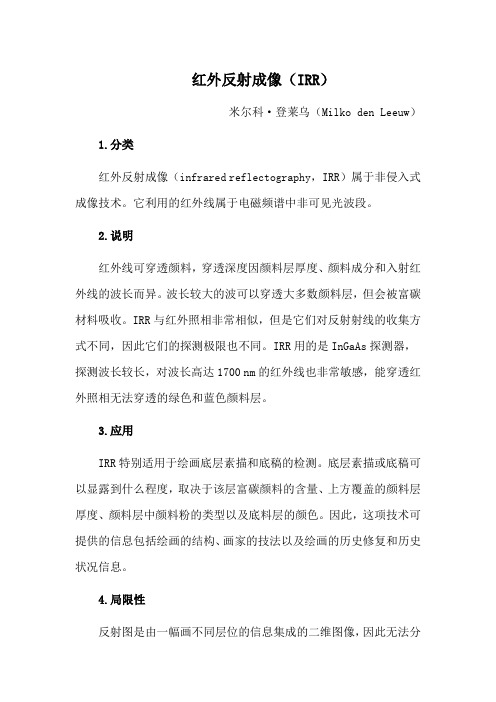
2.说明红外线可穿透颜料,穿透深度因颜料层厚度、颜料成分和入射红外线的波长而异。
波长较大的波可以穿透大多数颜料层,但会被富碳材料吸收。
IRR与红外照相非常相似,但是它们对反射射线的收集方式不同,因此它们的探测极限也不同。
IRR用的是InGaAs探测器,探测波长较长,对波长高达1700 nm的红外线也非常敏感,能穿透红外照相无法穿透的绿色和蓝色颜料层。
3.应用IRR特别适用于绘画底层素描和底稿的检测。
底层素描或底稿可以显露到什么程度,取决于该层富碳颜料的含量、上方覆盖的颜料层厚度、颜料层中颜料粉的类型以及底料层的颜色。
因此,这项技术可提供的信息包括绘画的结构、画家的技法以及绘画的历史修复和历史状况信息。
4.局限性反射图是由一幅画不同层位的信息集成的二维图像,因此无法分辨一幅画中每个细节的层位深度。
这项技术在收集信息方面的效果也受画中吸收或反射红外线的材料所限,这些材料可能会妨碍目标区域的成像。
铁基墨水素描可能也很难检测,因为铁基墨水不能有效吸收红外线。
此外,颜料层越厚就越难被红外线穿透,因此底层的成像也受颜料层厚度的限制。
反射设备也会为检测带来局限性,它可能会造成光学失真和几何变形,生成的图像通常还需进行后期处理,这也可能会导致错误。
5.补充技术昼光照相术、紫外照相术、红外照相术、红外假彩色照相术、X 射线照相术、X射线荧光成像、K-edge成像以及同步辐射X射线荧光成像。
6.技术规范与注意事项—相机/设备—镜头—曝光时间—感光度(ISO)—红外探测器—红外光源—滤镜7.技术简史第二次世界大战后出现了多种类型的红外设备,但直到20世纪60年代,才开始有研究团队用IRR作为底层素描检测的主要技术,第一个应用这项技术的是布鲁塞尔皇家文化遗产研究所(KIK-IRPA)。
《红外成像制导》PPT课件

周孟
红外线的发现和分类
1800年,英国物理学家赫歇尔研究单色光 的温度时发现 ,红光外一种看不见的“热 线”,称为红外线。
三个波段:近红外线,波长范围为0.76~ 1.5μm;中红外线,波长范围为1.5~ 5.6μm;远红外线,波长范围为5.6~ 1000μm。
红外成像制导
红外制导:是利用红外探测器捕获和跟踪 目标自身辐射的能量来实现寻地制导的技 术。分为红外成像制导技术和红外非成像 制导技术两大类。 主要用于空空导弹、空地导弹和地空导 弹,约有70余种导弹采用红外制导 。
红外非成像制导:一种被动制导技术 ,它 利用红外探测器捕获和跟踪目标自身所辐 射的红外能量来实现精确制导 。
特点:制导精度高,不受无线电干扰的影 响;可昼夜作战;由于采用被动寻的方式, 攻击隐蔽性好。但受云、雾和烟尘的影响; 并有可能被红外诱饵等热源诱惑,偏离和 丢失目标。
一般用作近程武器的制导系统或nfrared ImagIng):是指借助 对红外线敏感的探测器,不直接接触物体, 来记录物体对红外线的辐射、反射、散射 等信息,通过分析,揭示出物体的特征及 其变化。
有被动红外成像技术和主动红外成像技术
红外成像制导:是一种实时扫描技术,它 将景物表面温度的空间分布情况变成按时 序排列的电信号,并以可见光的形式显示 出来,或将其数字化储存在存储器中,然 后利用图形识别和图像处理技术进行背景 抑制,目标图像增强、目标提取和识别特 征工作,从而得到制导信息。
处理中采用红外弱小目标的图像序列作为 原始图像。在实际红外场景中,背景杂波 将小目标淹没,且分布并不服从理想目标 背景模型,若直接用动态规划进行处理, 结果会产生大量的虚警点。因此,在使用 动态规划方法之前,须进行适当的预处理。
- 1、下载文档前请自行甄别文档内容的完整性,平台不提供额外的编辑、内容补充、找答案等附加服务。
- 2、"仅部分预览"的文档,不可在线预览部分如存在完整性等问题,可反馈申请退款(可完整预览的文档不适用该条件!)。
- 3、如文档侵犯您的权益,请联系客服反馈,我们会尽快为您处理(人工客服工作时间:9:00-18:30)。
Medical near-infrared imagingJ.K.Heino,I.T.Nissilä,E.Somersalo,T.T.Kajava,and T.E.Katila Laboratory of Biomedical Engineering,Helsinki University of Technology,FIN-02015HUT,Finland;Institute of Mathematics,Helsinki University of Technology,FIN-02015HUT,Finland1IntroductionThe use of near-infrared light in functional medi-cal imaging has gained increasing interest during re-cent years.Techniques using near-infrared light for imaging can be used to study,e.g.,hemodynamic re-sponses on the cortex.Brain activation measurements can be performed using,e.g.,MEG or fMRI,which, however,require heavy instrumentation.In medi-cal near-infrared imaging,the instrumentation can be made quite small in size and the costs can also be kept relatively low,which makes portable devices and the use of the technique for long-time monitoring pos-sible.Due to no significant interference with bio-magnetic measurements,the method can be combined with other modalities.Therefore,near-infrared imag-ing is an interesting alternative in performing or veri-fying brain activation measurements.In the following,wefirst describe the principal idea of medical near-infrared imaging and spectroscopy. We then outline the different measurement techniques and some aspects concerning the propagation of near-infrared light in tissue,especially considering the use of the method for imaging.The developments in modeling and instrumentation in our laboratory are then presented.A light transport model is described,and an approach to image recon-struction based on linearization is outlined.The basic design of the frequency domain imager and observa-tion about its performance are presented.2The method2.1Near-infrared spectroscopy and imaging The use of near-infrared light for spectroscopy and imaging is based on the different wavelength depen-dent absorption and scattering properties of tissues. The wavelengths used typically vary from600to 1000nm,a range of wavelengths often referred to as the optical window of tissue.At these wavelengths, many tissues are relatively transparent.At wave-lengths less than600nm,absorption by hemoglobin is very strong,whereas the strong absorption by water prevents using wavelengths beyond1000nm.The principal idea in near-infrared spectroscopy and imaging is to measure the properties of transmit-ted and/or reflected near-infrared light on the surface of the tissue at some distance apart from the light source.In spectroscopic applications,the concentra-tions of absorbing molecules such as oxy-and de-oxyhemoglobin and cytochrome oxidase can be es-timated.For imaging purposes,several light sources and detectors are used,and information about the in-ternal distribution of the absorbers and the scatterers can be retrieved.The aim can be,e.g.,to localize changes in blood circulation and in the concentrations of absorbing molecules.2.2Measurement techniquesThe methods in near-infrared imaging can be di-vided into three classes:continuous wave[1],time-resolved[2,3]and frequency resolved[4,5]tech-niques.In all of the techniques,the principle of the measurements is the same.Light from a light source, usually a laser,is delivered on the surface of the tissue using opticalfibers.At the measurement site,on the surface of the tissue,typically a few centimeters apart from the source position,light is collected by another opticalfiber and delivered to the detector. Continuous wave systems use continuous light and measure the intensity of the transmitted or reflected light.For imaging purposes,however,it is often pre-ferred to have more information on the propagation of light through tissue inhomogeneities.This can be achieved by measuring the temporal behaviour of transmitted light,either in the time or in the frequency domain.In the time domain techniques,a short laser pulse is used as a probe signal,and the distribution of the time-of-flights of the photons is measured.From this so-called temporal point spread function(TPSF),data such as the mean time offlight or some higher mo-ments can be retrieved.Alternatively,one can use a light source whose intensity is modulated with a high frequency,typically between50and800MHz,giving rise to a photon density wave propagating in the tis-sue.The amplitude and the phase shift of this wave relative to the incident light are measured.Theoreti-cally,by employing a range of different frequencies, the TPSF could be reconstructed.In practice,usu-ally a single frequency is employed,and the phase shift can be used to estimate the mean time offlight of the photons.The advantage of the frequency do-main method is that it is less expensive to implement.2.3Imaging using near-infrared lightIn many biological tissues,the propagation of near-infrared light is dominated by scattering.Photons en-tering the tissue are generally multiply scattered be-fore being absorbed or reaching the detector.In a sin-gle measurement,a relatively large volume between the source and the detector is probed.Due to this type of diffusion of photons image reconstruction in near-infrared imaging is a challenging problem.Image reconstruction belongs to class of inverse prob-lems.In optical imaging,the inverse problem consists offinding the distribution of optical parameters in tis-sue,based on a set of measurements on the boundary. For solving the inverse problem,onefirst needs to solve the corresponding forward problem,i.e.to con-struct a model for light transport,that can be used to calculate the measurement set on the boundary,know-ing the distribution of optical parameters.3Modeling and image reconstruc-tion3.1Model for light transportBased on the particle interpretation,light can be ex-amined as a stream of energetic particles,photons.If the photon density is interpreted as proportional to the scalarfield for energy radiance,various differential and integrodifferential equations can be established based on energy conservation.In thefield of opti-cal imaging,the most widely applied equation is the radiative transfer equation(RTE)[6,7],which is a balance equation describing the change of energy ra-diance in time due to changes in energyflow.For model construction,simplifications to the RTE are usually required.A common approach in appli-cations related to medical optical imaging is to use the diffusion equation(DE)[8],which can be derived from the RTE with a so called P1-approximation[6] and some assumptions valid for strongly scattering media[9].If the measurements are performed in the frequency domain,the forward model can be constructed using the frequency domain diffusion equation,which is ob-tained from the time domain diffusion equation via Fourier transform:(1)where is the complexfluence aris-ing from the intensity modulated part of the source term,the angular modulation frequency,the diffusion coefficient,the absorption coefficient and the effective scattering coefficient.At the measurement site on the bound-ary,the complex exitance,i.e.the outward directed flux,is calculated as:(2) where is the outward directed normal to the surface. The complex exitance is then used to obtain the mea-surable quantities,the amplitude(3) and the phase angle(4) of the photon density wave.As the boundary condition,so called Robin bound-ary condition[10],which can be derived from the as-sumption that the total inward directed energy current at the boundary is zero,is used:(5) The light source is modelled as an isotropic point source at a depth of below the surface of the medium[10].For iterative reconstruction algorithms,a relatively fast andflexible light transport model is desirable.For the numerical solution of the model described above, thefinite element(FE)method was used.A two di-mensional FE model with linear basis functions was implemented.3.2Solution to the inverse problemA widely used class of methods to address the inverse problem are techniques based on linearization and it-eration.In these approaches,the non-linear model0.20.40.60.811.21.41.6Figure 1:Reconstruction of a perturbation in the ab-sorption coefficientbased on the logarithm of the modulation amplitude.On the background,cm and cm ,and inside a sphereof a radius of 0.4cm,centered at,cm .between the optical parameters and measurement quantities is linearized at point:(6)In Eq.6,,the derivative of the set of measurement quantities with respect to the set of optical parame-ters,is a large Jacobian matrix,which is needed for the reconstruction scheme.The FE model for the di-rect problem can be used to calculate ing linearization and Tikhonov regularization,the solution of the inverse problem can be expressed as a minimization problem:sol min(7)where is a regularization parameter and a regu-larization matrix incorporating prior knowledge.For ,e.g.a unit matrix can be used.From the mini-mization scheme,the gradient can be solved andthe solution presented as.In Fig.1,a reconstruction of a perturbation on the absorption coefficient in a homogeneous background using cal-culated data is presented.The reconstruction is based on the logarithm of the modulation amplitude and a single step of the gradient.4Instrumentation4.1GeneralThe instrument under development in our laboratory is based on the frequency domain technique.The light source is a laser diode,which has a wavelength be-tween 750nm and 850nm.Optical powers between 5mW and 40mW can be used with a high modula-tion efficiency.The light is intensity modulated using a modulation frequency in the RF region;100MHz and 450MHz have been tested.In principle,with cur-rent laser diodes,the modulation frequency can be as high as 800MHz.However,at higher frequencies,it is very difficult to retain the signal-to-noise ratio and dynamic range available at 100MHz.The light is guided into an optical fiber and into a PC-controlled fiberoptic switch,which directs the light to one of 16source fibers.Light from the detection posi-tion is guided with a fiber bundle to a system consist-ing of a shutter and an aspherical lens,which focuses the light into a photomultiplier tube (PMT).The de-tection system is designed so that 1-4bundles (one of which is selected active at a time)can be used with each detector.The optical fibers are attached to the tissue with a grid,which is heated and bent to match the shape of the tissue.In cases where there is no hair under the probes,a prism attachment can be used as an alterna-tive.The signal from the PMT is amplified and mixed with a second RF signal,which has a slightly different fre-quency from the modulation signal.The frequency difference is continuously compared with the inter-nal reference of the digital lock-in amplifier that per-forms the phase and amplitude measurement.The fre-quency of the secondary RF oscillator is continuously adjusted so that the two frequencies match.4.2Instrument performanceAt 100MHz,the detection limit of the instrument isapproximately,which corresponds to a light level ofat 800nm.A typical signal amplitude with a 3cm separation on the adult head with light hair is 0.3mV .The signal to noise ratio of the amplitude in a phantom measurement at this sig-nal level is about,which results in a phase precision of .In a physiological measurement,the noise is higher due to physiological changes in the tissue and the softness of tissue.The phase driftdue to the electronics is approximatelyfor theFigure2:Block diagram of the instrument.first hour after startup,and after that.The detector and the laser diode produce a larger drift,but temperature stabilization is expected to improve this. Accurate phase measurement requires that only the phase shift of the photon density wave affects the measured phase.In practice,a high anode current in the photomultiplier tube causes amplitude-dependent changes in the measured phase.This is a subject of ongoing research.5ConclusionsInitially,the instrument will be used for topograph-ical cortical activation studies,and in the future,for optical tomography.In three-dimensional imaging, a larger dynamic range of the measured intensity is necessary so that measurements at a wide range of source-to-detector distances can be performed.For imaging,more rigorous modeling and reconstruc-tion methods are being developed.The FE light trans-port model and the reconstruction algorithm based on linearization form a basis for further research.AcknowledgementsThis work was supported by TEKES,the Academy of Finland,the graduate school Functional Studies in Medicine,and TES.The authors wish to acknowledge the considerable efforts of the research group,includ-ing Kalle Kotilahti,Tommi Noponen,Petra Sohlman and Juha-Matti Perkkiö.References[1]H.Liu and D.A.Boas and Y.Zhang and A.G.Yodh and B.Chance,"A simplified approach tocharacterize optical properties and blood oxy-genation in tissue using continuous near infraredlight"Proc.SPIE2389,496–502,1995.[2]H.Liu and M.Miwa and B.Beauvoit andN.G.Wang and B.Chance,"Characteriza-tion of Absorption and Scattering Properties ofSmall-V olume Biological Samples Using Time-Resolved Spectroscopy",Analyt.Biochem.213,378–385,1993.[3]J.C.Hebden and S.R.Arridge,"Time-ResolvedImaging of Solid Tissue Phantoms Using a Per-turbation Model"in OSA TOPS on Advances inOptical Imaging and Photon Migration2,R.R.Alfano and J.G.Fujimoto,Eds.,1996,pp.93–98.[4]B.Chance and M.Cope and E.Gratton and N.Ramanujam and B.Tromberg,"Phase measure-ment of light absorption and scatter in humantissue",Rev.Sci.Instrum.69,3457–3481,1998.[5]S.L.Jacques,"Principles of phase-resolved op-tical measurements"in SPIE Future Trends inBiomedical Applications of Lasers1525,1991,pp.143–153.[6]Kenneth M.Case and Paul F.Zweifel,LinearTransport Theory,Addison-Wesley,1967. [7]S.Chandrasekhar,Radiative transfer,DoverPublications,Inc.,New York,1960.[8]S.R.Arridge and M.Schweiger and M.Hiraokaand D.T.Delpy,"Afinite element approachfor modeling photon transport in tissue",Med.Phys.20,299–309,1993.[9]J.B.Fishkin and E.Gratton,"Propagation ofphoton-density waves in strongly scattering me-dia containing an absorbing semi-infinite planebounded by a straight edge",J.Opt.Soc.Am.A10,127–140,1993.[10]M.Schweiger and S.R.Arridge and M.Hiraokaand D.T.Delpy,"Thefinite element methodfor the propagation of light in scattering media:Boundary and source conditions",Med.Phys.22,1779–1792,1995.。