corporate finance Chap009-new
Corporate Finance 第7版 答案Ch009
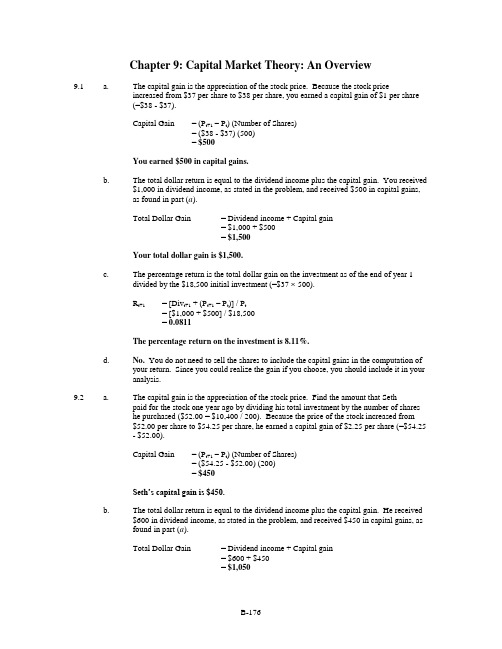
Chapter 9: Capital Market Theory: An Overview9.1 a. The capital gain is the appreciation of the stock price. Because the stock priceincreased from $37 per share to $38 per share, you earned a capital gain of $1 per share(=$38 - $37).Capital Gain = (P t+1– P t) (Number of Shares)= ($38 - $37) (500)= $500You earned $500 in capital gains.b.The total dollar return is equal to the dividend income plus the capital gain. You received$1,000 in dividend income, as stated in the problem, and received $500 in capital gains,as found in part (a).Total Dollar Gain = Dividend income + Capital gain= $1,000 + $500= $1,500Your total dollar gain is $1,500.c.The percentage return is the total dollar gain on the investment as of the end of year 1divided by the $18,500 initial investment (=$37 500).R t+1= [Div t+1 + (P t+1– P t)] / P t= [$1,000 + $500] / $18,500= 0.0811The percentage return on the investment is 8.11%.d.No. You do not need to sell the shares to include the capital gains in the computation ofyour return. Since you could realize the gain if you choose, you should include it in youranalysis.9.2 a. The capital gain is the appreciation of the stock price. Find the amount that Sethpaid for the stock one year ago by dividing his total investment by the number of shareshe purchased ($52.00 = $10,400 / 200). Because the price of the stock increased from$52.00 per share to $54.25 per share, he earned a capital gain of $2.25 per share (=$54.25- $52.00).Capital Gain = (P t+1– P t) (Number of Shares)= ($54.25 - $52.00) (200)= $450Seth’s capital gain is $450.b. The total dollar return is equal to the dividend income plus the capital gain. He received$600 in dividend income, as stated in the problem, and received $450 in capital gains, asfound in part (a).Total Dollar Gain = Dividend income + Capital gain= $600 + $450= $1,050Seth’s total dollar return is $1,050.c. The percentage return is the total dollar gain on the investment as of the end of year 1divided by the initial investment of $10,400.R t+1= [Div t+1 + (P t+1– P t)] / P t= [$600 + $450] / $10,400= 0.1010The percentage return is 10.10%.e.The dividend yield is equal to the dividend payment divided by the purchase price of thestock.Dividend Yield = Div1 / P t= $600 / $10,400= 0.0577The stock’s dividend yield is 5.77%.9.3Apply the percentage return formula. Note that the stock price declined during the period. Sincethe stock price decline was greater than the dividend, your return was negative.R t+1= [Div t+1 + (P t+1– P t)] / P t= [$2.40 + ($31 - $42)] / $42= -0.2048The percentage return is –20.48%.9.4Apply the holding period return formula. The expected holding period return is equal to the totaldollar return on the stock divided by the initial investment.R t+2= [P t+2– P t] / P t= [$54.75 - $52] / $52= 0.0529The expected holding period return is 5.29%.9.5Use the nominal returns, R, on each of the securities and the inflation rate, π, of 3.1% to calculatethe real return, r.r = [(1 + R) / (1 + π)] – 1a.The nominal return on large-company stocks is 12.2%. Apply the formula for the realreturn, r.r = [(1 + R) / (1 + π)] – 1= [(1 + 0.122) / (1 + 0.031)] – 1= 0.0883The real return on large-company stocks is 8.83%.b.The nominal return on long-term corporate bonds is 6.2%. Apply the formula for the realreturn, r.r = [(1 + R) / (1 + π)] – 1= [(1 + 0.062) / (1 + 0.031)] – 1= 0.03The real return on long-term corporate bonds is 3.0%.c.The nominal return on long-term government bonds is 5.8%. Apply the formula for thereal return, r.r = [(1 + R) / (1 + π)] – 1= [(1 + 0.058) / (1 + 0.031)] – 1= 0.0262The real return on long-term government bonds is 2.62%.d.The nominal return on U.S. Treasury bills is 3.8%. Apply the formula for the real return,r.r = [(1 + R) / (1 + π)] – 1= [(1 + 0.038) / (1 + 0.031)] – 1= 0.00679The real return on U.S. Treasury bills is 0.679%.9.6The difference between risky returns on common stocks and risk-free returns on Treasury bills iscalled the risk premium. The average risk premium was 8.4 percent (= 0.122 – 0.038) over theperiod. The expected return on common stocks can be estimated as the current return on Treasury bills, 2 percent, plus the average risk premium, 8.4 percent.Risk Premium = Average common stock return – Average Treasury bill return= 0.122 – 0.038= 0.084E(R) = Treasury bill return + Average risk premium= 0.02 + 0.084= 0.104The expected return on common stocks is 10.4 percent.9.7Below is a diagram that depicts the stocks’ price movements. Two years ago, each stock had thesame price, P0. Over the first year, General Materials’ stock price increa sed by 10 percent, or (1.1) ⨯P0. Standard Fixtures’ stock price declined by 10 percent, or (0.9) ⨯P0. Over the second year,General Materials’ stock price decreased by 10 percent, or (0.9) (1.1) ⨯P0, while StandardFixtures’ stock price increased by 10 percent, or (1.1) (0.9) ⨯P0. Today, each of the stocks isworth 99% of its original value.General Materials 0 00= (0.99) P0Standard Fixtures P0 (0.9) P0(0.9) (1.1) P0 = (0.99) P09.8Apply the five-year holding-period return formula to calculate the total return on the S&P 500over the five-year period.Five-year holding-period return = (1 +R1) ⨯ (1 +R2) ⨯ (1 +R3) ⨯ (1 +R4) ⨯ (1 +R5) – 1= (1 + -0.0491) ⨯ (1 + 0.2141) ⨯ (1 + 0.2251) ⨯(1 + 0.0627) ⨯ (1 + 0.3216) – 1= 0.9864The five-year holding-period return is 98.64 percent.9.9The historical risk premium is the difference between the average annual return on long-termcorporate bonds and the average risk-free rate on Treasury bills. The average risk premium is 2.4 percent (= 0.062 – 0.038).Risk Premium = Average corporate bond return – Average Treasury bill return= 0.062 – 0.038= 0.024The expected return on long-term corporate bonds is equal to the current return on Treasury bills,2 percent, plus the average risk premium, 2.4 percent.E(R) = Treasury bill return + Average risk premium= 0.02 + 0.024= 0.044The expected return on long-term corporate bonds is 4.4%.9.10 a. To calculate the expected return, multiply the return for each of the three scenarios by therespective probability of occurrence.E(R M) = R Recession⨯ Prob(Recession)+ R Normal⨯ Prob(Normal) + R Boom⨯ Prob(Boom)= -0.082 ⨯ 0.25 + 0.123 ⨯ 0.50 + 0.258 ⨯ 0.25= 0.1055The expected return on the market is 10.55 percent.E(R T) = R Recession⨯ Prob(Recession)+ R Normal⨯ Prob(Normal) + R Boom⨯ Prob(Boom)= 0.035 ⨯ 0.25 + 0.035 ⨯ 0.50 + 0.035 ⨯ 0.25= 0.035The expected return on Treasury bills is 3.5 percent.b.The expected risk premium is the difference between the expected market return and theexpected risk-free return.Risk Premium = E(R M) – E(R T)= 0.1055 – 0.035= 0.0705The expected risk premium is 7.05 percent.9.11 a. Divide the sum of the returns by seven to calculate the average return over the seven-yearperiod.R= (R t-7 + R t-6 + R t-5 + R t-4 + R t-3 + R t-2 + R t-1) / (7)= (-0.026 + -0.01 + 0.438 + 0.047 + 0.164 + 0.301 + 0.199) / (7)= 0.159The average return is 15.9 percent.b.The variance, σ2, of the portfolio is equal to the sum of the squared differences betweeneach return and the mean return [(R - R)2], divided by six.R R - R(R - R)2-0.026 -0.185 0.03423-0.01 -0.169 0.028560.438 0.279 0.077840.047 -0.112 0.012540.164 0.005 0.000030.301 0.142 0.020160.199 0.040 0.00160Total 0.17496Because the data are historical, the appropriate denominator in the calculation of thevariance is six (=T– 1).σ2= [∑(R - R)2] / (T– 1)= 0.17496 / (7 – 1)= 0.02916The variance of the portfolio is 0.02916.The standard deviation is equal to the square root of the variance.σ= (σ2)1/2= (0.02916)1/2= 0.1708The standard deviation of the portfolio is 0.1708.9.12 a. Calculate the difference between the return on common stocks and the return on Treasurybills.Year CommonStocksTreasuryBillsRealizedRisk Premium-7 32.4% 11.2% 21.2% -6 -4.9 14.7 -19.6 -5 21.4 10.5 10.9 -4 22.5 8.8 13.7 -3 6.3 9.9 -3.6 -2 32.2 7.7 24.5 Last 18.5 6.2 12.3b.The average realized risk premium is the sum of the premium of each of the seven years,divided by seven.Average Risk Premium = (0.212 + -0.196 + 0.109 + .137 + -0.036 + 0.245 + 0.123) / 7= 0.0849The average risk premium is 8.49 percent.c.Yes. It is possible for the observed risk premium to be negative. This can happen in anysingle year, as it did in years -6 and -3. The average risk premium over many years islikely positive.9.13 a. To calculate the expected return, multiply the return for each of the three scenarios by therespective probability of that scenario occurring.E(R) = R Recession⨯ Prob(Recession)+ R Moderate⨯ Prob(Moderate) + R Rapid⨯ Prob(Rapid)= 0.05 ⨯ 0.2 + 0.08 ⨯ 0.6 + 0.15 ⨯0.2= 0.088The expected return is 8.8 percent.b.The variance, σ2, of the stock is equal to the sum of the weighted squared differencesbetween each return and the mean return [Prob(R) ⨯ (R - R)2]. Use the mean returncalculated in part (a).R R - R(R - R)2Prob(R) ⨯ (R - R)20.05 -0.038 0.001444 0.00028880.08 -0.008 0.000064 0.00003840.15 0.062 0.003844 0.0007688Variance 0.0010960 The standard deviation, σ, is the square root of the variance.σ= (σ2)1/2= (0.0010960)1/2= 0.03311The standard deviation is 0.03311.9.14 a. To calculate the expected return, multiply the market return for each of the fivescenarios by the respective probability of occurrence.R M= (0.23 ⨯ 0.12) + (0.18 ⨯ 0.4) + (0.15 ⨯ 0.25) + (0.09 ⨯ 0.15) + (0.03 ⨯ 0.08)= 0.153The expected return on the market is 15.3 percent.b.To calculate the expected return, multiply the stock’s return for each of the five scenariosby the respective probability of occurrence.R= (0.12 ⨯ 0.12) + (0.09 ⨯ 0.4) + (0.05 ⨯ 0.25) + (0.01 ⨯ 0.15) + (-0.02 ⨯ 0.08)= 0.0628The expected return on Tribli stock is 6.28 percent.9.15 a. Divide the sum of the returns by four to calculate the expected returns on BelinkieEnterprises and Overlake Company over the four-year period.R Belinkie= (R1 + R2 + R3 + R4) / (4)= (0.04 + 0.06 + 0.09 + 0.04) / 4= 0.0575The expected return on Belinkie Enterprises stock is 5.75 percent.R Overlake = (R1 + R2 + R3 + R4) / (4)= (0.05 + 0.07 + 0.10 + 0.14) / (4)= 0.09The expected return on Overlake Company stock is 9 percent.b.The variance, σ2, of each stock is equal to the sum of the weighted squared differencesbetween each return and the mean return [Prob(R) ⨯ (R - )2]. Use the mean returncalculated in part (a). Each of the four states is equally likely.Belinkie Enterprises:R R - R(R - R)2Prob(R) ⨯ (R - R)20.04 -0.0175 0.00031 0.0000770.06 0.0025 0.00001 0.0000030.09 0.0325 0.00106 0.0002640.04 -0.0175 0.00031 0.000077Variance 0.000421 The variance of Belinkie Enterprises stock is 0.000421.Overlake Company:R R - R(R - R)2Prob(R) ⨯ (R - R)20.05 -0.04 0.0016 0.00040.07 -0.02 0.0004 0.00010.10 0.01 0.0001 0.0000250.14 0.05 0.0025 0.000625Variance 0.00115 The variance of Overlake Company stock is 0.00115.9.16 a. Divide the sum of the returns by five to calculate the average return over the five-yearperiod.R S= (R1 + R2 + R3 + R4 + R5) / (5)= (0.477 + 0.339 + -0.35 + 0.31 + -0.005) / (5)= 0.1542The average return on small-company stocks is 15.42 percent.R M= (R1 + R2 + R3 + R4 + R5) / (5)= (0.402 + 0.648 + -0.58 + 0.328 + 0.004) / (5)= 0.1604The average return on the market index is 16.04 percent.b.The variance, σ2, of each is equal to the sum of the squared differences between eachreturn and the mean return [(R - R)2], divided by four. The standard deviation, σ, is thesquare root of the variance.Small-company stocks:R S R- R S (R S - R S)2S0.477 0.3228 0.104199840.339 0.1848 0.03415104-0.35 -0.5042 0.254217640.31 0.1558 0.02427364-0.005 -0.1592 0.02534464Total 0.44218680Because the data are historical, the appropriate denominator in the variance calculation is four (=T– 1).σ2S= [∑(R S - R S)2] / (T– 1)= 0.44218680 / (5 – 1)= 0.1105467The variance of the small-company returns is 0.1105467.The standard deviation is equal to the square root of the variance.σS= (σ2S)1/2= (0.1105467)1/2= 0.33249The standard deviation of the small-company returns is 0.33249.Market Index of Common Stocks:R S R- R S (R S - R S)2S0.402 0.2416 0.058370560.648 0.4876 0.23775376-0.58 -0.7404 0.548192160.328 0.1676 0.028089760.004 -0.1564 0.02446096Total 0.89686720Because the data are historical, the appropriate denominator in the variance calculation isfour (=T– 1).σ2S= [∑(R S - R S)2] / (T– 1)= (0.89686720) / (5 –1)= 0.2242168The variance of the market index of common stocks is 0.2242168.The standard deviation is equal to the square root of the variance.σS= (σ2S)1/2= (0.2242168)1/2= 0.47352The standard deviation of the market index is 0.47352.9.17 Common Stocks:Divide the sum of the returns by seven to calculate the average return over the seven-yearperiod.R CS= (R1 + R2 + R3 + R4 + R5 + R6 + R7) / (7)= (0.3242 + -0.0491 + 0.2141 + 0.2251 + 0.0627 + 0.3216 + 0.1847) / (7)= 0.1833The average return on common stocks is 18.33 percent.The variance, σ2, is equal to the sum of the squared differences between each return and the mean return [(R - R)2], divided by six.R CS R- R CS (R CS - R CS)2CS0.3242 0.1409 0.0198-0.0491 -0.2324 0.05400.2141 0.0308 0.00090.2251 0.0418 0.00170.0627 -0.1206 0.01460.3216 0.1383 0.01910.1847 0.0014 0.0000TotalBecause the data are historical, the appropriate denominator in the variance calculation is six (=T–1).σ2CS= [∑(R CS - R C S)2] / (T– 1)= (0.1102) / (7 – 1)= 0.018372The variance of the common stock returns is 0.018372.Small Stocks:Divide the sum of the returns by seven to calculate the average return over the seven-year period.R SS= (R1 + R2 + R3 + R4 + R5 + R6 + R7) / (7)= (0.3988 + 0.1388 + 0.2801 + 0.3967 + -0.0667 + 0.2466 + 0.0685) / (7)= 0.2090The average return on small stocks is 20.90 percent.The variance, σ2, is equal to the sum of the squared differences between each return and the mean return [(R - R)2], divided by six.R SS R- R SS (R SS - R SS)2SS0.3988 0.1898 0.03600.1388 -0.0702 0.00490.2801 0.0711 0.00510.3967 0.1877 0.0352-0.0667 -0.2757 0.07600.2466 0.0376 0.00140.0685 -0.1405 0.0197Total 0.1784Because the data are historical, the appropriate denominator in the calculation of the variance is six (=T– 1).σ2SS= [∑(R SS - R SS)2] / (T– 1)= (0.1784) / (7 – 1)= 0.029734The variance of the small stock returns is 0.029734.Long-Term Corporate Bonds:Divide the sum of the returns by seven to calculate the average return over the seven-year period.R CB= (R1 + R2 + R3 + R4 + R5 + R6 + R7) / (7)= (-0.0262 + -0.0096 + 0.4379 + 0.0470 + 0.1639 + 0.3090 + 0.1985) / (7)= 0.1601The average return on long-term corporate bonds is 16.01 percent.The variance, σ2, is equal to the sum of the squared differences between each return and the mean return [(R - R)2], divided by six.R CB R- R CB (R CB - R CB)2CB-0.0096 -0.1697 0.02880.4379 0.2778 0.07720.0470 -0.1131 0.01280.1639 0.0038 0.00000.3090 0.1489 0.02220.1985 0.0384 0.0015Total 0.1771Because the data are historical, the appropriate denominator in the calculation of the variance is six (=T– 1).σ2CB= [∑(R CB - R CB)2] / (T– 1)= (0.1771) / (7 – 1)= 0.029522The variance of the long-term corporate bond returns is 0.029522.Long-Term Government Bonds:Divide the sum of the returns by seven to calculate the average return over the seven-year period.R GB= (R1 + R2 + R3 + R4 + R5 + R6 + R7) / (7)= (-0.0395 + -0.0185 + 0.4035 + 0.0068 + 0.1543 + 0.3097 + 0.2444) / (7)= 0.1568The average return on long-term government bonds is 15.68 percent.The variance, σ2, is equal to the sum of the squared differences between each return and the mean return [(R - R)2], divided by six.R GB R- R GB (R GB - R GB)2GB-0.0395 -0.1963 0.0385-0.0185 -0.1383 0.01910.4035 0.2467 0.06090.0068 -0.1500 0.02250.1543 -0.0025 0.00000.3097 0.1529 0.02340.2444 0.0876 0.0077Total 0.1721Because the data are historical, the appropriate denominator in the calculation of the variance is six (=T– 1).σ2GB= [∑(R GB - R GB)2] / (T– 1)= (0.1721) / (7 – 1)= 0.02868The variance of the long-term government bond returns is 0.02868.U.S. Treasury Bills:Divide the sum of the returns by seven to calculate the average return over the seven-yearperiod.R TB= (R1 + R2 + R3 + R4 + R5 + R6 + R7) / (7)= (0.1124 + 0.1471 + 0.1054 + 0.0880 + 0.0985 + 0.0772 + 0.0616) / (7)= 0.0986The average return on the Treasury bills is 9.86 percent.The variance, σ2, is equal to the sum of the squared differences between each return and the mean return [(R - R)2], divided by six.R TB R- R TB (R TB - R TB)2TB0.1124 0.0138 0.00020.1471 0.0485 0.00240.1054 0.0068 0.00000.0880 -0.0106 0.00010.0985 -0.0001 0.00000.0772 -0.0214 0.00050.0616 -0.0370 0.0014Total 0.0045Because the data are historical, the appropriate denominator in the calculation of the variance issix (=T– 1).σ2TB= [∑(R TB - R TB)2] / (T– 1)= (0.0045) / (7 – 1)= 0.00075The variance of the Treasury bill returns is 0.00075.9.18 a. Divide the sum of the returns by six to calculate the average return over the six-year period.R S= (R1 + R2 + R3 + R4 + R5 + R6 + R7) / (6)= (0.0685 + -0.0930 + 0.2287 + 0.1018 + -0.2156 + 0.4463) / (6)= 0.0895The average return on small-company stocks is 8.95 percent.R T= (R1 + R2 + R3 + R4 + R5 + R6 + R7) / (6)= (0.0616 + 0.0547 + 0.0635 + 0.0837 + 0.0781 + 0.056) / (6)= 0.0663The average return on U.S. Treasury bills is 6.63 percent.b.The variance, σ2, of each security is equal to the sum of the squared differences betweeneach return and the mean return [(R - R)2], divided by five. The standard deviation isequal to the square root of the variance.Small-Company Stocks:R S R- R S (R S - R S)2S0.0685 -0.020950 0.000439-0.0930 -0.182450 0.0332880.2287 0.139250 0.0193910.1018 0.012350 0.000153-0.2156 -0.305050 0.0930560.4463 0.356850 0.127342Total 0.273667Because the data are historical, the appropriate denominator in the calculation of the variance is five (=T– 1).σ2S= [∑(R S - R S)2] / (T– 1)= (0.273667) / (6 –1)= 0.054733The variance of small-company stocks is 0.0547.The standard deviation is equal to the square root of the variance.σS= (σ2S)1/2= (0.054733)1/2= 0.2340The standard deviation of small-company stocks is .2340.U.S. Treasury bills:R T R- R T (R T - R T)2T0.0616 -0.004667 0.0000220.0547 -0.011567 0.0001340.0635 -0.002767 0.0000080.0837 0.017433 0.0003040.0781 0.011833 0.0001400.0560 -0.010267 0.000105Total 0.000713Because the data are historical, the appropriate denominator in the calculation of the variance is five (=T– 1).σ2T= [∑(R T - R T)2] / (T– 1)= (0.000713) / (6 –1)= 0.000143The variance of small-company stocks is 0.000143.The standard deviation is equal to the square root of the variance.σT= (σ2T)1/2= (0.000143)1/2= 0.0119The standard deviation of small-company stocks is 0.0119.c.The average return on Treasury bills is lower than the average return on small-companystocks. However, the standard deviation of the returns on Treasury bills is also lowerthan the standard deviation of the small-company stock returns. There is a positiverelationship between the risk of a security and the expected return on a security.9.19 According to the normal distribution, there is a 95.44 percent probability that a return will bewithin two standard deviations of the mean. Thus, roughly 95 percent of International Trading’sreturns will fall within two standard deviations of the mean.Range of Returns = ± (2 ⨯σ)= 0.175 ± (2 ⨯ 0.085)= [0.005, 0.345]The range in which 95 percent of the returns will fall is between 0.5 percent and 34.5 percent.。
公司理财chap009

9-21
Loan Amortization
• A mortgage loan to be repaid over 20 years at 8% interest:
9-22
Loan Amortization Table
•In such a case the part of the payments to the mortgage company will go toward the payment of interest, with the remainder applied to debt reduction, as indicated in the following table: Table 9–6
• A generalized formula for Future Value of Annuity: FVA = A × FVIFA
Where: FVA = Future value of the Annuity FVIFA = Annuity Factor = {[(1+i)n – 1] ÷ i} A = Annuity value i = Interest rate n = Number of periods; • Assuming, A = $1,000, n = 4, and i = 10%
9-2
Relationship to The Capital Outlay Decision
• The time value of money is used to determine whether future benefits are sufficiently large to justify current outlays
[精选]罗斯《公司理财》(厦门大学沈艺峰老师)上
![[精选]罗斯《公司理财》(厦门大学沈艺峰老师)上](https://img.taocdn.com/s3/m/8392fa5d814d2b160b4e767f5acfa1c7aa0082ec.png)
第一章 导 论 Chapter 1 Introduction
《公司理财》的课程内容
可持续增长模型
公司理财 Corporate Finance
1
外部资金需要量
财务分析
如何才能顺利通过本门课程? How to survive?
• 案例(case) 20%Biblioteka • 期中测试20%
• 期末考试(final examination) 50%
• 做好各项财务收支的计划、控 制、核算、分析和考核工作
• 依法合理筹集资金
• 有效利用各项资产,努力提高 经济效益
第一章 导 论 Chapter 1 Introduction
公司理财的环境
• 金融环境 • 税收环境 • 法律环境 • 社会环境 • 政府
公司理财 Corporate Finance
公司理财 Corporate Finance
1
第四章 流动资金管理 Chapter 4 Working Capital Management
流动资金管理
• 流动资金(Working Capital)指占用在流动 资产上的资金。
• 流动资产指可在一年内 或一个营业周期内转换 成现金或运用的其他资 产。
Q* = 最优库存现金持有量
公司理财 Corporate Finance
1
第四章 流动资金管理 Chapter 4 Working Capital Management
米勒-俄尔(Miller-Orr)模型
3b 2
3
Z= 4i
h = 3Z
Z = 最优库存现金持有量 b = 变现成本
= 日净现金流量的方差
可持续增长模型-另一种思维
• 资产=负债 + 权益
公司理财第九版罗斯课后案例答案 Case Solutions Corporate Finance
公司理财第九版罗斯课后案例答案 Case Solutions CorporateFinance1. 案例一:公司资金需求分析问题:一家公司需要资金支持其新项目。
通过分析现金流量,推断该公司是否需要向外部借款或筹集其他资金。
解答:为了确定公司是否需要外部资金,我们需要分析公司的现金流量状况。
首先,我们需要计算公司的净现金流量(净收入加上非现金项目)。
然后,我们需要将净现金流量与项目的投资现金流量进行对比。
假设公司预计在项目开始时投资100万美元,并在项目运营期为5年。
预计该项目每年将产生50万美元的净现金流量。
现在,我们需要进行以下计算:净现金流量 = 年度现金流量 - 年度投资现金流量年度投资现金流量 = 100万美元年度现金流量 = 50万美元净现金流量 = 50万美元 - 100万美元 = -50万美元根据计算结果,公司的净现金流量为负数(即净现金流出),意味着公司每年都会亏损50万美元。
因此,公司需要从外部筹集资金以支持项目的运营。
2. 案例二:公司股权融资问题:一家公司正在考虑通过股权融资来筹集资金。
根据公司的财务数据和资本结构分析,我们需要确定公司最佳的股权融资方案。
解答:为了确定最佳的股权融资方案,我们需要参考公司的财务数据和资本结构分析。
首先,我们需要计算公司的资本结构比例,即股本占总资本的比例。
然后,我们将不同的股权融资方案与资本结构比例进行对比,选择最佳的方案。
假设公司当前的资本结构比例为60%的股本和40%的债务,在当前的资本结构下,公司的加权平均资本成本(WACC)为10%。
现在,我们需要进行以下计算:•方案一:以新股发行筹集1000万美元,并将其用于项目投资。
在这种方案下,公司的资本结构比例将发生变化。
假设公司的股本增加至80%,债务比例减少至20%。
根据资本结构比例的变化,WACC也将发生变化。
新的WACC可以通过以下公式计算得出:新的WACC = (股本比例 * 股本成本) + (债务比例 * 债务成本)假设公司的股本成本为12%,债务成本为8%:新的WACC = (0.8 * 12%) + (0.2 * 8%) = 9.6%•方案二:以新股发行筹集5000万美元,并将其用于项目投资。
Corporate finance Chap009
• SML shows relationship between return and risk
• CAPM uses beta as proxy for risk • Other methods can also determine slope of
SML and beta
9-17
9-2 MEASURING THE COST OF EQUITY
• Company cost of capital (COC) is based on
average beta of assets
• Average beta of assets is based on the % of
funds in each asset
• Company Cost of Capital
Cat egory Speculat ive vent ures New product s Expansionof exist ingbusiness Cost improvemen t , known t ech nology Discount Rat e 15.0% 8.0% 3.8%(COC) 2.0%
C1 1,000 ,000 PV $909 ,100 1 r 1.1
9-21
9-3 ANALYZING PROJECT RISK
• Allowing for Possible Bad Outcomes
• Example, continued
• Company’s engineers are behind schedule
Chapter
9
RISK AND THE COST OF CAPITAL
(完整word版)CorporateFinance重点知识整理

(完整word版)CorporateFinance重点知识整理第一章导论1. 公司目标:为所有者创造价值公司价值在于其产生现金流能力。
2。
财务管理的目标:最大化现有股票的每股现值。
3。
公司理财可以看做对一下几个问题进行研究:1。
资本预算:公司应该投资什么样的长期资产。
2. 资本结构:公司如何筹集所需要的资金。
3. 净运营资本管理:如何管理短期经营活动产生的现金流。
4. 公司制度的优点:有限责任,易于转让所有权,永续经营。
缺点:公司税对股东的双重课税。
第二章会计报表与现金流量资产= 负债+ 所有者权益(非现金项目有折旧、递延税款)EBIT(经营性净利润)= 净销售额—产品成本—折旧EBITDA = EBIT + 折旧及摊销现金流量总额CF(A) = 经营性现金流量—资本性支出—净运营资本增加额= CF(B)+ CF(S)经营性现金流量OCF = 息税前利润+ 折旧- 税资本性输出= 固定资产增加额+ 折旧净运营资本= 流动资产- 流动负债第三章财务报表分析与财务模型1. 短期偿债能力指标(流动性指标)流动比率= 流动资产/流动负债(一般情况大于一)速动比率= (流动资产—存货)/流动负债(酸性实验比率)现金比率= 现金/流动负债流动性比率是短期债权人关心的,越高越好;但对公司而言,高流动性比率意味着流动性好,或者现金等短期资产运用效率低下。
对于一家拥有强大借款能力的公司,看似较低的流动性比率可能并非坏的信号2。
长期偿债能力指标(财务杠杆指标)负债比率= (总资产—总权益)/总资产or (长期负债+ 流动负债)/总资产权益乘数= 总资产/总权益= 1 + 负债权益比利息倍数= EBIT/利息现金对利息的保障倍数(Cash coverage radio)= EBITDA/利息3。
资产管理或资金周转指标存货周转率= 产品销售成本/存货存货周转天数= 365天/存货周转率应收账款周转率= (赊)销售额/应收账款总资产周转率= 销售额/总资产= 1/资本密集度4. 盈利性指标销售利润率= 净利润/销售额资产收益率ROA = 净利润/总资产权益收益率ROE = 净利润/总权益(完整word版)CorporateFinance重点知识整理5. 市场价值度量指标市盈率= 每股价格/每股收益EPS 其中EPS = 净利润/发行股票数市值面值比= 每股市场价值/每股账面价值企业价值EV = 公司市值+ 有息负债市值- 现金EV乘数= EV/EBITDA6. 杜邦恒等式ROE = 销售利润率(经营效率)x总资产周转率(资产运用效率)x权益乘数(财杠)ROA = 销售利润率x总资产周转率7. 销售百分比法假设项目随销售额变动而成比例变动,目的在于提出一个生成预测财务报表的快速实用方法。
《Corporate Finance (公司金融学)》课件 (9)
1 •Percentage Returns
–the sum of the cash received and the change in value of the asset divided by the original investment.
9.1 Returns
Dollar Return = Dividend + Change in Market Value
• An investor who held this investment would have actually realized an annual return of 9.58%:
Year Return Geometric average return 1 10% (1 rg )4 (1 r1) (1 r2 ) (1 r3) (1 r4 )
The Future Value of an Investment of $1 in 1926
$1 (1 r1926) (1 r1927) (1 r1999) $2,845.63
1000
$40.22 $15.64
10 Common Stocks Long T-Bonds T-Bills
0.1 1930 1940 1950 1960 1970 1980 1990 2000
Arithmetic average return r1 r2 r3 r4 4
10% 5% 20% 15% 10% 4
Holding Period Returns
• A famous set of studies dealing with the rates of returns on common stocks, bonds, and Treasury bills was conducted by Roger Ibbotson and Rex Sinquefield.
公司理财 习题库 Chap009
CHAPTER 9Net Present Value and Other Investment Criteria I. DEFINITIONSNET PRESENT VALUEa 1. The difference between the present value of an investment and its cost is the:a. net present value.b. internal rate of return.c. payback period.d. profitability index.e. discounted payback period.DISCOUNTED CASH FLOW VALUATIONb 2. The process of valuing an investment by determining the present value of its futurecash flows is called (the):a. constant dividend growth model.b. discounted cash flow valuation.c. average accounting valuation.d. expected earnings model.e. Capital Asset Pricing Model.NET PRESENT VALUE RULEc 3. Which one of the following statements concerning net present value (NPV) is correct?a. An investment should be accepted if, and only if, the NPV is exactly equal to zero.b. An investment should be accepted only if the NPV is equal to the initial cash flow.c. An investment should be accepted if the NPV is positive and rejected if it is negative.d. An investment with greater cash inflows than cash outflows, regardless of when thecash flows occur, will always have a positive NPV and therefore should always beaccepted.e. Any project that has positive cash flows for every time period after the initialinvestment should be accepted.PAYBACKc 4. The length of time required for an investment to generate cash flows sufficient torecover the initial cost of the investment is called the:a. net present value.b. internal rate of return.c. payback period.d. profitability index.e. discounted cash period.CHAPTER 9PAYBACK RULEa 5. Which one of the following statements is correct concerning the payback period?a. An investment is acceptable if its calculated payback period is less than some pre-specified period of time.b. An investment should be accepted if the payback is positive and rejected if it isnegative.c. An investment should be rejected if the payback is positive and accepted if it isnegative.d. An investment is acceptable if its calculated payback period is greater than some pre-specified period of time.e. An investment should be accepted any time the payback period is less than thediscounted payback period, given a positive discount rate.DISCOUNTED PAYBACKe 6. The length of time required for a project’s discounted cash flows to equal the initialcost of the project is called the:a. net present value.b. internal rate of return.c. payback period.d. discounted profitability index.e. discounted payback period.DISCOUNTED PAYBACK RULEd 7. The discounted payback rule states that you should accept projects:a. which have a discounted payback period that is greater than some pre-specified periodof time.b. if the discounted payback is positive and rejected if it is negative.c. only if the discounted payback period equals some pre-specified period of time.d. if the discounted payback period is less than some pre-specified period of time.e. only if the discounted payback period is equal to zero.AVERAGE ACCOUNTING RETURNc 8. An inves tment’s average net income divided by its average book value defines theaverage:a. net present value.b. internal rate of return.c. accounting return.d. profitability index.e. payback period.AVERAGE ACCOUNTING RETURN RULEb 9. An investment is acceptable if its average accounting return (AAR):a. is less than a target AAR.b. exceeds a target AAR.c. exceeds the firm’s return on equity (ROE).d. is less than the firm’s return on assets (ROA).e. is equal to zero and only when it is equal to zero.CHAPTER 9 INTERNAL RATE OF RETURNb. 10. The discount rate that makes the net present value of an investment exactly equal tozero is called the:a. external rate of return.b. internal rate of return.c. average accounting return.d. profitability index.e. equalizer.INTERNAL RATE OF RETURN RULEd 11. An investment is acceptable if its IRR:a. is exactly equal to its net present value (NPV).b. is exactly equal to zero.c. is less than the required return.d. exceeds the required return.e. is exactly equal to 100 percent.MULTIPLE RATES OF RETURNe 12. The possibility that more than one discount rate will make the NPV of an investmentequal to zero is called the _____ problem.a. net present value profilingb. operational ambiguityc. mutually exclusive investment decisiond. issues of scalee. multiple rates of returnMUTUALLY EXCLUSIVE PROJECTSc 13. A situation in which accepting one investment prevents the acceptance of anotherinvestment is called the:a. net present value profile.b. operational ambiguity decision.c. mutually exclusive investment decision.d. issues of scale problem.e. multiple choices of operations decision.PROFITABILITY INDEXd. 14. The present value of an investment’s future cash flows divided by the initial cost of theinvestment is called the:a. net present value.b. internal rate of return.c. average accounting return.d. profitability index.e. profile period.CHAPTER 9PROFITABILITY INDEX RULEa 15. An investment is acceptable if the profitability index (PI) of the investment is:a. greater than one.b. less than one.c. greater than the internal rate of return (IRR).d. less than the net present value (NPV).e. greater than a pre-specified rate of return.II. CONCEPTSCAPITAL BUDGETING DECISIONSa 16. Capital budgeting decisions generally:a. have long-term effects on a firm.b. are of short-duration.c. are easy to revise once implemented.d. focus solely on whether or not a particular asset should be purchased.e. have minimal effects on a firm’s operations.CAPITAL BUDGETING DECISIONSe 17. Which of the following are capital budgeting decisions?I. determining whether to sell bonds or issue stockII. deciding which product markets to enterIII. deciding whether or not to purchase a new piece of equipmentIV. determining which, if any, new products should be produceda. I onlyb. III onlyc. II and IV onlyd. I, III, and IV onlye. II, III, and IV onlyNET PRESENT VALUEd 18. All else constant, the net present value of a project increases when:a. the discount rate increases.b. each cash inflow is delayed by one year.c. the initial cost of a project increases.d. the rate of return decreases.e. all cash inflows occur during the last year of a project’s life instead ofperiodically throughout the life of the project.NET PRESENT VALUEa 19. The primary reason that company projects with positive net present values areconsidered acceptable is that:a. they create value for the owners of the firm.b. the project’s rate of return exceeds the rate of inflation.c. they return the initial cash outlay within three years or less.d. the required cash inflows exceed the actual cash inflows.e. the investment’s cost exceeds the present value of the cash inflows.CHAPTER 9 NET PRESENT VALUEd 20. If a project has a net present value equal to zero, then:I. the present value of the cash inflows exceeds the initial cost of the project.II. the project produces a rate of return that just equals the rate required to accept the project.III. the project is expected to produce only the minimally required cash inflows.IV. any delay in receiving the projected cash inflows will cause the project to have a negative net present value.a. II and III onlyb. II and IV onlyc. I, II, and IV onlyd. II, III, and IV onlye. I, II, and III onlyNET PRESENT VALUEb 21. When computing the net present value of a project, the net amount received fromsalvaging the fixed assets used in the project is:a. subtracted from the initial cash outlay.b. included in the final cash flow of the project.c. excluded from the analysis since it occurs only when the project ends.d. subtracted from the original cost of the assets.e. added to the net present value of the project to determine if the project isacceptable.NET PRESENT VALUEd 22. Net present value:I. when applied properly, can accurately predict the cash flows that will occur if a projectis implemented.II. is highly independent of the rate of return assigned to a particular project.III. is the preferred method of analyzing a project even though the cash flows are only estimates.IV. is affected by the timing of each and every cash flow related to a project.a. I onlyb. III onlyc. II and IV onlyd. III and IV onlye. I, III, and IV onlyNET PRESENT VALUEb 23. Net present value:a. cannot be used when deciding between two mutually exclusive projects.b. is more useful to decision makers than the internal rate of return when comparingdifferent sized projects.c. is easy to explain to non-financial managers and thus is the primary method of analysisused by the lowest levels of management.d. is computed the same as present value when using excel spreadsheets to analyze aproject.e. is very similar in its methodology to the average accounting return.CHAPTER 9PAYBACKc 24. Payback is frequently used to analyze independent projects because:a. it considers the time value of money.b. all relevant cash flows are included in the analysis.c. the cost of the analysis is less than the potential loss from a faulty decision.d. it is the most desirable of all the available analytical methods from a financialperspective.e. it produces better decisions than those made using either NPV or IRR.PAYBACKc 25. The advantages of the payback method of project analysis include the:I. application of a discount rate to each separate cash flow.II. bias towards liquidity.III. ease of use.IV. arbitrary cutoff point.a. I and II onlyb. I and III onlyc. II and III onlyd. II and IV onlye. II, III, and IV onlyPAYBACKd 26. Under the payback method of analysis:a. the initial cash outlay is ignored.b. the cash flow in year 3 is ignored if the required payback period is 4 years.c. a project’s initial cost is discounted.d. the cash flow in year 2 is valued just as highly as the cash flow in year 1 as long as therequired payback period is 3 years or more.e. a project will be acceptable whenever the payback period exceeds the pre-specifiednumber of years.PAYBACKd 27. All else equal, the payback period for a project will decrease whenever the:a. initial cost increases.b. required return for a project increases.c. assigned discount rate decreases.d. cash inflows are moved forward in time.e. duration of a project is lengthened.DISCOUNTED PAYBACKe 28. Discounted payback is used less frequently than payback because:a. the methodology is less desirable from a financial perspective.b. it is so simple to calculate.c. it requires an arbitrary cutoff point.d. it is biased towards liquidity.e. it includes time value of money calculations.CHAPTER 9 DISCOUNTED PAYBACKd 29. The discounted payback period of a project will decrease whenever the:a. discount rate applied to the project is increased.b. initial cash outlay of the project is increased.c. time period of the project is increased.d. amount of each project cash flow is increased.e. costs of the fixed assets utilized in the project increase.DISCOUNTED PAYBACKa 30. The discounted payback rule may cause:a. some positive net present value projects to be rejected.b. the most liquid projects to be rejected in favor of less liquid projects.c. projects to be incorrectly accepted due to ignoring the time value of money.d. projects with negative net present values to be accepted.e. some projects to be accepted which would otherwise be rejected under the paybackrule.AVERAGE ACCOUNTING RETURNe 31. The average accounting rate of return:a. is actually based more on financial values than on accounting values.b. measures net income against the market value of a firm.c. is highly recommended by financial professionals as one of the two best methodologiesused in the analysis of independent projects.d. is the primary methodology used in analyzing independent projects.e. is similar to the return on assets ratio.AVERAGE ACCOUNTING RETURNd 32. Assuming that straight line depreciation is used, the average accounting return for aproject is computed as the average:a. net income of a project divided by the average total assets of a firm.b. book value of a project multiplied by the average profit margin of the project.c. book value of a project divided by the average net income of the project.d. net income of a project divided by the average investment in the project.e. net income of the firm divided by the average investment in a project.AVERAGE ACCOUNTING RETURNd 33. Which of the following are disadvantages associated with the average accountingreturn?I. difficulty in obtaining necessary information to do computationII. exclusion of time value of money considerationsIII. the use of a cutoff rate as a benchmarkIV. the accounting basis of the values used in the computationa. I and IV onlyb. II and III onlyc. I, II, and III onlyd. II, III, and IV onlye. I, II, and IV onlyCHAPTER 9AVERAGE ACCOUNTING RETURNb 34. The average accounting return:a. reflects the projected net effect of the cash flows from a project on the overall firm.b. is comparable to the return on assets and thus provides a similar measure ofperformance.c. reflects the anticipated net impact of a project on the shareholders of the firm.d. rule, when applied, guarantees that only projects that increase shareholder wealth willbe accepted.e. ignores all income produced by a project after an arbitrarily assigned cutoff point. INTERNAL RATE OF RETURNb 35. The internal rate of return (IRR):I. rule states that a project with an IRR that is less than the required rate should beaccepted.II. is the rate generated solely by the cash flows of an investment.III. is the rate that causes the net present value of a project to exactly equal zero.IV. can effectively be used to analyze all investment scenarios.a. I and IV onlyb. II and III onlyc. I, II, and III onlyd. II, III, and IV onlye. I, II, III, and IVINTERNAL RATE OF RETURNe 36. The internal rate of return method of analysis:I. may produce multiple rates of return for a single project.II. may lead to incorrect decisions when comparing mutually exclusive projects.III. is generally more popular in practice than NPV.IV. works best for independent projects with conventional cash flows.a. I and II onlyb. III and IV onlyc. I, III, and IV onlyd. I, II, and IV onlye. I, II, III, and IVINTERNAL RATE OF RETURNa 37. The internal rate of return for a project will increase if:a. the initial cost of the project can be reduced.b. the total amount of the cash inflows is reduced.c. each cash inflow is moved such that it occurs one year later than originally projected.d. the required rate of return is reduced.e. the salvage value of the project is omitted from the analysis.CHAPTER 9 INTERNAL RATE OF RETURNc 38. The internal rate of return is:a. more reliable as a decision making tool than net present value whenever you areconsidering mutually exclusive projects.b. equivalent to the discount rate that makes the net present value equal to one.c. difficult to compute without the use of either a financial calculator or a computer.d. dependent upon the interest rates offered in the marketplace.e. a better methodology than net present value when dealing with unconventional cashflows.INTERNAL RATE OF RETURNd 39. Which of the following are elements of the internal rate of return method of analysis?I. the timing of the cash flowsII. the cutoff point after which any future cash flows are ignoredIII. the rate designated as the minimum acceptable rate for a project to be acceptedIV. the initial cost of an investmenta. I and II onlyb. III and IV onlyc. I, II, and III onlyd. I, III, and IV onlye. II, III, and IV onlyINTERNAL RATE OF RETURNa 40. The internal rate of return tends to be:a. easier for managers to comprehend than the net present value.b. extremely accurate even when cash flow estimates are faulty.c. ignored by most financial analysts.d. used primarily to differentiate between mutually exclusive projects.e. utilized in project analysis only when multiple net present values apply. CROSSOVER POINTe 41. You are trying to determine whether to accept project A or project B. These projectsare mutually exclusive. As part of your analysis, you should compute the crossoverpoint by determining:a. the internal rate of return for the cash flows of each project.b. the net present value of each project using the internal rate of return as the discountrate.c. the discount rate that equates the discounted payback periods for each project.d. the discount rate that makes the net present value of each project equal to 1.e. the internal rate of return for the differences in the cash flows of the two projects.CHAPTER 9CROSSOVER POINTc 42. You are comparing two mutually exclusive projects. The crossover point is 9 percent.You determine that you should accept project A if the required return is 6 percent. Thisimplies that you should:I. reject project B if the required return is 6 percent.II. always accept project A and always reject project B.III. always reject project A any time the discount rate is greater than 9 percent.IV. accept project A any time the discount rate is less than 9 percent.a. I and II onlyb. III and IV onlyc. I, III, and IV onlyd. I, II, and IV onlye. I, II, III, and IVCROSSOVER POINTb 43. Graphing the crossover point helps explain:a. why one project is always superior to another project.b. how decisions concerning mutually exclusive projects are derived.c. how the duration of a project affects the decision as to which project to accept.d. how the net present value and the initial cash outflow of a project are related.e. how the profitability index and the net present value are related.PROFITABILITY INDEXd 44. The profitability index is closely related to:a. payback.b. discounted payback.c. the average accounting return.d. net present value.e. mutually exclusive projects.PROFITABILITY INDEXb 45. Analysis using the profitability index:a. frequently conflicts with the accept and reject decisions generated by the application ofthe net present value rule.b. is useful as a decision tool when investment funds are limited.c. is useful when trying to determine which one of two mutually exclusive projectsshould be accepted.d. utilizes the same basic variables as those used in the average accounting return.e. produces results which typically are difficult to comprehend or apply. PROFITABILITY INDEXe 46. If you want to review a project from a benefit-cost perspective, you should use the_____ method of analysis.a. net present valueb. paybackc. internal rate of returnd. average accounting returne. profitability indexPROFITABILITY INDEXb 47. When the present value of the cash inflows exceeds the initial cost of a project, thenthe project should be:a. accepted because the internal rate of return is positive.b. accepted because the profitability index is greater than 1.c. accepted because the profitability index is negative.d. rejected because the internal rate of return is negative.e. rejected because the net present value is negative.MUTUALLY EXCLUSIVE PROJECTSc 48. Which one of the following is the best example of two mutually exclusive projects?a. planning to build a warehouse and a retail outlet side by sideb. buying sufficient equipment to manufacture both desks and chairs simultaneouslyc. using an empty warehouse for storage or renting it entirely out to another firmd. using the company sales force to promote sales of both shoes and sockse. buying both inventory and fixed assets using funds from the same bond issue MUTUALLY EXCLUSIVE PROJECTSd 49. The Liberty Co. is considering two projects. Project A consists of building a wholesalebook outlet on lot #169 of the Englewood Retail Center. Project B consists of buildinga sit-down restaurant on lot #169 of the Englewood Retail Center. When trying todecide whether or build the book outlet or the restaurant, management should relymost heavily on the analysis results from the _____ method of analysis.a. profitability indexb. internal rate of returnc. paybackd. net present valuee. accounting rate of returnMUTUALLY EXCLUSIVE PROJECTSc 50. When two projects both require the total use of the same limited economic resource,the projects are generally considered to be:a. independent.b. marginally profitable.c. mutually exclusive.d. acceptable.e. internally profitable.MUTUALLY EXCLUSIVE PROJECTSb 51. The final decision on which one of two mutually exclusive projects to acceptultimately depends upon the:a. initial cost of each project.b. required discount rate.c. total cash inflows of each project.d. assigned payback period of each project.e. length of each project’s life.MUTUALLY EXCLUSIVE PROJECTSc 52. Matt is analyzing two mutually exclusive projects of similar size and has prepared thefollowing data. Both projects have 5 year lives.Project A Project B Net present value $15,090 $14,693Payback period 2.76 years 2.51 yearsAverage accounting return 9.3 percent 9.6 percentRequired return 8.3 percent 8.0 percentRequired AAR 9.0 percent 9.0 percentMatt has been asked for his best recommendation given this information. Hisrecommendation should be to accept:a. project B because it has the shortest payback period.b. both projects as they both have positive net present values.c. project A and reject project B based on their net present values.d. project B and reject project A based on their average accounting returns.e. project B and reject project A based on both the payback period and the averageaccounting return.INVESTMENT ANALYSISa 53. Given that the net present value (NPV) is generally considered to be the best methodof analysis, why should you still use the other methods?a. The other methods help validate whether or not the results from the net present valueanalysis are reliable.b. You need to use the other methods since conventional practice dictates that you onlyaccept projects after you have generated three accept indicators.c. You need to use other methods because the net present value method is unreliablewhen a project has unconventional cash flows.d. The average accounting return must always indicate acceptance since this is the bestmethod from a financial perspective.e. The discounted payback method must always be computed to determine if a projectreturns a positive cash flow since NPV does not measure this aspect of a project. INVESTMENT ANALYSISe 54. In actual practice, managers frequently use the:I. AAR because the information is so readily available.II. IRR because the results are easy to communicate and understand.III. payback because of its simplicity.IV. net present value because it is considered by many to be the best method of analysis.a. I and III onlyb. II and III onlyc. I, III, and IV onlyd. II, III, and IV onlye. I, II, III, and IVINVESTMENT ANALYSISa 55. No matter how many forms of investment analysis you do:a. the actual results from a project may vary significantly from the expected results.b. the internal rate of return will always produce the most reliable results.c. a project will never be accepted unless the payback period is met.d. the initial costs will generally vary considerably from the estimated costs.e. only the first three years of a project ever affect its final outcome.INVESTMENT ANALYSISb 56. Which of the following may have contributed to the change in the primary methodsused by chief financial officers to evaluate projects over the past forty years?I. an increased emphasis on ease of use and simplicity of methodII. an increased availability of computers and financial calculators to handle the more complex computationsIII. an increased level of financial knowledge by increasing sophisticated business executivesIV. an increasing emphasis by financial executives on accounting values rather than financial valuesa. I and II onlyb. II and III onlyc. III and IV onlyd. I, II, and IV onlye. II, III, and IV onlyINVESTMENT ANALYSISb 57. Which of the following methods of project analysis are biased towards short-termprojects?I. internal rate of returnII. accounting rate of returnIII. paybackIV. discounted paybacka. I and II onlyb. III and IV onlyc. II and III onlyd. I and IV onlye. II and IV onlyINVESTMENT ANALYSISa 58. If a project is assigned a required rate of return equal to zero, then:a. the timing of the project’s cash flows ha s no bearing on the value of the project.b. the project will always be accepted.c. the project will always be rejected.d. whether the project is accepted or rejected will depend on the timing of the cash flows.e. the project can never add value for the shareholders.DECISION RULESe 59. You are considering a project with the following data:Internal rate of return 8.7 percentProfitability ratio .98Net present value -$393Payback period 2.44 yearsRequired return 9.5 percentWhich one of the following is correct given this information?a. The discount rate used in computing the net present value must have been less than 8.7percent.b. The discounted payback period will have to be less than 2.44 years.c. The discount rate used to compute the profitability ratio was equal to the internal rateof return.d. This project should be accepted based on the profitability ratio.e. This project should be rejected based on the internal rate of return.DECISION RULESc 60. Which of the following statements are correct?I. A positive net present value signals an accept decision.II. Projects should be accepted when the profitability index is less than 1.III. A payback period that is less than the required period signals an accept decision.IV. When the internal rate of return exceeds the required return, a project should be accepted.a. I and III onlyb. II, III, and IV onlyc. I, III, and IV onlyd. I, II, and III onlye. I, II, III, and IVIII. PROBLEMSNET PRESENT VALUEb 61. What is the net present value of a project with the following cash flows and a requiredreturn of 12 percent?Year Cash Flow0 -$28,9001 $12,4502 $19,6303 $ 2,750a. -$287.22b. -$177.62c. $177.62d. $204.36e. $287.22。
公司理财Corporate_Finance_第九版_CASE答案(完整资料).doc
【最新整理,下载后即可编辑】Case SolutionsFundamentals of Corporate FinanceRoss, Westerfield, and Jordan9th editionCHAPTER 1THE McGEE CAKE COMPANY1.The advantages to a LLC are: 1) Reduction of personal liability. A soleproprietor has unlimited liability, which can include the potential loss of all personal assets. 2) Taxes. Forming an LLC may mean that more expenses can be considered business expenses and be deducted from the company’s income. 3) Improved credibility. The business may have increased credibility in the business world compared to a sole proprietorship. 4) Ability to attract investment. Corporations, even LLCs, can raise capital through the sale of equity. 5) Continuous life. Sole proprietorships have a limited life, while corporations have a potentially perpetual life. 6) Transfer of ownership. It is easier to transfer ownership in a corporation through the sale of stock.The biggest disadvantage is the potential cost, although the cost of forminga LLC can be relatively small. There are also other potential costs, includingmore expansive record-keeping.2.Forming a corporation has the same advantages as forming a LLC, but thecosts are likely to be higher.3.As a small company, changing to a LLC is probably the most advantageousdecision at the current time. If the company grows, and Doc and Lyn are willing to sell more equity ownership, the company can reorganize as a corporation at a later date. Additionally, forming a LLC is likely to be less expensive than forming a corporation.CHAPTER 2CASH FLOWS AND FINANCIAL STATEMENTS AT SUNSET BOARDS Below are the financial statements that you are asked to prepare.1.The income statement for each year will look like this:Income statement2008 2009Sales $247,259 $301,392Cost of goods sold 126,038 159,143Selling & administrative 24,787 32,352Depreciation 35,581 40,217EBIT $60,853 $69,680Interest 7,735 8,866EBT $53,118 $60,814Taxes 10,624 12,163Net income $42,494 $48,651Dividends $21,247 $24,326Addition to retainedearnings 21,247 24,3262.The balance sheet for each year will be:Balance sheet as of Dec. 31, 2008C-26 CASE SOLUTIONSCash $18,187 Accounts payable $32,143 Accountsreceivable 12,887 Notes payable 14,651 Inventory 27,119 Current liabilities $46,794 Current assets $58,193Long-term debt $79,235 Net fixed assets $156,975 Owners' equity 89,139Total assets $215,168 Total liab. &equity $215,168In the first year, equity is not given. Therefore, we must calculate equity as a plug variable. Since total liabilities & equity is equal to total assets, equity can be calculated as:Equity = $215,168 – 46,794 – 79,235Equity = $89,139CHAPTER 2 C-5Balance sheet as of Dec. 31, 2009Cash $27,478 Accounts payable $36,404 Accountsreceivable 16,717 Notes payable 15,997 Inventory 37,216 Current liabilities $52,401 Current assets $81,411Long-term debt $91,195 Net fixed assets $191,250 Owners' equity 129,065Total assets $272,661 Total liab. &equity $272,661The owner’s equity for 2009 is the beginning of year owner’s equity, plus the addition to retained earnings, plus the new equity, so:Equity = $89,139 + 24,326 + 15,600Equity = $129,065ing the OCF equation:OCF = EBIT + Depreciation – TaxesThe OCF for each year is:OCF2008 = $60,853 + 35,581 – 10,624OCF2008 = $85,180OCF2009 = $69,680 + 40,217 – 12,163OCF2009 = $97,734C-26 CASE SOLUTIONS4.To calculate the cash flow from assets, we need to find the capital spendingand change in net working capital. The capital spending for the year was: Capital spendingEnding net fixed assets $191,250– Beginning net fixedassets 156,975+ Depreciation 40,217Net capital spending $74,492And the change in net working capital was:Change in net working capitalEnding NWC $29,010– Beginning NWC 11,399Change in NWC $17,611CHAPTER 2 C-5 So, the cash flow from assets was:Cash flow from assetsOperating cash flow $97,734– Net capital spending 74,492– Change in NWC 17,611Cash flow from assets $ 5,6315.The cash flow to creditors was:Cash flow to creditorsInterest paid $8,866– Net new borrowing 11,960Cash flow to creditors –$3,0946.The cash flow to stockholders was:Cash flow tostockholdersDividends paid $24,326– Net new equityraised 15,600Cash flow tostockholders $8,726Answers to questions1.The firm had positive earnings in an accounting sense (NI > 0) and hadpositive cash flow from operations. The firm invested $17,611 in new netC-26 CASE SOLUTIONSworking capital and $74,492 in new fixed assets. The firm gave $5,631 to its stakeholders. It raised $3,094 from bondholders, and paid $8,726 to stockholders.2.The expansion plans may be a little risky. The company does have a positivecash flow, but a large portion of the operating cash flow is already going to capital spending. The company has had to raise capital from creditors and stockholders for its current operations. So, the expansion plans may be too aggressive at this time. On the other hand, companies do need capital to grow. Before investing or loaning the company money, you would want to know where the current capital spending is going, and why the company is spending so much in this area already.CHAPTER 3RATIOS ANALYSIS AT S&S AIR1.The calculations for the ratios listed are:Current ratio = $2,186,520 / $2,919,000Current ratio = 0.75 timesQuick ratio = ($2,186,250 – 1,037,120) / $2,919,000Quick ratio = 0.39 timesCash ratio = $441,000 / $2,919,000Cash ratio = 0.15 timesTotal asset turnover = $30,499,420 / $18,308,920Total asset turnover = 1.67 timesInventory turnover = $22,224,580 / $1,037,120Inventory turnover = 21.43 timesReceivables turnover = $30,499,420 / $708,400Receivables turnover = 43.05 timesTotal debt ratio = ($18,308,920 – 10,069,920) / $18,308,920 Total debt ratio = 0.45 timesDebt-equity ratio = ($2,919,000 + 5,320,000) / $10,069,920C-26 CASE SOLUTIONSDebt-equity ratio = 0.82 timesEquity multiplier = $18,308,920 / $10,069,920Equity multiplier = 1.82 timesTimes interest earned = $3,040,660 / $478,240Times interest earned = 6.36 timesCash coverage = ($3,040,660 + 1,366,680) / $478,420 Cash coverage = 9.22 timesProfit margin = $1,537,452 / $30,499,420Profit margin = 5.04%Return on assets = $1,537,452 / $18,308,920Return on assets = 8.40%Return on equity = $1,537,452 / $10,069,920Return on equity = 15.27%CHAPTER 3 C-11 2. Boeing is probably not a good aspirant company. Even though bothcompanies manufacture airplanes, S&S Air manufactures small airplanes, while Boeing manufactures large, commercial aircraft. These are two different markets. Additionally, Boeing is heavily involved in the defense industry, as well as Boeing Capital, which finances airplanes.Bombardier is a Canadian company that builds business jets, short-range airliners and fire-fighting amphibious aircraft and also provides defense-related services. It is the third largest commercial aircraft manufacturer in the world. Embraer is a Brazilian manufacturer than manufactures commercial, military, and corporate airplanes. Additionally, the Brazilian government is a part owner of the company. Bombardier and Embraer are probably not good aspirant companies because of the diverse range of products and manufacture of larger aircraft.Cirrus is the world's second largest manufacturer of single-engine, piston-powered aircraft. Its SR22 is the world's best selling plane in its class. The company is noted for its innovative small aircraft and is a good aspirant company.Cessna is a well known manufacturer of small airplanes. The company produces business jets, freight- and passenger-hauling utility Caravans, personal and small-business single engine pistons. It may be a good aspirant company, however, its products could be considered too broad and diversified since S&S Air produces only small personal airplanes.3. S&S is below the median industry ratios for the current and cash ratios.This implies the company has less liquidity than the industry in general.However, both ratios are above the lower quartile, so there are companiesC-26 CASE SOLUTIONSin the industry with lower liquidity ratios than S&S Air. The company may have more predictable cash flows, or more access to short-term borrowing.If you created an Inventory to Current liabilities ratio, S&S Air would havea ratio that is lower than the industry median. The current ratio is below theindustry median, while the quick ratio is above the industry median. This implies that S&S Air has less inventory to current liabilities than the industry median. S&S Air has less inventory than the industry median, but more accounts receivable than the industry since the cash ratio is lower than the industry median.The turnover ratios are all higher than the industry median; in fact, all three turnover ratios are above the upper quartile. This may mean that S&S Air is more efficient than the industry.The financial leverage ratios are all below the industry median, but above the lower quartile. S&S Air generally has less debt than comparable companies, but still within the normal range.The profit margin, ROA, and ROE are all slightly below the industry median, however, not dramatically lower. The company may want to examine its costs structure to determine if costs can be reduced, or price can be increased.Overall, S&S Air’s performance seems good, although the liquidity ratios indicate that a closer look may be needed in this area.CHAPTER 3 C-11 Below is a list of possible reasons it may be good or bad that each ratio is higher or lower than the industry. Note that the list is not exhaustive, but merely one possible explanation for each ratio.Ratio Good BadCurrent ratio Better at managingcurrent accounts. May be having liquidity problems.Quick ratio Better at managingcurrent accounts. May be having liquidity problems.Cash ratio Better at managingcurrent accounts. May be having liquidity problems.Total asset turnover Better at utilizing assets. Assets may be older anddepreciated, requiringextensive investmentsoon.Inventory turnover Better at inventorymanagement, possibly dueto better procedures.Could be experiencinginventory shortages.Receivables turnover Better at collectingreceivables.May have credit termsthat are too strict.Decreasing receivablesturnover may increasesales.Total debt ratio Less debt than industrymedian means thecompany is less likely toexperience creditproblems. Increasing the amount of debt can increase shareholder returns. Especially notice that it will increase ROE.Debt-equity Less debt than industry Increasing the amount ofC-26 CASE SOLUTIONSratio median means thecompany is less likely toexperience creditproblems. debt can increase shareholder returns. Especially notice that it will increase ROE.Equity multiplier Less debt than industrymedian means thecompany is less likely toexperience creditproblems.Increasing the amount ofdebt can increaseshareholder returns.Especially notice that itwill increase ROE.TIE Higher quality materialscould be increasing costs. The company may have more difficulty meeting interest payments in a downturn.Cash coverage Less debt than industrymedian means thecompany is less likely toexperience creditproblems. Increasing the amount of debt can increase shareholder returns. Especially notice that it will increase ROE.Profit margin The PM is slightly belowthe industry median. Itcould be a result of higherquality materials or bettermanufacturing. Company may be having trouble controlling costs.ROA Company may have newerassets than the industry. Company may have newer assets than the industry.ROE Lower profit margin maybe a result of higherquality. Profit margin and EM are lower than industry, which results in the lower ROE.CHAPTER 4PLANNING FOR GROWTH AT S&S AIR1.To calculate the internal growth rate, we first need to find the ROA and theretention ratio, so:ROA = NI / TAROA = $1,537,452 / $18,309,920ROA = .0840 or 8.40%b = Addition to RE / NIb = $977,452 / $1,537,452b = 0.64Now we can use the internal growth rate equation to get:Internal growth rate = (ROA × b) / [1 – (ROA × b)]Internal growth rate = [0.0840(.64)] / [1 – 0.0840(.64)]Internal growth rate = .0564 or 5.64%To find the sustainable growth rate, we need the ROE, which is:ROE = NI / TEROE = $1,537,452 / $10,069,920ROE = .1527 or 15.27%C-26 CASE SOLUTIONSUsing the retention ratio we previously calculated, the sustainable growth rate is:Sustainable growth rate = (ROE × b) / [1 – (ROE × b)]Sustainable growth rate = [0.1527(.64)] / [1 – 0.1527(.64)]Sustainable growth rate = .1075 or 10.75%The internal growth rate is the growth rate the company can achieve with no outside financing of any sort. The sustainable growth rate is the growth rate the company can achieve by raising outside debt based on its retained earnings and current capital structure.CHAPTER 4 C-21 2.Pro forma financial statements for next year at a 12 percent growth rate are:Income statementSales $ 34,159,35COGS 24,891,530 Other expenses 4,331,600 Depreciation 1,366,680EBIT $ 3,569,541Interest 478,240Taxable income $ 3,091,301Taxes (40%) 1,236,520Net income $ 1,854,78Dividends $ 675,583C-26 CASE SOLUTIONSAdd to RE 1,179,197Balance sheetAssets Liabilities & EquityCurrent Assets Current LiabilitiesCash $ 493,92AccountsPayable $ 995,680Accounts rec. 793,408 Notes Payable 2,030,000 Inventory 1,161,574 Total CL $ 3,025,680 Total CA $ 2,448,902Long-term debt $ 5,320,000ShareholderEquityCommon stock $ 350,000Fixed assets Retainedearnings 10,899,117Net PP&E $ 18,057,088 Total Equity $ 11,249,117Total Assets $ 20,505,990 Total L&E $ 19,594,787CHAPTER 4 C-21 So, the EFN is:EFN = Total assets – Total liabilities and equityEFN = $20,505,990 – 19,594,797EFN = $911,193The company can grow at this rate by changing the way it operates. For example, if profit margin increases, say by reducing costs, the ROE increases, it will increase the sustainable growth rate. In general, as long as the company increases the profit margin, total asset turnover, or equity multiplier, the higher growth rate is possible. Note however, that changing any one of these will have the effect of changing the pro forma financial statements.C-26 CASE SOLUTIONS3.Now we are assuming the company can only build in amounts of $5 million.We will assume that the company will go ahead with the fixed asset acquisition. To estimate the new depreciation charge, we will find the current depreciation as a percentage of fixed assets, then, apply this percentage to the new fixed assets. The depreciation as a percentage of assets this year was:Depreciation percentage = $1,366,680 / $16,122,400Depreciation percentage = .0848 or 8.48%The new level of fixed assets with the $5 million purchase will be:New fixed assets = $16,122,400 + 5,000,000 = $21,122,400So, the pro forma depreciation will be:Pro forma depreciation = .0848($21,122,400)Pro forma depreciation = $1,790,525We will use this amount in the pro forma income statement. So, the pro forma income statement will be:Income statementSales $ 34,159,35COGS 24,891,530 Other expensesCHAPTER 4 C-214,331,600Depreciation 1,790,525EBIT $ 3,145,696Interest 478,240Taxable income $ 2,667,456Taxes (40%) 1,066,982Net income $ 1,600,473Dividends $ 582,955Add to RE 1,017,519C-26 CASE SOLUTIONSThe pro forma balance sheet will remain the same except for the fixed asset and equity accounts. The fixed asset account will increase by $5 million, rather than the growth rate of sales.Balance sheetAssets Liabilities & EquityCurrent Assets Current LiabilitiesCash $ 493,92AccountsPayable $ 995,680Accounts rec. 793,408 Notes Payable 2,030,000 Inventory 1,161,574 Total CL $ 3,025,680 Total CA $ 2,448,902Long-term debt $ 5,320,000ShareholderEquityCommon stock $ 350,000Fixed assets Retainedearnings 10,737,439Net PP&E $ 21,122,400 Total Equity $ 11,087,439Total Assets $ 23,571,302 Total L&E $ 19,433,119CHAPTER 4 C-21 So, the EFN is:EFN = Total assets – Total liabilities and equityEFN = $23,581,302 – 19,433,119EFN = $4,138,184Since the fixed assets have increased at a faster percentage than sales, the capacity utilization for next year will decrease.CHAPTER 6THE MBA DECISION1. Age is obviously an important factor. The younger an individual is, the moretime there is for the (hopefully) increased salary to offset the cost of the decision to return to school for an MBA. The cost includes both the explicit costs such as tuition, as well as the opportunity cost of the lost salary.2. Perhaps the most important nonquantifiable factors would be whether ornot he is married and if he has any children. With a spouse and/or children, he may be less inclined to return for an MBA since his family may be less amenable to the time and money constraints imposed by classes. Other factors would include his willingness and desire to pursue an MBA, job satisfaction, and how important the prestige of a job is to him, regardless of the salary.3.He has three choices: remain at his current job, pursue a Wilton MBA, orpursue a Mt. Perry MBA. In this analysis, room and board costs are irrelevant since presumably they will be the same whether he attends college or keeps his current job. We need to find the aftertax value of each, so:Remain at current job:Aftertax salary = $55,000(1 – .26) = $40,700CHAPTER 6 C-27 His salary will grow at 3 percent per year, so the present value of his aftertax salary is:PV = C {1 – [(1 + g)/(1 + r)]t} / (r–g)]PV = $40,700{[1 – [(1 +.065)/(1 + .03)]38} / (.065 – .03)PV = $836,227.34Wilton MBA:Costs:Total direct costs = $63,000 + 2,500 + 3,000 = $68,500PV of direct costs = $68,500 + 68,500 / (1.065) = $132,819.25PV of indirect costs (lost salary) = $40,700 / (1.065) + $40,700(1 + .03) / (1 + .065)2 = $75,176.00Salary:PV of aftertax bonus paid in 2 years = $15,000(1 –.31) / 1.0652= $9,125.17Aftertax salary = $98,000(1 – .31) = $67,620C-26 CASE SOLUTIONSHis salary will grow at 4 percent per year. We must also remember that he will now only work for 36 years, so the present value of his aftertax salary is: PV = C {1 – [(1 + g)/(1 + r)]t} / (r–g)]PV = $67,620{[1 – [(1 +.065)/(1 + .04)]36} / (.065 – .04)PV = $1,554,663.22Since the first salary payment will be received three years from today, so we need to discount this for two years to find the value today, which will be: PV = $1,544,663.22 / 1.0652PV = $1,370,683.26So, the total value of a Wilton MBA is:Value = –$75,160 – 132,819.25 + 9,125.17 + 1,370,683.26 =$1,171,813.18Mount Perry MBA:Costs:Total direct costs = $78,000 + 3,500 + 3,000 = $86,500. Note, this is also the PV of the direct costs since they are all paid today.PV of indirect costs (lost salary) = $40,700 / (1.065) = $38,215.96Salary:CHAPTER 6 C-27 PV of aftertax bonus paid in 1 year = $10,000(1 – .29) / 1.065 = $6,666.67 Aftertax salary = $81,000(1 – .29) = $57,510His salary will grow at 3.5 percent per year. We must also remember that he will now only work for 37 years, so the present value of his aftertax salary is: PV = C {1 – [(1 + g)/(1 + r)]t} / (r–g)]PV = $57,510{[1 – [(1 +.065)/(1 + .035)]37} / (.065 – .035)PV = $1,250,991.81Since the first salary payment will be received two years from today, so we need to discount this for one year to find the value today, which will be:PV = $1,250,991.81 / 1.065PV = $1,174,640.20So, the total value of a Mount Perry MBA is:Value = –$86,500 – 38,215.96 + 6,666.67 + 1,174,640.20 = $1,056,590.90C-26 CASE SOLUTIONS4.He is somewhat correct. Calculating the future value of each decision willresult in the option with the highest present value having the highest future value. Thus, a future value analysis will result in the same decision. However, his statement that a future value analysis is the correct method is wrong since a present value analysis will give the correct answer as well.5. To find the salary offer he would need to make the Wilton MBA asfinancially attractive as the as the current job, we need to take the PV of his current job, add the costs of attending Wilton, and the PV of the bonus on an aftertax basis. So, the necessary PV to make the Wilton MBA the same as his current job will be:PV = $836,227.34 + 132,819.25 + 75,176.00 – 9,125.17 = $1,035,097.42This PV will make his current job exactly equal to the Wilton MBA on a financial basis. Since his salary will still be a growing annuity, the aftertax salary needed is:PV = C {1 – [(1 + g)/(1 + r)]t} / (r–g)]$1,035,097.42 = C {[1 – [(1 +.065)/(1 + .04)]36} / (.065 – .04)C = $45,021.51This is the aftertax salary. So, the pretax salary must be:Pretax salary = $45,021.51 / (1 – .31) = $65,248.576.The cost (interest rate) of the decision depends on the riskiness of the use offunds, not the source of the funds. Therefore, whether he can pay cash orCHAPTER 6 C-27 must borrow is irrelevant. This is an important concept which will be discussed further in capital budgeting and the cost of capital in later chapters.CHAPTER 7FINANCING S&S AIR’S EXPANSION PLANS WITH A BOND ISSUEA rule of thumb with bond provisions is to determine who benefits by theprovision. If the company benefits, the bond will have a higher coupon rate.If the bondholders benefit, the bond will have a lower coupon rate.1. A bond with collateral will have a lower coupon rate. Bondholders have theclaim on the collateral, even in bankruptcy. Collateral provides an asset that bondholders can claim, which lowers their risk in default. The downside of collateral is that the company generally cannot sell the asset used as collateral, and they will generally have to keep the asset in good working order.2.The more senior the bond is, the lower the coupon rate. Senior bonds getfull payment in bankruptcy proceedings before subordinated bonds receive any payment. A potential problem may arise in that the bond covenant may restrict the company from issuing any future bonds senior to the current bonds.3. A sinking fund will reduce the coupon rate because it is a partial guaranteeto bondholders. The problem with a sinking fund is that the company must make the interim payments into a sinking fund or face default. This means the company must be able to generate these cash flows.4. A provision with a specific call date and prices would increase the couponrate. The call provision would only be used when it is to the company’s advantage, thus the bondholder’s disadvantage. The downside is theCHAPTER 7 C-29 higher coupon rate. The company benefits by being able to refinance at a lower rate if interest rates fall significantly, that is, enough to offset the call provision cost.5. A deferred call would reduce the coupon rate relative to a call provision witha deferred call. The bond will still have a higher rate relative to a plain vanillabond. The deferred call means that the company cannot call the bond for a specified period. This offers the bondholders protection for this period. The disadvantage of a deferred call is that the company cannot call the bond during the call protection period. Interest rates could potentially fall to the point where it would be beneficial for the company to call the bond, yet the company is unable to do so.6. A make-whole call provision should lower the coupon rate in comparison toa call provision with specific dates since the make-whole call repays thebondholder the present value of the future cash flows. However, a make-whole call provision should not affect the coupon rate in comparison to a plain vanilla bond. Since the bondholders are made whole, they should be indifferent between a plain vanilla bond and a make-whole bond. If a bond with a make-whole provision is called, bondholders receive the market value of the bond, which they can reinvest in another bond with similar characteristics. If we compare this to a bond with a specific call price, investors rarely receive the full market value of the future cash flows.CASE 3 C-30 7. A positive covenant would reduce the coupon rate. The presence of positivecovenants protects bondholders by forcing the company to undertake actions that benefit bondholders. Examples of positive covenants would be: the company must maintain audited financial statements; the company must maintain a minimum specified level of working capital or a minimum specified current ratio; the company must maintain any collateral in good working order. The negative side of positive covenants is that the company is restricted in its actions. The positive covenant may force the company into actions in the future that it would rather not undertake.8. A negative covenant would reduce the coupon rate. The presence ofnegative covenants protects bondholders from actions by the company that would harm the bondholders. Remember, the goal of a corporation is to maximize shareholder wealth. This says nothing about bondholders.Examples of negative covenants would be: the company cannot increase dividends, or at least increase beyond a specified level; the company cannot issue new bonds senior to the current bond issue; the company cannot sell any collateral. The downside of negative covenants is the restriction of the company’s actions.9.Even though the company is not public, a conversion feature would likelylower the coupon rate. The conversion feature would permit bondholders to benefit if the company does well and also goes public. The downside is that the company may be selling equity at a discounted price.10. The downside of a floating-rate coupon is that if interest rates rise, thecompany has to pay a higher interest rate. However, if interest rates fall, the company pays a lower interest rate.CHAPTER 8STOCK VALUATION AT RAGAN, INC.1.The total dividends paid by the company were $126,000. Since there are100,000 shares outstanding, the total earnings for the company were: Total earnings = 100,000($4.54) = $454,000This means the payout ratio was:Payout ratio = $126,000/$454,000 = 0.28So, the retention ratio was:Retention ratio = 1 – .28 = 0.72Using the retention ratio, the company’s growth rate is:g = ROE × b = 0.25*(.72) = .1806 or 18.06%The dividend per share paid this year was:= $63,000 / 50,000D= $1.26DNow we can find the stock price, which is:C-84 CASE SOLUTIONSP 0 = D 1 / (R – g )P 0 = $1.26(1.1806) / (.20 – .1806)P 0 = $76.752.Since Expert HVAC had a write off which affected its earnings per share, we need to recalculate the industry EPS. So, the industry EPS is:Industry EPS = ($0.79 + 1.38 + 1.06) / 3 = $1.08Using this industry EPS, the industry payout ratio is:Industry payout ratio = $0.40/$1.08 = .3715 or 37.15%So, the industry retention ratio isIndustry retention ratio = 1 – .3715 = .6285 or 62.85%。
罗斯公司理财课件Chpt009
1000
$40.22
$15.64
10
Common Stocks Long T-Bonds T-Bills
0.1 1930 1940 1950 1960 1970 1980 1990 2000
Source: © Stocks, Bonds, Bills, and Inflation 2000 Yearbook™, Ibbotson Associates, Inc., Chicago (annually updates work by Roger G. Ibbotson and Rex A. Sinquefield). All rights reserved.
9-9
Holding Period Returns
• A famous set of studies dealing with the rates of returns on common stocks, bonds, and Treasury bills was conducted by Roger Ibbotson and Rex Sinquefield.
- 1、下载文档前请自行甄别文档内容的完整性,平台不提供额外的编辑、内容补充、找答案等附加服务。
- 2、"仅部分预览"的文档,不可在线预览部分如存在完整性等问题,可反馈申请退款(可完整预览的文档不适用该条件!)。
- 3、如文档侵犯您的权益,请联系客服反馈,我们会尽快为您处理(人工客服工作时间:9:00-18:30)。
Solutions to Chapter 9Using Discounted Cash-Flow Analysis to Make Investment Decisions1. Net income = ($74 - $42 - $10) - [0.35 ⨯ ($74 - $42 - $10)] = $22 - $7.7 = $14.3 million∙Revenues - cash expenses - taxes paid = $74 - $42 - $7.7 = $24.3 million∙After-tax profit + depreciation = $14.3 + $10 = $24.3 million∙(Revenues - cash expenses) ⨯ (1 - tax rate) + (depreciation ⨯ tax rate)= ($32 ⨯ 0.65) + ($10 ⨯ 0.35) = $24.3 millionEst time: 01–052. a. ∆NWC = ∆accounts receivable + ∆inventory -∆accounts payable= -$1,000 + $500 - $2,000 = -$2,500b. Cash flow = $36,000 - $24,000 + $2,500 = $14,500Est time: 01–053. Net income = ($7 - $4 - $1) - [0.35 ⨯ ($7 - $4 - $1)] = $2 - $0.7 = $1.3 million∙Revenues - cash expenses - taxes paid = $3 - $0.7 = $2.3 million∙After-tax profit + depreciation = $1.3 + $1.0 = $2.3 million∙(Revenues - cash expenses) ⨯ (1 - tax rate) + (depreciation ⨯ tax rate)= ($3 ⨯ 0.65) + ($1 ⨯ 0.35) = $2.3 millionEst time: 01–054. While depreciation is a noncash expense, it has an impact on net cash flow because of itsimpact on taxes. Every dollar of depreciation expense reduces taxable income by one dollar, and thus reduces taxes owed by $1 times the firm's marginal tax rate. Accelerateddepreciation moves the tax benefits forward in time and thus increases the present value of the tax shield, thereby increasing the value of the project.Est time: 01–055. Gross revenues from new chip = 12 million ⨯ $25 = $300 millionCost of new chip = 12 million ⨯ $8 = $96 millionLost sales of old chip = 7 million ⨯ $20 = $140 millionSaved costs of old chip = 7 million ⨯ $6 = $42 millionIncrease in cash flow = ($300 – $96) – ($140 – $42) = $106 millionEst time: 01–056. Revenue $160,000Rental costs 30,000Variable costs 50,000Depreciation 10,000Pretax profit 70,000Taxes (35%) 24,500Net income $ 45,500Est time: 01–057. a. Net income + depreciation = $45,500 + $10,000 = $55,500b. Revenue – rental costs – variable costs – taxes= $160,000 – $30,000 – $50,000 – $24,500 = $55,500c. [(Revenue – rental costs – variable costs) ⨯ (1 – 0.35)] + (depreciation ⨯ 0.35)= [($160,000 – $30,000 – $50,000) ⨯ 0.65] + ($10,000 ⨯ 0.35)= $52,000 + $3,500 = $55,500Est time: 01–058. Change in working capital = ∆accounts receivable –∆accounts payable= ($4,500 – $1,200) – ($300 – $700) = $3,700 Cash flow = $16,000 – $9,000 – $3,700 = $3,300Est time: 01–059. Incremental cash flows are:a. The current market value of the painting (i.e., the cash that could have been realizedby selling the art).b. The reduction in taxes due to its declared tax deduction.Est time: 01–0510. Revenue $120,000Variable costs 40,000Fixed costs 15,000Depreciation 40,000Pretax profit 25,000Taxes (35%) 8,750Net income 16,250Depreciation 40,000Operating cash flow $ 56,250Est time: 01–0511. a.Year MACRS (%) Depreciation Book Value (end of year)1 20.00 $ 8,000 $32,0002 32.00 12,800 19,2003 19.20 7,680 11,5204 11.52 4,608 6,9125 11.52 4,608 2,3046 5.76 2,304 0b.If the machine is sold for $22,000 after 3 years, sales price exceeds book value by:$22,000 – $11,520 = $10,480After-tax proceeds are $22,000 – (0.35 $10,480) = $18,332.Est time: 06–1012. a. If the office space would have remained unused in the absence of the proposed project,then the incremental cash outflow from allocating the space to the project is effectivelyzero. The incremental cost of the space used should be based on the cash flow given upby allocating the space to this project rather than some other use.b. One reasonable approach would be to assess a cost to the space equal to the rentalincome that the firm could earn if it allowed another firm to use the space. This is theopportunity cost of the space.Est time: 01–0513. Cash flow = net income + depreciation – increase in NWC1.2 = 1.2 + 0.4 –∆NWC ⇒∆NWC = $0.4 millionEst time: 01–0514.Cash flow = profit – increase in inventory = $10,000 – $1,000 = $9,000Est time: 01–0515. NWC2011 = $32 + $25 – $12 = $45 millionNWC2012 = $36 + $30 – $26 = $40 millionNet working capital has decreased by $5 million.Est time: 01–0516. Depreciation expense per year = $40/5 = $8 millionBook value of old equipment = $40 – (3 ⨯ $8) = $16 millionAfter-tax cash flow = $18 – [0.35 ⨯ ($18 – $16)] = $17.3 millionEst time: 01–05ing the 7-year MACRS depreciation schedule, after 5 years the machinery will be writtendown to 22.30% of its original value: 0.2230 ⨯ $10 million = $2.230 millionIf the machinery is sold for $4.5 million, the sale generates a taxable gain of $2.270 million.This increases the firm’s tax bill by 0.35 ⨯ $2.270 = $0.7945 million.Thus: cash flow from sales of the machinery= $4.5 – $0.7945 = $3.7055 millionEst time: 01–0518. a.All values should be interpreted as incremental results from making the purchase.Earnings before depreciation $1,500 Depreciation 1,000 Taxable income 500 Taxes 200 Net income 300+ Depreciation 1,000 Operating CF $1,300 in years 1–6Net cash flow at time 0 is –$6,000 + [$2,000 ⨯ (1 – 0.40)] = –$4,800.b.NPV = –$4,800 + [$1,300 ⨯ annuity factor (16%, 6 years)]c. Incremental CF in each year (using the depreciation tax shield approach) is:[$1,500 ⨯ (1 – 0.40)] + (depreciation ⨯ 0.40) Year DepreciationCF 0 n/a–$4,800.00 1 $1,200.00 1,380.00 2 1,920.00 1,668.00 3 1,152.00 1,360.80 4 691.20 1,176.48 5 691.20 1,176.48 6345.601,038.24Est time: 11–1519. If the firm uses straight-line depreciation, the present value of the cost of buying, net ofthe annual depreciation tax shield (which equals $1,000 ⨯ 0.40 = $400), is:$6,000 – [$400 ⨯ annuity factor (16%, 6 years)] =11.526,4$(1.16)0.1610.161$400$6,0006=⎥⎦⎤⎢⎣⎡⨯-⨯- The equivalent annual cost (EAC) is therefore determined by:C ⨯ annuity factor (16%, 6 years) = $4,526.1111.526,4$)16.1(16.0116.016=⎥⎦⎤⎢⎣⎡⨯-⨯CC⨯ 3.68474 = $4,526.11 ⇒C = EAC = $1,228.34Note: This is the equivalent annual cost of the new washer and does not include any of the washer's benefits.Est time: 06–1020. a. In the following table, we compute the impact on operating cash flows bysumming the value of the depreciation tax shield (depreciation ⨯ tax rate) plus thenet-of-tax improvement in operating income [$20,000 ⨯ (1 – tax rate)]. Althoughthe MACRS depreciation schedule extends out to 4 years, the project will beterminated when the machine is sold after 3 years, so we need to examine cashflows for only 3 years.MACRS Depreciation Depreciation ⨯0.035 ∆OperatingIncome⨯ (1 – 0.35)Contribution toOperating Cashlow0.3333 $13,332 $4,666.20 $13,000 $17,666.200.4445 17,780 6,223.00 13,000 19,223.000.1481 5,942 2,073.40 13,000 15,073.400.0741b. Total cash flow = operating cash flow + cash flow associated with investmentsAt time 0, the cash flow from the investment is -$40,000.When the grill is sold at the end of year 3, its book value will be $2,964, so thesales price, net of tax, will be $10,000 - [0.35 ⨯ ($10,000 - $2,964)] = $7,537.40.Therefore, total cash flows are:Time Cash Flow0 -$40,000.001 17,666.202 19,223.003 22,610.80 [= 15,073.40 + 7,537.40]c. The net present value of this cash-flow stream, at a discount rate of 12%, is$7,191.77, which is positive. So the grill should be purchased.Est time: 11–1521. a. Working capital = 20% ⨯ $40,000 = $8,000Initial investment = $45,000 + $8,000 = $53,000b.All figures in thousands of dollarsYear Revenues Expenses WorkingCapitalDepreciation Cash Flow*1 40 16 6 11.25 20.92 30 12 4 11.25 17.33 20 8 2 11.25 13.74 10 4 0 11.25 10.1*Cash flow = [(revenues – expenses) ⨯ (1 – 0.40)] + (depreciation ⨯ 0.40)+ $2,000 (decrease in working capital from previous year)d.To compute IRR, use trial and error or a financial calculator to solve for r in thefollowing equation:Est time: 11–1522. a. The present value of the cost of buying is:$25,000 – [$5,000/(1.12)5 ] = $22,162.87The cost of leasing (assuming that lease payments are made at the end of each year) is:$5,000 ⨯ annuity factor (12%, 5 years) =88.023,18$)12.1(12.0112.01000,5$5=⎥⎦⎤⎢⎣⎡⨯-⨯Leasing is less expensive. b.The maximum lease payment (L ) would be chosen so that:L ⨯ annuity factor (12%, 5 years) = $22,162.87$6,148.2087.162,22$)12.1(12.0112.015=⇒=⎥⎦⎤⎢⎣⎡⨯-⨯L LEst time: 06–1023. The initial investment is $100,000 for the copier plus $10,000 in working capital, for atotal outlay of $110,000.Depreciation expense = ($100,000 - $20,000)/5 = $16,000 per year The project saves $20,000 in annual labor costs, so the net operating cash flow (including the depreciation tax shield) is:$20,000 ⨯ (1 - 0.35) + ($16,000 ⨯ 0.35) = $18,600In year 5, the copier is sold for $30,000, which generates net-of-tax proceeds of:$30,000 - (0.35 ⨯ $10,000) = $26,500In addition, the working capital associated with the project is freed up, which releases another $10,000 in cash. So, nonoperating cash flow in year 5 totals $36,500. The NPV is thus:NPV = -$110,000 + [$18,600 ⨯ annuity factor (8%, 5 years)] + [$36,500/(1.08)5]= -$110,000 + $99,105.69 = -$10,894.31Because NPV is negative, Kinky’s should not buy the new copier.Est time: 06–1024. Find the equivalent annual cost of each alternative: Quick and Dirty Do-It-Right Operating costs $1 million $1 million Investment $10 million $12 millionProject life 5 years 8 years Annual depreciation $2 million $1.5 million Depreciation tax shield $0.700 million $0.525 million PV(depreciation tax shield)* $2.523 million $2.608 millionNet capital cost †$7.477 million $9.392 million EAC of net capital cost* $2.074 million $1.891 million*Annuity discounted at 12%; number of years = project life. †Investment – PV(depreciation tax shield).The present value of the depreciation tax shield for each alternative is computed as follows:The equivalent annual cost (EAC) for each alternative is computed as follows:Since the operating costs are the same, then Do-It-Right is preferred because it has the lower EAC.Est time: 11–1525.All figures in thousands0 1 234Net working capital $176 $240 $112 $40 $ 0 Investment in NWC 176 64 -128 -72 -40 Investment in plant & equipment200 0 0 00 Cash flow frominvestment activity -$376-$ 64 +$128 +$72 +$40All figures in thousands12 3 4 Revenue $880.00 $1,200.00 $560.00 $200.00 Cost550.00 750.00 350.00 125.00 Depreciation 66.66 88.90 29.62 14.82 Pretax profit 263.34 361.10 180.38 60.18 Taxes92.17 126.39 63.13 21.06 Net income 171.17 234.71 117.25 39.12 Depreciation66.66 88.90 29.62 14.82 Operating cash flow $237.83 $ 323.61 $146.87 $ 53.94 Total cash flow-$376.00 $173.83$ 451.61 $218.87$ 93.94,440.254$20.194.93$20.187.218$20.161.451$20.183.173$376$NPV 432=++++-= or $254,440Est time: 11–1526. All figures are on an incremental basis:NPV = – $1,000,000 + [$90,000 ⨯ annuity factor (8%, 10 years)] + [$100,000/(1.08)10]Est time: 06–1027. If the savings are permanent, then the inventory systemis worth $250,000 to the firm. The firm can take $250,000 out of the project now without ever having to replace it. So the most the firm should be willing to pay is $250,000.Est time: 06–1028. All cash flows are in millions of dollars. Sales price of machinery in year 6 is shown onan after-tax basis as a positive cash flow on the capital investment line.a.Year0123456 Sales (traps)0.50.6110.60.2 Revenue02 2.444 2.40.8 Working capital0.20.240.40.40.240.080 Change in working capital–0.20.040.160–0.16–0.16–0.08 Revenues2 2.444 2.40.8 Expense0.750.9 1.5 1.50.90.3 Depreciation111111 Pretax 0.250.5 1.5 1.50.5–0.5Tax0.087550.1750.5250.5250.175–0.175After-tax profit0.162550.3250.9750.9750.325–0.325Cash flow from operations 1.162551.325 1.975 1.975 1.3250.675Cash flow: capital invest.–60.325 Cash flow from WC–0.2–0.04–0.1600.160.160.08Cash flow from operations0 1.162551.325 1.975 1.975 1.3250.675Total cash flow–6.2 1.122551.165 1.975 2.135 1.485 1.08PV of cash flow at 12%–6.2 1.0020.929 1.406 1.3570.8430.547 Net present –0.11665b.Using the 5-year MACRS schedule, the net present value increases by $111,010 (= 116,650 – 5,640).Est time: 11–1529. If working capital requirements were only one-half of those in the previous problem, then theworking capital cash-flow forecasts would change as follows:Year:123 45Original forecast –0.20 –0.04 –0.16 0.0 +0.16 +0.24 Revised forecast –0.10 –0.02 –0.08 0.0 +0.08 +0.12 Change in cash flow+0.10 +0.02 +0.080.0–0.08 –0.12The PV of the change in the cash-flow stream (at a discount rate of 12%) is $0.0627 million.Est time: 06–1030. a. Annual depreciation is ($115 - $15)/5 = $20 million. Book value at the time of sale is $115 - (2 ⨯ $20) = $75 million. Sales price = $80 million, so net-of-tax proceeds from the sale are:$80 - (0.35 ⨯ $5) = $78.25 millionTherefore, the net cash outlay at time 0 is $150 - $78.25 = $71.75 million.Year0 1 2 3 4 5 6 Sales (traps) 0.5 0.6 0.6 1 1 0.6 0.2 Revenue0 2 2.4 2.4 4 4 2.4 0.8 Working capital0.2 0.24 0.4 0.40.4 0.24 0.08 0 Change in working capital –0.20.04 0.16 0–0.16–0.16–0.08 Revenues 2 2.4 2.4 4 4 2.4 0.8 Expense 0.75 0.9 0.9 1.5 1.5 1.5 0.9 0.3 Depreciation 1.2 1.92 1.152 0.6912 0.6912 0.3456 Pretax 0.05 –0.42 1.348 1.8088 0.8088 0.1544 Tax0.0175 –0.147 0.4718 0.63308 0.28308 0.05404 After-tax profit0.0325 –0.273 0.8762 1.17572 0.52572 0.10036 Cash flow from operations 1.2325 1.647 2.0282 1.86692 1.21692 0.44596 Cash flow: capital invest. –6 0.325 Cash flow from WC–0.2 –0.04 –0.16 0 0.16 0.16 0.08 Cash flow from operations 0 1.2325 1.647 2.0282 1.86692 1.21692 0.44596 Tota –6.2 1.1925 1.487 2.0282 2.02692 1.376920.85096Net present–0.00564b. The project saves $10 million in operating costs and increases sales by $25 million.Depreciation expense for the new machine would be $50 million per year. Therefore,including the depreciation tax shield, operating cash flow increases by:($25 + $10) ⨯ (1 - 0.35) + ($50 ⨯ 0.35) = $40.25 million per yearc. NPV = -$71.75 + [$40.25 ⨯ annuity factor (10%, 3 years)]To find the internal rate of return, set the PV of the annuity to $71.75 and solve forthe discount rate (r):Est time: 11–1531. At the optimistic production level the NPV of the power plant is $453 million:Year Revenue Fuel Costs Labor & Other Depreciation Oper. Prof.Tax Cash Flow Present Value 0-386-3861398.64229.5245.0014.48109.6538.3885.7476.562410.60236.4146.3527.8799.9734.9992.8574.023422.92243.5047.7425.78105.8937.0694.6267.354435.60250.8049.1723.85111.7739.1296.5161.335448.67258.3350.6522.04117.6641.1898.5255.906462.13266.0852.1720.38123.5143.23100.6651.007476.00274.0653.7318.88129.3345.27102.9446.568490.28282.2855.3417.45135.2047.32105.3342.549504.99290.7557.0017.22140.0249.01108.2339.0310520.13299.4758.7117.22144.7350.66111.2935.8311535.74308.4660.4817.22149.5952.36114.4532.9012551.81317.7162.2917.22154.6054.11117.7030.2113568.37327.2464.1617.22159.7555.91121.0527.7414585.42337.0666.0817.22165.0657.77124.5025.4815602.98347.1768.0717.22170.5359.68128.0623.4016621.07357.5870.1117.22176.1661.66131.7221.4917639.70368.3172.2117.22181.9663.69135.4919.7318658.89379.3674.3817.22187.9465.78139.3718.1219678.66390.7476.6117.22194.0967.93143.3716.6520699.02402.4678.9117.22200.4370.15147.4915.2921719.99414.5481.288.61215.5775.45148.7313.7722741.59426.9783.710.00230.9080.81150.0812.4023763.84439.7886.220.00237.8383.24154.5911.4124786.75452.9888.810.00244.9685.74159.2310.4925810.35466.5791.480.00252.3188.31164.009.65NPV:452.84 The company should go ahead with the project since the NPV is still positive ($24.45million) at the more realistic production level of 3.624 (6.04 × 0.060) million megawatt-hours.Year Revenue Fuel Costs Labor & Other Depreciation Oper. Prof.Tax Cash Flow Present Value 0-386-386 1239.18137.7145.0014.4842.0014.7041.7737.30 2246.36141.8446.3527.8730.3010.6047.5637.92 3253.75146.1047.7425.7834.1311.9447.9734.14 4261.36150.4849.1723.8537.8513.2548.4630.80 5269.20155.0050.6522.0441.5214.5349.0327.82 6277.28159.6552.1720.3845.0915.7849.6925.17 7285.60164.4453.7318.8848.5616.9950.4422.81 8294.17169.3755.3417.4552.0118.2051.2520.70 9302.99174.4557.0017.2254.3219.0152.5218.94 10312.08179.6858.7117.2256.4719.7653.9217.36 11321.44185.0760.4817.2258.6820.5455.3615.91 12331.09190.6362.2917.2260.9521.3356.8414.59 13341.02196.3464.1617.2263.3022.1558.3613.37 14351.25202.2366.0817.2265.7223.0059.9312.26 15361.79208.3068.0717.2268.2023.8761.5511.24 16372.64214.5570.1117.2270.7724.7763.2110.31 17383.82220.9972.2117.2273.4125.6964.939.46 18395.33227.6274.3817.2276.1226.6466.708.67 19407.19234.4576.6117.2278.9227.6268.527.96 20419.41241.4878.9117.2281.8128.6370.397.30 21431.99248.7281.288.6193.3932.6969.31 6.42 22444.95256.1883.710.00105.0536.7768.29 5.64 23458.30263.8786.220.00108.2137.8770.33 5.19 24472.05271.7988.810.00111.4539.0172.44 4.77 25486.21279.9491.480.00114.8040.1874.62 4.39NPV:24.45 Est time: 11–15。