雅思高分小作文总结
雅思作文满分范文(5篇)
雅思作文满分范文(5篇)(经典版)编制人:__________________审核人:__________________审批人:__________________编制单位:__________________编制时间:____年____月____日序言下载提示:该文档是本店铺精心编制而成的,希望大家下载后,能够帮助大家解决实际问题。
文档下载后可定制修改,请根据实际需要进行调整和使用,谢谢!并且,本店铺为大家提供各种类型的经典范文,如工作总结、工作计划、合同协议、条据文书、策划方案、句子大全、作文大全、诗词歌赋、教案资料、其他范文等等,想了解不同范文格式和写法,敬请关注!Download tips: This document is carefully compiled by this editor. I hope that after you download it, it can help you solve practical problems. The document can be customized and modified after downloading, please adjust and use it according to actual needs, thank you!Moreover, our store provides various types of classic sample essays for everyone, such as work summaries, work plans, contract agreements, doctrinal documents, planning plans, complete sentences, complete compositions, poems, songs, teaching materials, and other sample essays. If you want to learn about different sample formats and writing methods, please stay tuned!雅思作文满分范文(5篇)雅思作文满分范文第1篇下面给大家讲解一下小作文的心得和训练方法:小作文(A类)心得:为考的是A类,这里只说A类,留学生的话也建议考A类,平时写报告其实就是在练小作文,尤其是理工科。
IELTS小作文重点内容小结
小作文评分标准:一、Task Achievement (TA)二、Coherence and cohesion (CC)Coherence1、结构2、逻辑清晰Cohesion1、连接词使用2、精确多变三、Lexical resource (LR)3四、Grammatical range and accuracy (GRA)3小作文:曲线图必备词汇和句型:1、上升:grow/ increase/ rise/ ascend/go upclimbjump/ leap/ surge/ shoot up/ soar/ rocket2、下降:fall/ decrease/ drop/ descend/ reducedip/ shrink/ sinkslump/ plump/ plummet变化幅度:slight(ly)/smallminimal(ly)/minorsteady(ily)moderate/moderatelysharp/great/steep/significant(ly)dramatical/enormous/substantial/considerable(ly)3、平稳:remain steady at, keep the same levellevel off, level out, stay constant4、波动:fluctuate around/ fluctuate between…and…go up and downrise and fall5、达到顶峰:reach to the peak/ top/ summit/peak at,maximum atreach the highest point6、达到低谷:reach the lowest point/ level,degree atreach the bottom at,趋势描写6大常用句型There be句型:There was a sharp decrease in the number of teachers from five million in 1960 to three million in 1962.横坐标:The years from 1960 to 1962 saw a great fall in the number of teachers, decreasing from five million to three million.纵坐标:The number dropped from five million in 1960 to 3 million in 1962.地点做主语:China saw a decline in the number of teachers from 1960 in five million to 1962 in three million.描述对象做主语:Increasingly less teachers were in position from 1960 to 1962.趋势做主语:The overall trend tended to indicate the increasingly falling number of teachers from 1960 in five million to 1962 in three million.小作文句子的时态问题:1、对数据的描述:用一般过去时2、图表如是将来情况预测:全用一般现在时3、对图表本身的描述一般现在时小作文6大核心衔接手段1、表示之后then, from then on, next,after that, afterwards,thereafter2、时间词, when …/which is followed by..3、对比adv: but,however, by contrast, on the other hand conj: while, whilst, whereasprep: compared with.../different from.../in contrast to;4、类比similarly/likewise; A similar tendency is...again;5、表示对象As for TV viewers,...As to the other two countries,...6、补充说明in addition, furthermore, moreover,开头段常用句型:The ...chart indicates the number of/ percentage of +题目文字信息The ...chart gives information about + 题目文字信息线图小结:重点:趋势变化1、按趋势连续变化分段描述。
雅思小作文线图满分范文汇总
雅思⼩作⽂线图满分范⽂汇总雅思⼩作⽂线图满分范⽂汇总雅思⼩作⽂中的线图,作为动态图的代表,在很⼤程度上来说是属于⽐较困难的考题类型。
但是⼀篇好的范⽂,从很⼤程度上就可以帮助雅思考⽣解决这些难题,但是整个⽹上关于雅思线图的范⽂很少,⽽图⽚的质量也乏善可陈。
针对这个问题,超级学长的⽼师精挑细选了5篇雅思⼩作⽂中的线图满分范⽂给雅思考⽣作为参考。
这5篇范⽂都属于过往的真题,从质量上,典型性上都⾮常具有研究,学习,模仿的价值。
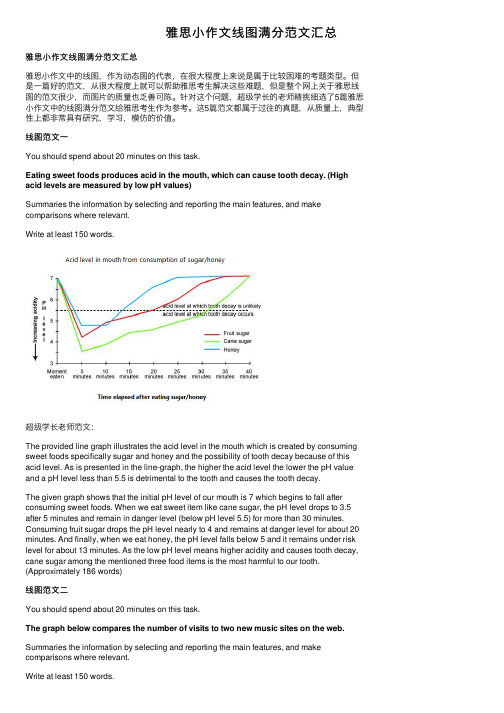
线图范⽂⼀You should spend about 20 minutes on this task.Eating sweet foods produces acid in the mouth, which can cause tooth decay. (High acid levels are measured by low pH values)Summaries the information by selecting and reporting the main features, and make comparisons where relevant.Write at least 150 words.超级学长⽼师范⽂:The provided line graph illustrates the acid level in the mouth which is created by consuming sweet foods specifically sugar and honey and the possibility of tooth decay because of this acid level. As is presented in the line-graph, the higher the acid level the lower the pH value and a pH level less than 5.5 is detrimental to the tooth and causes the tooth decay.The given graph shows that the initial pH level of our mouth is 7 which begins to fall after consuming sweet foods. When we eat sweet item like cane sugar, the pH level drops to 3.5 after 5 minutes and remain in danger level (below pH level 5.5) for more than 30 minutes. Consuming fruit sugar drops the pH level nearly to 4 and remains at danger level for about 20 minutes. And finally, when we eat honey, the pH level falls below 5 and it remains under risk level for about 13 minutes. As the low pH level means higher acidity and causes tooth decay, cane sugar among the mentioned three food items is the most harmful to our tooth. (Approximately 186 words)线图范⽂⼆You should spend about 20 minutes on this task.The graph below compares the number of visits to two new music sites on the web. Summaries the information by selecting and reporting the main features, and make comparisons where relevant.Write at least 150 words.超级学长⽼师范⽂:The graph exhibits the public interest of using two new music websites named Music Choice and Pop Parade in the period of 15 days’ time. According to the graph, the trends were totally unstable and have swung extremely.The statistics of Pop Parade shows the starting point of 120000 visitors on the first day and decreased during the following 7days with the minimum number of visitors of 40000 on the 7th day. The fluctuation of Music Choice website wasn’t as extreme as the Pop Parade in the first week. The Music Choice started with 40000 visitors in the 1st day and the same number of visitors on the 7th day with small amount of changes during this week. In the 2nd week, both of the websites had the increasing interest of visitors i.e. Pop Parade reached to 140000 visitors on the 11th day and Music Choice reached to 120000 on the 12th day, and after some oscillations, the websites ended the 15 day period with 180000 and 80000 respectively. According to the chart, the rate of 180000 was the maximum of viewers that belongs to Pop Parade and Pop Parade has More public interest for the viewers altogether than the Music Choice within these two weeks.( Approximately 204 words )线图范⽂三You should spend about 20 minutes on this task.The line graph below gives information on cinema attendance in the UK.Summaries the information by selecting and reporting the main features, and make comparisons where relevant.Write at least 150 words.超级学长⽼师范⽂:The given line graph shows the number of cinema-going UK people and classifies theseviewers in four age groups. As is observed from the graph, people over 40 years old went to movies more than the younger people of the UK.As is observed from the line graph, the people of 44 to 54 years-old attended cinema more than the people of other age groups who are less than 44 years old. Only 15% of the UK citizens who were between 14 to 24 years old attended in cinema in 1990 while this percentage increased with the increase of age group. In this same year, more than 35% people over 40 years attended the cinema. It is clear from the data that, the people in UK trend to attend cinema more with the increase of their age. The cinema goer’s number increased gradually from 1990 to 2010 except for 1995 to 2000. In 2010, the number of cinema attendees was also dominated by the age group of 44 to 54 and the percentage of cinema attendees from all age groups increased by 5% on an average than the percentages were in 2005.线图范⽂四You should spend about 20 minutes on this task.The graph below shows the differences in wheat exports over three different areas. Summaries the information by selecting and reporting the main features, and make comparisons where relevant.Write at least 150 words.超级学长⽼师范⽂:The given line graph compares the wheat exports over three different parts of the world namely Australia, Canada and the European Community from 1985 to 1990. As is presented in the graph, the wheat export in Australia decreased over time while the export in Canada and European countries increased with some fluctuations.According to the graph, around 15 to 20 million tons of wheat was exported to Australia, Canada and the European community. This amount decreased slightly in 1986 reaching around 15 million tons and from that point, the export quantity in Australia kept on decreasing and reached just over 10 million tons in 1990. In the meantime, the amount increased sharply in Canada until 1988 and then there was a quick decline and finally, it reached around 19 million tons in 1990. Finally, the wheat export in the European Community increased gradually over the years and reached over 20 million tons in 1990.线图范⽂五You should spend about 20 minutes on this task.The chart below shows the changes that took place in three different areas of crime in New Port city center from 2003-2012.Summaries the information by selecting and reporting the main features, and make comparisons where relevant.Write at least 150 words.超级学长⽼师范⽂:The graph represents the variation in levels in the three main areas of crime in the centre of Newport city in the time period from 2003 to 2012.To start with, it was 3400 incidences of burglary in 2003 and 3750 in 2004. Fortunately, in the next 4 years it fell down dramatically and reached the absolute minimum in 2008 (1100 incidences), however, it then grew by 300 accidents and remained fairly constant by 2012.Car theft was a steady level of crime from 2003 to 2004 and got reduced in next 5 years from 2700 up to 2250. The number then increased to 2700 in 2012.Robbery reached its peak in 2005, which was 900 cases and decreased back to 500 in 2008. In the following two years, the number of incidences rose to 700 and continued to stay at this level in 2012.In conclusion, in the Newport city centre, the rate of burglary fell significantly, the level of robbery remained fairly constant, whereas car theft raised and had the biggest number of incidences in 2012.。
雅思小作文范文10篇
雅思小作文范文10篇英文回答:1. Write a letter to your friend describing your new house.Dear [Friend's Name],。
I hope this letter finds you well. I'm writing to you today to tell you all about my new house! I'm so excited to finally have a place of my own, and I know you're going to love it too.The house is located in a quiet neighborhood, and it's just a short walk from the beach. It's a two-story house with three bedrooms and two bathrooms. The kitchen is spacious and has all the appliances I need. The living room is cozy and has a fireplace. The backyard is fenced in and has a patio and a fire pit.I've been living in the house for about a month now, and I'm really starting to feel at home. I love cooking in the kitchen, and I've been spending a lot of time reading in the living room. The backyard is perfect for entertaining, and I've already had a few friends over for BBQs.I know you're coming to visit next month, and I can't wait to show you my new house. I think you're going to love it as much as I do.Love,。
剑桥雅思写作9分范文
剑桥雅思写作9分范文全文共四篇示例,供读者参考第一篇示例:剑桥雅思写作9分范文是许多考生梦寐以求的目标,因为在雅思考试中,写作部分是考生们最容易失分的一个环节,而如果能够获得9分的成绩,不仅可以为自己的留学梦想加分,还可以为自己的英语水平证明注入信心。
下面我将为大家分享一篇剑桥雅思写作9分范文,供大家参考。
雅思写作的主题通常是关于社会、文化、环境等方面的话题,以此来考察考生们对于当今社会问题的理解和分析能力。
以下是一篇经典的剑桥雅思写作9分范文:题目:现代社会中越来越多的年轻人选择过简单的生活方式,他们放弃了追求财富和名利的念头,转而追求简单而真实的生活。
请你谈谈对这种趋势的看法。
范文:In today's society, more and more young people are choosing to live a simple life. They are abandoning the pursuit of wealth and fame, instead opting for a simple and authentic lifestyle. This trend has sparked a heated debate among people.On the one hand, those who support this trend argue that the pursuit of simplicity can bring a sense of peace and contentment to individuals. In a fast-paced and materialistic society, many young people feel overwhelmed by the pressureto succeed and constantly compare themselves to others. By choosing to live a simple life, they can focus on what truly matters to them, such as personal relationships, health, and personal growth. Moreover, living a simple life can also have positive effects on the environment, as it involves consuming less and reducing waste.以上就是一篇经典的剑桥雅思写作9分范文,希望对大家有所帮助。
雅思英语作文范文10篇
雅思英语作文范文10篇英文回答:1. Environmental Sustainability.Environmental sustainability is a critical issue facing our planet today. The impact of human activities on the environment, such as pollution, deforestation, and climate change, has reached alarming levels. As a result, there is an urgent need to adopt sustainable practices and reduce our ecological footprint. One effective way to achieve this is through the implementation of renewable energy sources, such as solar and wind power. These technologies harness natural resources to generate electricity without emitting harmful greenhouse gases, thereby mitigating the effects of climate change. Additionally, promoting energy efficiency measures, such as the use of energy-efficient appliances and the adoption of sustainable transportation methods, can further reduce our dependence on fossil fuels.中文回答:1. 环境可持续性。
雅思小作文写法总结(附例句段落)
Line graph:1. introduction2. summary3. details1(起点比较-描写趋势直到关键点)4. details2(关键点后的一般趋势-终点比较)summary1.总规律+最显著的曲线特征It is clear that the total amount of acid rain emissions in the UK fell considerably between 1990 and 2007. The most dramatic decrease was seen in the electricity, gas and water supply sector.2.杂乱曲线倍数或排序关系It is clear that Canada exported more wheat than Australia and the European Community for most of the period shown. However, while Canada's wheat exports fluctuated and Australia's fell, wheat exports from the European Community rose steadily.DetailsIn 1990, around 3.3 million tonnes of acid rain emissions came from the electricity, gas and water sector. The transport and communication sector was responsible for about 0.7 million tonnes of emissions, while the domestic sector produced around 0.6 million tonnes. Just over 2 million tonnes of acid rain gases came from other industries.Emissions from electricity, gas and water supply fell dramatically to only 0.5 million tonnes in 2007, a drop of almost 3 million tonnes. While acid rain gases from the domestic sector and other industries fell gradually, the transport sector saw a small increase in emissions, reaching a peak of 1 million tonnes in 2005.Process diagram:1. introduction2. summary3. details1(一般用被动)4. details2introductionThe picture illustrates the process of coffee manufacture and preparation for sale on the market.summary描述步骤,抓主要特征(introduction和overview很短可以合在一起写)1.It is clear that there are ___ distinct stages in this process, beginning with ______.The final __steps show________.2.The flow chart shows how waste paper is recycled. It is clear that there are six distinct stages in this process, from the initial collection of waste paper to the eventual production of usable paper.Details(first,then,at the sixth stage,next,after that,finally)Looking at the coffee production process in detail, coffee beans must first be picked in the fields. These beans are then dried, roasted, and cooled before being put in a grinding machine, which turns the beans into coffee granules. At the sixth stage in the process, the ground coffee is mixed with hot water, and the resulting mixture is strained. Next, the mixture is frozen and then passed once again through the grinder. After that, the ground, frozen liquid is dried in a vacuum so that the water evaporates, leaving the coffee granules. Finally, these granules are packed into coffee jars for delivery to shops.Bar chart:1. introduction2. summary(比较数据的分类或者最大数最小数)3. details1(位列前二的数)4. details2(其他数可以一并概括)summary1. It is clear that the most incidents and injuries took place on demand-response vehicles. By contrast, commuter rail services recorded by far the lowest figures.2. It is clear that the proportion of students who study for career purposes is far higher among the younger age groups, while the oldest students are more likely to study for interest. Employer support is more commonly given to younger students.Details具体数字最大值+second A total of 225 incidents and 173 injuries, per 100 million passenger miles travelled, took place on demand-response transport services. These figures were nearly three times as high as those for the second highest category, bus services. There were 76 incidents and 66 people were injured on buses.Rail services experienced fewer problems. The number of incidents on light rail trains equalled the figure recorded for buses, but there were significantly fewer injuries, at only 39. Heavy rail services saw lower numbers of such events than light rail services, but commuter rail passengers were even less likely to experience problems. In fact, only 20 incidents and 17 injuries occurred on commuter trains.Around 80% of students aged under 26 study to further their careers, whereas only 10% study purely out of interest. The gap between these two proportions narrows as students get older, and the figures for those in their forties are the same, at about 40%. Students aged over 49 overwhelmingly study for interest (70%) rather than for professional reasons (less than 20%).Just over 60% of students aged under 26 are supported by their employers. By contrast, the 30-39 age group is the most self-sufficient, with only 30% being given time off and help with fees. The figures rise slightly for students in their forties and for those aged 50 or more.Table:1. introduction2. summary(比较数据的分类或者最大数最小数)3. details1(每行每列最大数最小数/变化最大的数)4. details2(倍数对比或大小比较---middles数据)summary1.从列举的比较对象描述+数据排序前几名The table compares the six networks in terms of their age, size and the number of people who use them each year. It is clear that the three oldest underground systems are larger and serve significantly more passengers than the newer systems.2.最大值+最大区别It is clear that people in the UK spend more time sleeping than doing any other daily activity. Also, there are significant differences between the time spent by men and women on employment/study and housework.3.最大最小(比例描述)It is clear that the largest proportion of consumer spending in each country went on food, drinks and tobacco. On the other hand, the leisure/education category has the lowest percentages in the table.Details1.最大数(不用再提顺序)+第二On average, men and women in the UK sleep for about 8 hours per day. Leisure takes up the second largest proportion of their time.2.具体数字对比Men spend 5 hours and 25 minutes doing various leisure activities, such as watching TV or doing sport, while women have 4 hours and 53 minutes of leisure time.2.倍数对比/大小比较(顺序不用提)It is noticeable that men work or study for an average of 79 minutes more than women every day. By contrast, women spend 79 minutes more than men doing housework, and they spend over twice as much time looking after children.最大值Out of the five countries, consumer spending on food, drinks and tobacco was noticeably higher in Turkey, at 32.14%, and Ireland, at nearly 29%. The proportion of spending on leisure and education was also highest in Turkey, at 4.35%, while expenditure on clothing and footwear was significantly higher in Italy, at 9%, than in any of the other countries.最小值It can be seen that Sweden had the lowest percentages of national consumer expenditure for food/drinks/tobacco and for clothing/footwear, at nearly 16% and just over 5% respectively. Spain had slightly higher figures for these categories, but the lowest figure for leisure/education, at only 1.98%. Pies(三个及以上相似图形)1. introduction5. summary(最大最小比例或其余总概括)6. details1(按照划分部分进行对比)7. details2introduction:The pie charts compare the proportion of carbohydrates, protein and fat in three different diets, namely an average diet, a healthy diet, and a healthy diet for sport.summary1. 找出最大区别及共性It is clear that Italy had the older population in the year 2000,and that the same is predicted for the year 2050. The populations of both countries are expected to age over the fifty-year period.2. It is noticeable that sportspeople require a diet comprising a significantly higherproportion of carbohydrates than an average diet or a healthy diet. The average diet contains the lowest percentage of carbohydrates but the highest proportion of protein.DetailsCarbohydrates make up 60% of the healthy diet for sport. This is 10% higher than the proportion of carbohydrates in a normal healthy diet, and 20% more than the proportion in an average diet. On the other hand, people who eat an average diet consume a greater relative amount of protein (40%) than those who eat a healthy diet (30%) and sportspeople (25%).The third compound shown in the charts is fat. Fat constitutes exactly fifth of both the average diet and the healthy diet, but the figure drops to only 15% for the healthy sports diet.Expenditure on resources (e.g. books) had increased to 20% by 1991 before decreasing to only 9% by the end of the period. In contrast, the cost of furniture and equipment saw an opposite trend. This cost decreased to only 5% of total expenditure in 1991 but rose dramatically in 2001 when it represented 23% of the school budget. Similarly, the cost of insurance saw a rising trend, growing from 2% to 8% by 2001.饼图占比:描述多样化,不重要的可以总的概括,可用短句,图例可以写进去In an average English home, the largest proportion of electricity, 52.5%, is used for heating rooms and water. Three kitchen appliances, namely ovens, kettles and washing machines, account for 17.5% of household electricity use. The remaining 30% of electricity is used for lighting, televisions and radios (15%), and vacuum cleaners, food mixers and electric tools (15%).9Test3: The pie charts compare the proportions of people falling into three distinct age groups in Yemen and Italy in two different years.It is clear that Italy had the older population in the year 2000, and that the same is predicted for the year 2050. The populations of both countries are expected to age over the fifty-year period.In the year 2000,just over half of the population of Yemen was aged 14 or under, while most Italians (61.6%) fell into the 15 to 59 age group, and only 14.3% were children under 15 years of age. People aged 60 or over accounted for almost a quarter of the Italian population, but only 3.6% of the inhabitants of Yemen.By 2050, the proportion of children under 15 is predicted to drop in both countries, most noticeably in Yemen where the figure is expected to fall by 13.1%. On the other hand, the figures for elderly people are expected to rise, by 2.1% in Yemen and a massive 18.2% in Italy. Finally, it is anticipated that the 15 to 59 age group will grow by around 10% in Yemen, but shrink by around 15% in Italy.Line+table(两种不同的图形)1. Introduction2. Summary (每个图表的特征,有联系的要进行比较)3. Details14. Details2。
雅思小作文考官范文(精选6篇)
雅思小作文考官范文(精选6篇)(经典版)编制人:__________________审核人:__________________审批人:__________________编制单位:__________________编制时间:____年____月____日序言下载提示:该文档是本店铺精心编制而成的,希望大家下载后,能够帮助大家解决实际问题。
文档下载后可定制修改,请根据实际需要进行调整和使用,谢谢!并且,本店铺为大家提供各种类型的经典范文,如工作总结、工作计划、合同协议、条据文书、策划方案、句子大全、作文大全、诗词歌赋、教案资料、其他范文等等,想了解不同范文格式和写法,敬请关注!Download tips: This document is carefully compiled by this editor. I hope that after you download it, it can help you solve practical problems. The document can be customized and modified after downloading, please adjust and use it according to actual needs, thank you!Moreover, our store provides various types of classic sample essays for everyone, such as work summaries, work plans, contract agreements, doctrinal documents, planning plans, complete sentences, complete compositions, poems, songs, teaching materials, and other sample essays. If you want to learn about different sample formats and writing methods, please stay tuned!雅思小作文考官范文(精选6篇)雅思小作文考官范文第1篇第一段:复述文章主题+引出论点典型的大作文文章开篇,中规中矩,不失为实战中最好用也是最稳妥的写法。
雅思小作文总结word版本
雅思小作文总结雅思小作文总结一、评分标准(1)任务完成情况:趋势描写,数据支持,不要画蛇添足(2)关联词大量而准确地使用(连贯)(3)词汇(4)句子结构二、写作要求(1)客观性不能有想象成分,总结归纳要符合逻辑。
(2)准确性数据要求精确(不抄错),可以合理目测(大概数值)。
(3)详尽性4类特征数据一定介绍:最大值(maximum),最小值(minimum),交叉点(intersection),变化趋势(trend)。
三、作文类型Line graphPie chartBar chart 70%TableFlow graph/process diagram 20%Others 10%四、解题技巧A. 表格图1横向比较: 介绍横向各个数据的区别,变化和趋势 2纵向比较:介绍横向各个数据的区别,变化和趋势 3无需将每一个数据分别说明,突出强调数据最大值和最小值,对比时要总结出数据对比最悬殊的和最小的说明:考察例举数字的能力和方法。
注意怎样通过举一些有代表性的数据来有效地说明问题。
B.线图1极点说明: 对图表当中最高的,最低的点要单独进行说明2趋势说明: 对图表当中曲线的连续变化进行说明,如上升,下降,波动,持平3交点说明: 对图表当中多根曲线的交点进行对比说明说明:关键是把握好曲线的走向和趋势,学会general classification,即在第二段的开头部分对整个曲线进行一个阶段式的总分类,使写作层次清晰。
接下来在分类描述每个阶段的specific trend,同时导入数据作为你分类的依据。
注意不要不做任何说明就机械性的导入数据!C. 饼状图1介绍各扇面及总体的关系 2各个扇面之间的比较,同类扇面在不同时间,不同地点的比较 3重点突出特点最明显的扇面:最大的,最小的,互相成倍的D. 柱状图1.比较: similarity2.对比: difference)3.横向总结所有柱状图表的共性特征 & 分别描写各个柱子的个性特征4,有年份的可按照线图的写作方法。
雅思高分小作文总结
雅思 A 类 9 分小作文技巧分析
第一节 总体概括
IELTS Writing Task 1: summarize 一般性结构总结
A 类图标作文的写作结构 Introduction 1-2 句 题目改写: 3变1加 变词性,变位置,变同义,加信息。
Overview 1-2 句 Main Body 2 段
总结最重要的信息,或最重要的趋势。一般总结两个大的特点或趋 势。 总体趋势、特征 + 顺序逐句描述 数字信息+文字信息+ 比较趋势
(4)开始写作
3
雅思 A 类 9 分小作文技巧分析
第二节 首段
第一段 题目改写: 3变1加。变词性,变位置,变同义,加信息。
1. Example: The graphs below show the enrollments of overseas students and local students in Britain's university. Rewrite: the graphs give information about the proportion of overseas students and local students enrolled in Britain's universities from 1998 to 2008. 2. Example: The table below shows the proportion of different categories of families living in poverty in Australia in 1999.
- 1、下载文档前请自行甄别文档内容的完整性,平台不提供额外的编辑、内容补充、找答案等附加服务。
- 2、"仅部分预览"的文档,不可在线预览部分如存在完整性等问题,可反馈申请退款(可完整预览的文档不适用该条件!)。
- 3、如文档侵犯您的权益,请联系客服反馈,我们会尽快为您处理(人工客服工作时间:9:00-18:30)。
IELTS Writing Task 1: avoid Don't copy the question for your introduction. You should paraphrase the question (i.e. rewrite it using some different words). 2 Don't forget to separate your paragraphs clearly. 3 Don't forget to write a good summary/overview of the information. A quick one-sentence conclusion is not good enough. I prefer to put the overview straight after the introduction, and I try to write 2 sentences describing the information in general. You won't get a high score if you don't write a good overview. 4 Don't describe items separately (e.g. 2 lines on a graph). You should always try to compare things if it is possible to do so. Instead of describing 2 lines separately, compare the 2 lines at key points. 5 Don't try to describe every number on a chart or graph (unless there are only a few numbers). A key skill in task 1 is being able to choose the key information and describe or compare it well. Mentioning
1
雅思 A 类 9 分小作文技巧分析
around 6 or 7 numbers in my main paragraphs. 6 Don't spend longer than 20 minutes on task 1. Practise spending 5 minutes on each of your 4 paragraphs. Stop yourself after 20 minutes; remember that task 2 is worth more marks.
IELTS Writing Task 1: summarize 一般性结构总结
A 类图标作文的写作结构 Introduction 1-2 句 题目改写: 3变1加 变词性,变位置,变同义,加信息。
Overview 1-2 句 Main Body 2 段
总结最重要的信息,或最重要的趋势。一般总结两个大的特点或趋 势。 总体趋势、特征 + 顺序逐句描述 数字信息+文字信息+ 比较趋势
IELTS Writing Task 1: general to specific
If you read any of my example essays, you will see that I always write 4 paragraphs, and I use a "general to specific" essay structure. The introduction is the most general part of the essay; it tells the reader what the chart is about. Then I write a paragraph about the main points or the most general points. Finally, I write 2 paragraphs describing specific facts or figures. I don't write a conclusion because I have already summarised the information in paragraph 2. One reason I put the summary near the beginning (rather than at the end) is because I think it's easier to describe general things first, then specific things later.
雅思 A 类 9 分小作文技巧分析
第一节 总体概括
IELTS Writing Task 1: technique review 应注意事项
Let's review the approach (method / technique) that I suggest for writing task 1. Your task 1 essay should contain three elements: 1 You need a short introduction to explain what the graph, chart or diagram shows. The easiest way to write this is by paraphrasing the question. The examiner will be impressed if you can paraphrase effectively. 2 You need an overview of the information. This means that you need to look at the "big picture", not the individual details. I recommend writing a short paragraph with two sentences that summarise two main things that you can see on the chart. If you forget the overview, you'll get a lower score. 3 Finally, you need to describe some specific details. This is where you select, describe and compare individual pieces of information (usually numbers). I try to separate this description of details into two paragraphs.