小作文写作要点总结(雅思小作文)
雅思小作文总结
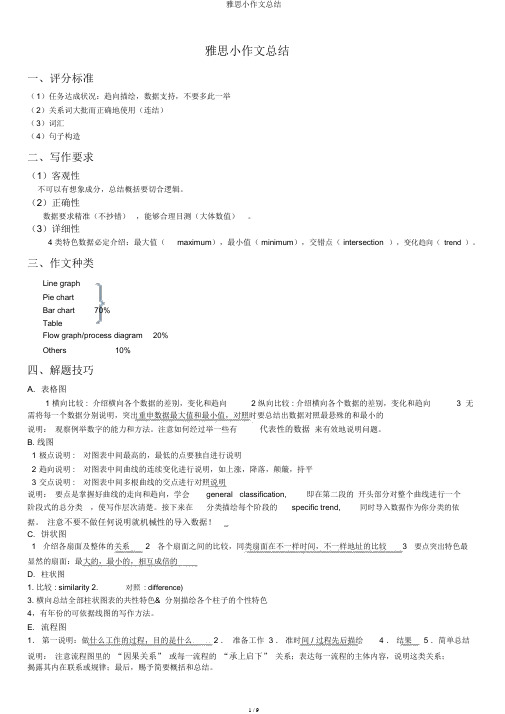
雅思小作文总结一、评分标准(1)任务达成状况:趋向描绘,数据支持,不要多此一举(2)关系词大批而正确地使用(连结)(3)词汇(4)句子构造二、写作要求(1)客观性不可以有想象成分,总结概括要切合逻辑。
(2)正确性数据要求精准(不抄错),能够合理目测(大体数值)。
(3)详细性4 类特色数据必定介绍:最大值(maximum),最小值( minimum),交错点( intersection),变化趋向(trend)。
三、作文种类Line graphPie chartBar chart70%TableFlow graph/process diagram20%Others10%四、解题技巧A.表格图1 横向比较 : 介绍横向各个数据的差别,变化和趋向2 纵向比较 : 介绍横向各个数据的差别,变化和趋向3 无需将每一个数据分别说明,突出重申数据最大值和最小值,对照时要总结出数据对照最悬殊的和最小的说明:观察例举数字的能力和方法。
注意如何经过举一些有代表性的数据来有效地说明问题。
B. 线图1极点说明 :对图表中间最高的,最低的点要独自进行说明2趋向说明 :对图表中间曲线的连续变化进行说明,如上涨,降落,颠簸,持平3交点说明 :对图表中间多根曲线的交点进行对照说明说明:要点是掌握好曲线的走向和趋向,学会general classification,即在第二段的开头部分对整个曲线进行一个阶段式的总分类,使写作层次清楚。
接下来在分类描绘每个阶段的specific trend,同时导入数据作为你分类的依据。
注意不要不做任何说明就机械性的导入数据!C.饼状图1介绍各扇面及整体的关系2各个扇面之间的比较,同类扇面在不一样时间,不一样地址的比较3要点突出特色最显然的扇面:最大的,最小的,相互成倍的D.柱状图1. 比较 : similarity2.对照: difference)3.横向总结全部柱状图表的共性特色& 分别描绘各个柱子的个性特色4,有年份的可依据线图的写作方法。
雅思作文满分范文(5篇)
雅思作文满分范文(5篇)(经典版)编制人:__________________审核人:__________________审批人:__________________编制单位:__________________编制时间:____年____月____日序言下载提示:该文档是本店铺精心编制而成的,希望大家下载后,能够帮助大家解决实际问题。
文档下载后可定制修改,请根据实际需要进行调整和使用,谢谢!并且,本店铺为大家提供各种类型的经典范文,如工作总结、工作计划、合同协议、条据文书、策划方案、句子大全、作文大全、诗词歌赋、教案资料、其他范文等等,想了解不同范文格式和写法,敬请关注!Download tips: This document is carefully compiled by this editor. I hope that after you download it, it can help you solve practical problems. The document can be customized and modified after downloading, please adjust and use it according to actual needs, thank you!Moreover, our store provides various types of classic sample essays for everyone, such as work summaries, work plans, contract agreements, doctrinal documents, planning plans, complete sentences, complete compositions, poems, songs, teaching materials, and other sample essays. If you want to learn about different sample formats and writing methods, please stay tuned!雅思作文满分范文(5篇)雅思作文满分范文第1篇下面给大家讲解一下小作文的心得和训练方法:小作文(A类)心得:为考的是A类,这里只说A类,留学生的话也建议考A类,平时写报告其实就是在练小作文,尤其是理工科。
雅思小作文写法总结(附例句段落)

Line graph:1. introduction2. summary3. details1(起点比较-描写趋势直到关键点)4. details2(关键点后的一般趋势-终点比较)summary1.总规律+最显著的曲线特征It is clear that the total amount of acid rain emissions in the UK fell considerably between 1990 and 2007. The most dramatic decrease was seen in the electricity, gas and water supply sector.2.杂乱曲线倍数或排序关系It is clear that Canada exported more wheat than Australia and the European Community for most of the period shown. However, while Canada's wheat exports fluctuated and Australia's fell, wheat exports from the European Community rose steadily.DetailsIn 1990, around 3.3 million tonnes of acid rain emissions came from the electricity, gas and water sector. The transport and communication sector was responsible for about 0.7 million tonnes of emissions, while the domestic sector produced around 0.6 million tonnes. Just over 2 million tonnes of acid rain gases came from other industries.Emissions from electricity, gas and water supply fell dramatically to only 0.5 million tonnes in 2007, a drop of almost 3 million tonnes. While acid rain gases from the domestic sector and other industries fell gradually, the transport sector saw a small increase in emissions, reaching a peak of 1 million tonnes in 2005.Process diagram:1. introduction2. summary3. details1(一般用被动)4. details2introductionThe picture illustrates the process of coffee manufacture and preparation for sale on the market.summary描述步骤,抓主要特征(introduction和overview很短可以合在一起写)1.It is clear that there are ___ distinct stages in this process, beginning with ______.The final __steps show________.2.The flow chart shows how waste paper is recycled. It is clear that there are six distinct stages in this process, from the initial collection of waste paper to the eventual production of usable paper.Details(first,then,at the sixth stage,next,after that,finally)Looking at the coffee production process in detail, coffee beans must first be picked in the fields. These beans are then dried, roasted, and cooled before being put in a grinding machine, which turns the beans into coffee granules. At the sixth stage in the process, the ground coffee is mixed with hot water, and the resulting mixture is strained. Next, the mixture is frozen and then passed once again through the grinder. After that, the ground, frozen liquid is dried in a vacuum so that the water evaporates, leaving the coffee granules. Finally, these granules are packed into coffee jars for delivery to shops.Bar chart:1. introduction2. summary(比较数据的分类或者最大数最小数)3. details1(位列前二的数)4. details2(其他数可以一并概括)summary1. It is clear that the most incidents and injuries took place on demand-response vehicles. By contrast, commuter rail services recorded by far the lowest figures.2. It is clear that the proportion of students who study for career purposes is far higher among the younger age groups, while the oldest students are more likely to study for interest. Employer support is more commonly given to younger students.Details具体数字最大值+second A total of 225 incidents and 173 injuries, per 100 million passenger miles travelled, took place on demand-response transport services. These figures were nearly three times as high as those for the second highest category, bus services. There were 76 incidents and 66 people were injured on buses.Rail services experienced fewer problems. The number of incidents on light rail trains equalled the figure recorded for buses, but there were significantly fewer injuries, at only 39. Heavy rail services saw lower numbers of such events than light rail services, but commuter rail passengers were even less likely to experience problems. In fact, only 20 incidents and 17 injuries occurred on commuter trains.Around 80% of students aged under 26 study to further their careers, whereas only 10% study purely out of interest. The gap between these two proportions narrows as students get older, and the figures for those in their forties are the same, at about 40%. Students aged over 49 overwhelmingly study for interest (70%) rather than for professional reasons (less than 20%).Just over 60% of students aged under 26 are supported by their employers. By contrast, the 30-39 age group is the most self-sufficient, with only 30% being given time off and help with fees. The figures rise slightly for students in their forties and for those aged 50 or more.Table:1. introduction2. summary(比较数据的分类或者最大数最小数)3. details1(每行每列最大数最小数/变化最大的数)4. details2(倍数对比或大小比较---middles数据)summary1.从列举的比较对象描述+数据排序前几名The table compares the six networks in terms of their age, size and the number of people who use them each year. It is clear that the three oldest underground systems are larger and serve significantly more passengers than the newer systems.2.最大值+最大区别It is clear that people in the UK spend more time sleeping than doing any other daily activity. Also, there are significant differences between the time spent by men and women on employment/study and housework.3.最大最小(比例描述)It is clear that the largest proportion of consumer spending in each country went on food, drinks and tobacco. On the other hand, the leisure/education category has the lowest percentages in the table.Details1.最大数(不用再提顺序)+第二On average, men and women in the UK sleep for about 8 hours per day. Leisure takes up the second largest proportion of their time.2.具体数字对比Men spend 5 hours and 25 minutes doing various leisure activities, such as watching TV or doing sport, while women have 4 hours and 53 minutes of leisure time.2.倍数对比/大小比较(顺序不用提)It is noticeable that men work or study for an average of 79 minutes more than women every day. By contrast, women spend 79 minutes more than men doing housework, and they spend over twice as much time looking after children.最大值Out of the five countries, consumer spending on food, drinks and tobacco was noticeably higher in Turkey, at 32.14%, and Ireland, at nearly 29%. The proportion of spending on leisure and education was also highest in Turkey, at 4.35%, while expenditure on clothing and footwear was significantly higher in Italy, at 9%, than in any of the other countries.最小值It can be seen that Sweden had the lowest percentages of national consumer expenditure for food/drinks/tobacco and for clothing/footwear, at nearly 16% and just over 5% respectively. Spain had slightly higher figures for these categories, but the lowest figure for leisure/education, at only 1.98%. Pies(三个及以上相似图形)1. introduction5. summary(最大最小比例或其余总概括)6. details1(按照划分部分进行对比)7. details2introduction:The pie charts compare the proportion of carbohydrates, protein and fat in three different diets, namely an average diet, a healthy diet, and a healthy diet for sport.summary1. 找出最大区别及共性It is clear that Italy had the older population in the year 2000,and that the same is predicted for the year 2050. The populations of both countries are expected to age over the fifty-year period.2. It is noticeable that sportspeople require a diet comprising a significantly higherproportion of carbohydrates than an average diet or a healthy diet. The average diet contains the lowest percentage of carbohydrates but the highest proportion of protein.DetailsCarbohydrates make up 60% of the healthy diet for sport. This is 10% higher than the proportion of carbohydrates in a normal healthy diet, and 20% more than the proportion in an average diet. On the other hand, people who eat an average diet consume a greater relative amount of protein (40%) than those who eat a healthy diet (30%) and sportspeople (25%).The third compound shown in the charts is fat. Fat constitutes exactly fifth of both the average diet and the healthy diet, but the figure drops to only 15% for the healthy sports diet.Expenditure on resources (e.g. books) had increased to 20% by 1991 before decreasing to only 9% by the end of the period. In contrast, the cost of furniture and equipment saw an opposite trend. This cost decreased to only 5% of total expenditure in 1991 but rose dramatically in 2001 when it represented 23% of the school budget. Similarly, the cost of insurance saw a rising trend, growing from 2% to 8% by 2001.饼图占比:描述多样化,不重要的可以总的概括,可用短句,图例可以写进去In an average English home, the largest proportion of electricity, 52.5%, is used for heating rooms and water. Three kitchen appliances, namely ovens, kettles and washing machines, account for 17.5% of household electricity use. The remaining 30% of electricity is used for lighting, televisions and radios (15%), and vacuum cleaners, food mixers and electric tools (15%).9Test3: The pie charts compare the proportions of people falling into three distinct age groups in Yemen and Italy in two different years.It is clear that Italy had the older population in the year 2000, and that the same is predicted for the year 2050. The populations of both countries are expected to age over the fifty-year period.In the year 2000,just over half of the population of Yemen was aged 14 or under, while most Italians (61.6%) fell into the 15 to 59 age group, and only 14.3% were children under 15 years of age. People aged 60 or over accounted for almost a quarter of the Italian population, but only 3.6% of the inhabitants of Yemen.By 2050, the proportion of children under 15 is predicted to drop in both countries, most noticeably in Yemen where the figure is expected to fall by 13.1%. On the other hand, the figures for elderly people are expected to rise, by 2.1% in Yemen and a massive 18.2% in Italy. Finally, it is anticipated that the 15 to 59 age group will grow by around 10% in Yemen, but shrink by around 15% in Italy.Line+table(两种不同的图形)1. Introduction2. Summary (每个图表的特征,有联系的要进行比较)3. Details14. Details2。
雅思小作文考官范文(精选6篇)
雅思小作文考官范文(精选6篇)(经典版)编制人:__________________审核人:__________________审批人:__________________编制单位:__________________编制时间:____年____月____日序言下载提示:该文档是本店铺精心编制而成的,希望大家下载后,能够帮助大家解决实际问题。
文档下载后可定制修改,请根据实际需要进行调整和使用,谢谢!并且,本店铺为大家提供各种类型的经典范文,如工作总结、工作计划、合同协议、条据文书、策划方案、句子大全、作文大全、诗词歌赋、教案资料、其他范文等等,想了解不同范文格式和写法,敬请关注!Download tips: This document is carefully compiled by this editor. I hope that after you download it, it can help you solve practical problems. The document can be customized and modified after downloading, please adjust and use it according to actual needs, thank you!Moreover, our store provides various types of classic sample essays for everyone, such as work summaries, work plans, contract agreements, doctrinal documents, planning plans, complete sentences, complete compositions, poems, songs, teaching materials, and other sample essays. If you want to learn about different sample formats and writing methods, please stay tuned!雅思小作文考官范文(精选6篇)雅思小作文考官范文第1篇第一段:复述文章主题+引出论点典型的大作文文章开篇,中规中矩,不失为实战中最好用也是最稳妥的写法。
雅思小作文笔记(个人整理内容最全)

文章结构:Introduction, 1-2 sentences, rewrite the questionBody1, 1+X sentences, 第一句总体概括,X句具体介绍数字Body2, 1+X sentences, 第一句总体概括,X句具体介绍数字Conclusion, 1-2 sentences, 第一句介绍总数(可不写);第二句做总结。
开头段:1-2句,转述原题转述原题3法:①添加单词②删除单词③替换单词(注意:改动不需过多,3-4处,即可)原题一句变两句,两句变一句。
全部改写,要保证语法、句型的正确性。
开头段的时态:永远一般现在时【原文】The table shows the results of a survey in 2004 which asked undergraduate and postgraduate students of a UK university whether they were satisfied with the facilities at the university.【改写】The diagram gives a breakdown(明细表)about different attitudes among undergraduate and postgraduate students towards equipments of a UK college in the year 2004.【原文】The chart below shows the different levels of post-school qualifications in America and the proportion of men and women who held them in 1999.改后:The bar chart illustrates the diverse levels of post-school certificates in the US and the percentage of males and females holding them in 1999.Level out (变得水平;持平)Example: In 1985, earnings leveled out amongst people with a Master’s degree and with a Doctoral degree.句型、词汇、短语:As shown in the first/second …….. ,According to the …….. ,Overall, it can be seen thatThis table shows a striking difference/similarity betweenThe most striking feature of the graph is the sudden increase in the popularity in the computer games.Another fact worth noticing in the graph is that …….后面接完整的句子如果要跟名词不加thatAnother fact worth noticing in the graph is the high cost of fuels.The most remarkable point is that …….The graph shows the difference between the percentages注意用复数of males and females doing full-time jobs.在表示百分数时可以用percent或percentage percentage的一个意思就是百分比(名词)就不能直接跟在数词后面,要表示"百分之36"时,只能说"a PERCENTAGE of 36" 而不是"36 PERCENTAGE"(因为percentage只能作名词);前者用法是: 数词+percent+of+sth;这时后面谓语的单复数以percent后面跟的主语为主,例如:2 percent of the apples(这里是复数的可数名词) are(所以用复数) eaten.2 percent of the apple(这里是单数,指的是一个苹果的一部分) is(用单数) eaten.2 percent of the water(这里是不可数名词) is(单数) drunk.后者的用法是The percentage of +sth+ is, 注意这里不管后面跟的是什么词,都用is(这里忽略别的时态)1.The percentage of the students is 46.2.The percentage of the water is 46.The size of the population will increase shaply in the future..75.6 percent of the male population over sixteen ... …16岁以上男性人群的75.6%.A small/large proportion of students are ……..In Britain people spent the smallest amount of money on personal + sth.大量 a large/considerable/substantial number of 可数 a large/considerable/substantial amount of不可数少量 a small/limited/tiny number of a few of a small/limited/tiny amount of a little ofLots of /a lot of /plenty of 即可用于可数也可用于不可数过去一段时间内的情况变化,用过去式。
最新小作文写作要点总结(雅思小作文)
小作文写作要点总结第一步:确定图标的类型(到底是动态图标,还是静态图标)1.动态图表75% 有两个时间或以上,可以描述趋势,动态图关注趋势+高低2.静态图标25% 没有时间或者只有一个时间,关注描述对象的高低和对比对象的比较第2步:确定时态(过去时,现在时,将来时)1.判断方法:①从图中的时间判断;②从图表的标题判断;③从题目判断2.大部分都是过去式第3步:确定图表的主要信息(最高值,趋势,对比,数字特点)描述对象:1.动态图一般只有一描述对象,而时间不是描述对象2.如果动态图有两组描述对象,国家,年龄段,性别依次是对比对象3.静态图一般有两组描述现象第4步:分段第5步:阅读信息的顺序(从大到小)第6步:确定对象词(描述对象)的准确性第7步:写的时候注意句子结构的变化第8步:句子之间要注意连接词第9步:词性有没有变化,对象词的变化是否正确和合理第10步:检查语法错误,确保不要犯错1、亚洲各国国名及首都中国(北京)、韩国(汉城)、朝鲜(平壤)、日本(东京)马来西亚(吉隆坡)、印度(新德里)、巴基斯坦(伊斯兰堡)泰国(曼谷)、越南(河内)、斯里兰卡(科伦坡)、缅甸(仰光)孟加拉国(达卡)、不丹(廷布)、阿富汗(喀布尔)、柬埔寨(金边)尼泊尔(加德满都)、老挝(万象)、锡金(甘托克)、菲律宾(马尼拉)新加坡(新加坡)、马尔代夫(马累)、文莱(斯时巴加湾)、东帝汶(帝力)印度尼西亚(雅加达)、伊拉克(巴格达)、伊朗(德黑兰)、约旦(安曼)沙特阿拉伯(利雅德)、阿联酋(阿布扎比)、阿曼(马斯喀特)、科威特(科威特)以色列(特拉维夫)、也门(亚丁)、巴勒斯坦(耶路撒冷)、卡塔尔(多哈)巴林(麦纳麦)、叙利亚(大马士革)、黎巴嫩(贝鲁特)、蒙古(乌兰巴托)塞浦路斯(尼科西亚)、哈萨克斯坦(阿斯塔纳)、乌兹别克斯坦(塔什干)吉尔吉斯(比什凯克)、塔吉克斯坦(杜尚别)、土库曼斯坦(阿什哈巴德)阿塞拜疆(巴库)、格鲁吉亚(第比利斯)、亚美尼亚(埃里温)2、欧洲各国国名及首都英国(伦敦)、罗马尼亚(布加勒斯特)、法国(巴黎)、波兰(华沙)瑞士(伯尔尼)、瑞典(斯德哥尔摩)、意大利(罗马)、德国(柏林)摩纳哥(摩纳哥)、拉脱维亚(里加)、希腊(雅典)、阿尔巴尼亚(地拉那)挪威(奥斯陆)、南斯拉夫(贝尔格莱德)、保加利亚(索非亚)、荷兰(阿姆斯特丹)爱尔兰(都柏林)、捷克(布拉格)、斯洛伐克(布拉迪斯拉发)、葡萄牙(里斯本)斯洛文尼亚(卢布尔雅那)、土耳其(安卡拉)、马其顿(斯科普里)、克罗地亚(萨格勒布)梵蒂冈(梵蒂冈城)、比利时(布鲁塞尔)、马耳他(瓦莱塔)、丹麦(哥本哈根)卢森堡(卢森堡)、西班牙(马德里)、圣马力诺(圣马力诺)、匈牙利(布达佩斯)列支敦士登(瓦杜兹)、冰岛(雷克雅未克)、安道尔(安道尔)、芬兰(赫尔辛基)俄罗斯(莫斯科)、乌克兰(基辅)、白俄罗斯(明斯克)、法罗群岛(曹斯哈恩)摩尔多瓦(基希讷乌)、立陶宛(维尔纽斯)、爱沙尼亚(塔林)3、非洲各国国名及首都安哥拉(罗安达)、埃塞俄比亚(亚的斯亚贝巴)、埃及(开罗)、中非(班吉)几内亚(科纳克里)、几内亚比绍(比绍)、博茨瓦纳(哈博罗内)、布基纳法索(瓦加杜古)上沃尔特(瓦加杜古)、马达加斯加(塔那那利佛)、马里(巴马科)、马拉维(利隆圭)扎伊尔(金沙萨)、赤道几内亚(马拉博)、冈比亚(班珠尔)、贝宁(波多诺伏)毛里求斯(路易港)、毛里塔尼亚(努瓦克肖特)、乌干达(坎帕拉)、布隆迪(布琼布拉)卡奔达(卡奔达)、卢旺达(基加利)、乍得(恩贾梅纳)、尼日尔(尼亚美)。
雅思高分小作文总结
雅思 A 类 9 分小作文技巧分析
第一节 总体概括
IELTS Writing Task 1: summarize 一般性结构总结
A 类图标作文的写作结构 Introduction 1-2 句 题目改写: 3变1加 变词性,变位置,变同义,加信息。
Overview 1-2 句 Main Body 2 段
总结最重要的信息,或最重要的趋势。一般总结两个大的特点或趋 势。 总体趋势、特征 + 顺序逐句描述 数字信息+文字信息+ 比较趋势
(4)开始写作
3
雅思 A 类 9 分小作文技巧分析
第二节 首段
第一段 题目改写: 3变1加。变词性,变位置,变同义,加信息。
1. Example: The graphs below show the enrollments of overseas students and local students in Britain's university. Rewrite: the graphs give information about the proportion of overseas students and local students enrolled in Britain's universities from 1998 to 2008. 2. Example: The table below shows the proportion of different categories of families living in poverty in Australia in 1999.
雅思写作的小作文类型解析
雅思写作的小作文类型解析为了让大家高效备考雅思的小作文,下面小编给大家整理了雅思写作的小作文类型解析,希望对大家有所帮助。
雅思写作小作文类型有哪些雅思写作小作文类型一、表格图图表作文的写作要点1 横向比较。
介绍横向各个数据的不同之处,变化和趋势。
2 根本不需要把每一个数据进行分别说明,突出强调了数据值。
3 对比时还需要总结出数据对比比较悬殊的与比较小的。
雅思写作小作文类型二、曲线图图表作文的写作要点1 极点说明。
即,对于图表里比较高的与比较低的点要单独进行说明。
2 趋势说明。
即,对图表里曲线的连续变化进行说明,如上升,下降,波动,持平。
3 交点说明。
即,对图表里多根曲线的交点进行对比说明。
雅思写作小作文类型三、饼状图图表和柱状图作文的写作要点1 介绍各扇面还有总体的关系。
2 不同扇面之间的比较,同类扇面在不同时间与不同地点进行比较。
3 关键突出特点比较明显的扇面:大的与小的,互相成倍的。
雅思写作小作文类型四、综合图图表作文的写作要点1 不求甚解,不拘泥于细节。
2 分门别类,分段落详细介绍各个图表。
3 不画蛇添足,主观臆断又或是猜测图表之间的关系。
雅思写作A类小作文类型及特点简析小作文虽是写作考试的task 1,但是很多时候会建议总是把握不住考场时间的学生先写大作文再写小作文,这是一种考场策略,因为很多人跟我说,“老师,我写小作文的时候明明知道超过20分钟了,大作文时间要不够了,但是我就是强迫症,不把小作文写完就是不撒手...”先写大作文,即使超过一点时间写个45分钟,那剩余15分钟去写小作文,也总比小作文写个40分钟,剩下20分钟去“飞檐走壁”草草写完占写作分数2/3的大作文要好。
小作文的结构,通常是三部分:开头改写题目,表述图表主题;主体部分2-3段,把数据分组描述,对比比较;结尾部分总结概述。
图表作文的第一段非常简单,因为题目中的一段文字已经告诉我们图表说的是什么,只需要进行改写复述即可。
主体部分自然难一些,审题时要攫取关键信息,结合图表主题,根据一定的逻辑顺序进行分组,每一组写一段。
雅思小作文写作需注意事项
雅思小作文写作需注意事项雅思写作考试中,小作文主要是给出大家一个或者多个图表,要求大家根据所给出的信息进行描述。
想要在考试中拿到高分,我们就需要注意一些细节以及写作方法。
接下来小编为大家介绍一下雅思小作文写作需注意事项,一起来了解一下。
雅思小作文写作需注意事项今天这篇文章详细介绍了雅思小作文写作细节问题,只有当你真正的关注到这些小细节时,才有可能更好的拿到雅思小作文高分1、字数请控制在170-190 words啥叫Inforgraphic? Inforgraphic = information + graphic 把信息+图表转述成文字表达出来,就是task 1 的要求。
官方要求是150字,如果你真的无法控制在150字左右,那么请至少控制在170-190字。
2、不要写个人意见IELTS 是英语考试,不是智力测试,并不需要给出你的意见,分析,预测,意义等等。
即使你是相关方面的大牛,考官也不需要你的个人意见3、不要用 I, Me, We...等第一人称这是图表的信息,而不是你看到的“图表信息”。
直接用it 或者用chart来表达就好,千万不要说我怎样怎样。
4、小作文要写的简单粗暴任你妙笔生花,不如简单陈述。
这个不是写记叙文,没必要绕着弯的写,文章只需要你的用词够精准,句式够精炼。
所有的report不外如是。
5、Introduction只用两句话搞定只需要1-2句话,改写题目,1句话告诉别人这篇文章实在干啥。
所以说做一个标题党是很有必要的。
静静的做一个标题党吧!6、要注意找不同,差异点才是key point无论是哪种图表,一定要注意横纵坐标轴单位以及范围,指出最高点&最低点,如果是表格的话,标题是什么一定要说清楚。
比如说这样子的跌到谷底。
描写图表的时候不要以为每个点都说才是细节,挑重点才是王道,从小老师就教育我们不要写流水账,task1 也是一样,写成流水账是没人看的。
另外,如果是比较特殊的流程图,那么开始和结束是关键,其中的转折点或者关键步骤也是重点7、要趋势,不要流水账文章字数限制,说以要精简,要学会归类,找出趋势,用同一模式概括多个信息,不需要把不重要的信息逐一描述。
雅思写作小作文二
小作文精讲(一)-------柱状图(bar chart)migrant amphibian seaweed gorilla ocean river stream pool pond lakePest insecticide killer whale sperm whale terrestrial aquatic marine lifeEndanger habit habitat nutrient vegetation vegetarian threatenLog restrict=inhibit=restrain maintain territory territorial generateEmerge connect =depend on=lean on=count on erosion intact HR resource Source nurture nurse discard=abandon vital=important =significant =critical abundant =lush sustain overestimate underestimate preserve strip=depriveFracture hibernate hide+ber+nate decline=fall=reduce=depress legal illegalFragile reproduce 同位语require measure be sufficient toEnsure emphasis emphasize=highlight=stress expansion justified=reasonable Destination include exclude graduate postgraduate一写作思路及技巧1.看清横纵轴分别代表什么。
(多数都是纵轴代表百分比,横轴代表时间,年龄,频度等。
- 1、下载文档前请自行甄别文档内容的完整性,平台不提供额外的编辑、内容补充、找答案等附加服务。
- 2、"仅部分预览"的文档,不可在线预览部分如存在完整性等问题,可反馈申请退款(可完整预览的文档不适用该条件!)。
- 3、如文档侵犯您的权益,请联系客服反馈,我们会尽快为您处理(人工客服工作时间:9:00-18:30)。
小作文写作要点总结
第一步:确定图标的类型(到底是动态图标,还是静态图标)
1.动态图表75% 有两个时间或以上,可以描述趋势,动态图关注趋势+高低
2.静态图标25% 没有时间或者只有一个时间,关注描述对象的高低和对比对象的比较
第2步:确定时态(过去时,现在时,将来时)
1.判断方法:①从图中的时间判断;②从图表的标题判断;③从题目判断
2.大部分都是过去式
第3步:确定图表的主要信息(最高值,趋势,对比,数字特点)
描述对象:
1.动态图一般只有一描述对象,而时间不是描述对象
2.如果动态图有两组描述对象,国家,年龄段,性别依次是对比对象
3.静态图一般有两组描述现象
第4步:分段
第5步:阅读信息的顺序(从大到小)
第6步:确定对象词(描述对象)的准确性
第7步:写的时候注意句子结构的变化
第8步:句子之间要注意连接词
第9步:词性有没有变化,对象词的变化是否正确和合理
第10步:检查语法错误,确保不要犯错。