transCAD简单教程
transcad操作

Transcad操作一、导入路网,建立road层直接拖入处理好的底图点击ok-ok,命名road保存(save)检查交叉口tools-map editing-check line layer connectivity无问题,交叉口显示为黑色,继续下一步;有问题交叉口显示红色和绿色,需调底图。
二、导入area层命名area保存三、Road与area叠加单击road层,右键选择layers把图层重命名四、质心层操作切area层-tools-exportOk-命名为质心层切endpoints-dataview先添加质心层,再切质心层--tools--map editingSetting不变,fill如下切road出现数据表五、最短路矩阵-阻抗矩阵切road--procedures--network--create--保存为net(路网创建完成)。
切endpoints--dataview--selection--settings--add SetcloseSelection切road--networks--multiple pathsOk--保存spamat,得到六、分布预测导入pa表格,Excel要保存格式为97-2003版.xls才能导入。
导入后保存命名为OD。
Dataview--jion平衡pa--procedures--planning--blanceOk--save-blance阻抗矩阵ID转换,点击(spmat)矩阵表任意空白右键保存CGRAV七、分配预测把分部预测得到的转换ID(out matrix)--任意空白右键Window--tile--显示地图在最前面--切road层--planning--Ok--save-ASN-LINKFLOW生成流量图隐藏连接质心路段,selection by condition--条件填入Slection--settings八、导出OD表在output matrix中右键选择indicesOk--保存为txt格式--存为OD打开Excel--导入数据选择数据,下一步--下一步完成,插入第一行九、饱和度和流量图在road+ASN LINK FLOW--Dataview--column settings--选择AB-FLOW、BA-FLOW在Fomat选择12345即为整数。
TransCAD技巧图解教程
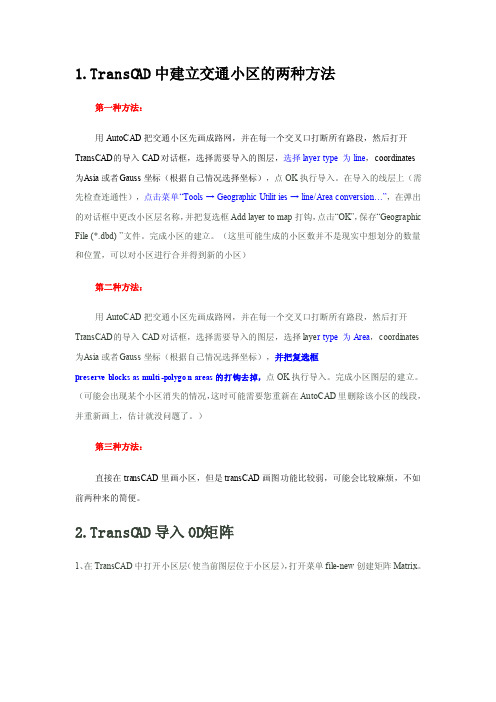
1.TransCA D中建立交通小区的两种方法第一种方法:用AutoCA D把交通小区先画成路网,并在每一个交叉口打断所有路段,然后打开Tra nsCAD的导入CAD对话框,选择需要导入的图层,选择layer type 为line,coordin ates为A sia或者G auss坐标(根据自己情况选择坐标),点OK执行导入。
在导入的线层上(需先检查连通性),点击菜单“Tools→Geograp hic Utiliti es→line/Area convers i on…”,在弹出的对话框中更改小区层名称,并把复选框Ad d layer to map打钩,点击“OK”,保存“Geograp hic File(*.dbd)”文件。
完成小区的建立。
(这里可能生成的小区数并不是现实中想划分的数量和位置,可以对小区进行合并得到新的小区)第二种方法:用AutoCA D把交通小区先画成路网,并在每一个交叉口打断所有路段,然后打开Tra nsCAD的导入CAD对话框,选择需要导入的图层,选择layer type 为Area,coordin ates 为A sia或者G auss坐标(根据自己情况选择坐标),并把复选框pr eserve blocksas multi-polygon areas的打钩去掉,点OK执行导入。
完成小区图层的建立。
(可能会出现某个小区消失的情况,这时可能需要您重新在Aut oCAD里删除该小区的线段,并重新画上,估计就没问题了。
)第三种方法:直接在tran sCAD里画小区,但是trans CAD画图功能比较弱,可能会比较麻烦,不如前两种来的简便。
2.TransCA D导入OD矩阵1、在TransC AD中打开小区层(使当前图层位于小区层),打开菜单fil e-new创建矩阵Matrix。
TransCAD操作流程
TransCAD交通分配操作流程及报告要求1. TransCAD交通分配操作流程1.1 新建路网文件。
新建线层地理文件(菜单File-New, 文件类型选Geographic File-Line Geographic File)。
在路网中的字段属性中一般包含道路名称、道路等级、车道数、通行能力、设计速度、小区连接线标志等属性。
将系统的单位设为m,cm。
修改比例尺为1:10000。
建立路网,选择菜单Tools-Map Editing-Toolbox,得到画图工具框。
建完路网后,打开线层Dataview文件,统一添加道路属性,并通过工具栏的Formula Field命令计算获得实际道路长度和行驶时间两个属性。
1.2 修改点层文件。
通过工具栏的Working layer将点层设为当前工作层。
打开点层的Dataview文件。
选择菜单Dataview-Modify Table,增加小区形心点类型(CentroidPoint)字段属性,类型设为Integer。
1.3建立交通小区文件(选择File-New, Geographic File-Area Geographic File)。
连接小区层与道路层(Tools-map editing-connect)。
适当调整小区连接线并对其添加通行能力等各项属性。
生成二进制路网(选择Networks/path-create)并通过最短路径工具检查路网的正确性。
1.4 以点层文件的形心点ID为基础生成OD表(在点层为当前层的基础上新建OD矩阵文件)。
前提条件:在节点文件中创建了形心点选择集。
1.5 进行交通分配(选择Planning-traffic assignment)。
准备工作:①最新的二进制路网文件;②完整的OD表;③将线层设为当前工作层。
在分配前,注意对话框中的小区形心点(Centroids)及分配选项(Option-Create Themes)进行设置。
2. TransCAD交通分配报告写作内容及要求课程设计报告可分为如下几部分:课程设计的目的及步骤说明。
第四章TransCAD快速入门

阶段1:创建公共汽车路线地图
构造Overlays(覆盖图)
– 从工具条上的层下拉列表中选择Service Areas – 选择Tools-Geographic Analysis-Overlay来显示Overla
y对话框
– 从Layer下拉列表中选择Flintbury Zones – 单击OK。TransCAD显示Save As(另存为)对话框 – 在你的硬盘上选择一个目录 – 输入“MYACCESS”作为文件名并单击Save
阶段1:准备输入
选择节点中的质心 – 选择Selection-Select by Condition
– 在Enter a Condition文本框中输入条件“Centroid<>null” – 在Set Name文本框中输入“Centroids” – 单击OK
打开OD流量矩阵
– – – – 选择File-Open 从Files of Type下拉列表中选择Matrix 从Tutorial目录中选择矩阵文件FL-OD.MTX 单击OK
阶段1:创建一个总览地图
改变分区风格 – 从工具条上的层下拉列表中选择FlintburyZones。 – 单击工具条上的 – 从Border Style下拉列表中选择一虚线 – 从Border Width下拉列表中选择1.5 – 从Border Color下拉列表中选择最上边的黑色; – 单击OK。
项目3:游行中关闭街道的影响
第一阶段 准备输入 打开地图 – 选择File-Open或单击工具条上的 – 从Tutorial文件夹中选择MYTRANS.MAP – 单击OK 清除Scaled-Symbol主题 – 从工具条上的层下拉列表中选择Flintbury Streets – 选择Map-Scaled Symbol Theme或单击工具条上的 – 单击Remove
TransCAD基本操作

练习:编辑线特性(1)
14/180
练习:编辑线特性(2)
单击 单击 ,然后添加两条新线,使这两条线首尾相连, 保存编辑。
单击 ,然后单击两条线的连接处,TransCAD将 把两条线合并成一条,原来的终点变成轮廓点,单 击 保存。 单击 ,然后单击一条线,TransCAD将这条线分成 两条,原来的轮廓点变为终点。 再次单击这点,TransCAD将使这两点分开
在地图编辑工具箱中单击 ,拖动一个点到一个新 的位置,TransCAD在原来的点上加×,在新的点 上添加空心的黑框。 点击 取消编辑。
选择File-Close,然后单击NO不作任何修改保存文 件
8/180
练习:编辑点特性
9/180
练习:编辑线特性(1)
选择File-New或单击图标 ,在New File选项中选择 Geographic File。TransCAD显示新建地理文件对话框。 单击Line Geographic File单选按钮,在Layer Name中 输入My Lines,单击Ok,再次单击Ok不作任何修改并 关闭New Table对话框。 以MyLines作为文件名保存,TransCAD显示包括My Lines层的地图。
40/180
练习:编辑面要素
41/180
练习:编辑面要素
点击 ,删除区域。
在地图编辑工具箱中点击 ,然后点击右上角的区域, 并点击区域的边缘拖动成一个新的形状。 单击 取消编辑,区域编成原始形状。
点击 ,然后点击下面的两个区域,TransCAD把将 删除的公共边变红显示。 点击 保存修改,TransCAD合并两个区域。
Experiment of Transport Planning
TRANSCAD教程三
TRANSCAD教程三TRANSCAD教程三在这篇教程中,我们将介绍一些TRANSCAD的基本功能和用法。
1.安装和打开软件:-打开TRANSCAD,进入主界面。
2.导入地理数据:-在主界面上,选择“文件”->“导入”->“地理数据”。
- 浏览文件系统,选择要导入的地理数据文件(如shapefile)。
-定义导入的数据类型、坐标系等参数。
-点击“导入”按钮,将地理数据导入TRANSCAD。
3.创建区域:-输入区域的名称和描述。
-定义区域的边界和范围。
-点击“确定”按钮,创建区域。
4.数据处理和分析:-在主界面上,选择“工具”->“数据处理和分析”。
-选择要进行的处理或分析任务,如缓冲区分析、网络分析等。
-输入相关参数和条件。
-点击“运行”按钮,开始处理或分析数据。
-在地图上绘制道路或公交线路,定义其属性和连接。
-点击“保存”按钮,保存网络。
6.可视化:-在主界面上,选择“可视化”->“地图”。
-选择要显示的地图图层,如道路、交通流量等。
-调整地图的样式和显示方式,如颜色、符号等。
-点击“应用”按钮,显示地图。
7.模型和模拟:-在主界面上,选择“模型”->“新模型”。
-选择要使用的模型类型,如交通仿真、交通运输模型等。
-输入相关参数和条件。
-点击“开始”按钮,运行模型或模拟。
8.报告和输出:-在主界面上,选择“文件”->“导出”。
- 选择要导出的输出格式,如PDF、Excel等。
-输入相关参数和条件。
-点击“导出”按钮,将结果导出为报告或输出文件。
这些是一些TRANSCAD的基本功能和用法,通过使用这些功能,您可以进行各种交通规划和分析任务。
请注意,TRANSCAD还提供了许多高级功能和工具,可以根据具体需求进行深入学习和使用。
transcad 操作过程
TransCAD交通规划实例作者:applepin◆启动TransCAD软件插入软件狗,启动TransCAD软件。
◆建立路段层点击新建文件图标,出现点击建立地理文件,点击OK,出现选择文件类型更改名字更改名字选中Line 层地理文件类型,并更改名字,点击OK,出现路段层属性对话框:点击Add Field,逐一增加字段属性点击OK,出现保存对话框:选择保存路径及文件名称点击Save,出现路段层地图界面添加路段在路段层上,点击Tools→map editing→toolbox出现地图编辑工具栏:点击,逐一增加路段保存得到7条线路、5个节点的路网。
输入路段属性数据打开路段层数据库:逐一输入路段属性数据(通行时间等于路段长度除以速度)建立小区层点击新建文件图标,出现点击建立地理文件,点击OK,出现点击OK,出现小区层属性对话框逐一添加小区的字段属性点击OK,出现保存对话框:起好名字,点击Save。
再次回到路段层地图界面。
画小区。
点击Tools→map editing→toolbox出现工具栏:画出3个小区,并保存。
输入小区属性数据打开小区层数据库输入各小区的属性数据将小区质心点连接到路网(目的是做ID转换)。
在节点层上,增加Index。
原先节点层上只有经纬度两个字段两个字段点击数据库菜单,修改数据库属性增加一个新字段Index在小区层上,点击Tools→Map Editing →Connect调出对话框:点击Fill,完成如下设置:点出OK,路网显示出已经连接,出现小区质心节点小区质心节点打开点层数据库,发现新的变化:打开路段层数据库,发现新的变化:填充连接后新增路段(质心连杆)的值。
增加的三个节点的Index 序号分别是小区号增加了6,7,8三个节点填充连接后新增路段的值将其通行能力设为无穷大(大数即可)的值,通行时间设为很小的值。
在点层上,做点的选择集。
点击Tools→Selection出现点选择工具栏:直接用鼠标点击数据库第一列位置,出现红色圆点,表示已经将Index的点选入选择集:建立网络。
transcad简单实例(入门必看)
交通规划实例作者:◆启动软件插入软件狗,启动软件。
◆建立路段层点击新建文件图标,出现点击建立地理文件,点击,出现选择更改更改选中层地理文件类型,并更改名字,点击,出现路段层属性对话框:点击,逐一增加字段属性点击,出现保存对话框:选择保存路径及文件名称点击,出现路段层地图界面添加路段在路段层上,点击→→出现地图编辑工具栏:点击,逐一增加路段保存得到7条线路、5个节点的路网。
输入路段属性数据打开路段层数据库:逐一输入路段属性数据(通行时间等于路段长度除以速度)建立小区层点击新建文件图标,出现点击建立地理文件,点击,出现点击,出现小区层属性对话框逐一添加小区的字段属性点击,出现保存对话框:起好名字,点击。
再次回到路段层地图界面。
画小区。
点击→→出现工具栏:画出3个小区,并保存。
打开小区层数据库输入各小区的属性数据将小区质心点连接到路网(目的是做转换)。
在节点层上,增加。
原先节点层上只有经纬度两个字段两个字段点击数据库菜单,修改数据库属性增加一个新字段在小区层上,点击→→调出对话框:点击,完成如下设置:点出,路网显示出已经连接,出现小区质心节点小区质心节点打开点层数据库,发现新的变化:增加的三个节点的序号分别是小区号增加了6,7,8三个节点打开路段层数据库,发现新的变化:填充连接后新增路段的值填充连接后新增路段(质心连杆)的值。
将其通行能力设为无穷大(大数即可)的值,通行时间设为很小的值。
在点层上,做点的选择集。
点击→出现点选择工具栏:直接用鼠标点击数据库第一列位置,出现红色圆点,表示已经将的点选入选择集:在路网层上,点击→调出创建网络对话框:将里的内容全选,连接后的路网将继承这些属性。
点,出现保存对话框起好名字,点击发现软件界面右边最下瑞已经出现建立路网的状态信息。
至此,路网创建完成! 交通分布阶段建立交通阻抗矩阵(在本简单例子中,是直接建立阻抗矩阵,而在实际中,则是根据建立好的网络,计算各节点之间的最短路,最小时间或费用等作为交通阻抗)在小区层上,点击新建文件图标,出现路网的状态信息选择新建矩阵文件,点击,出现起好文件名称,点击保存矩阵文件,出现一个空白矩阵输入各小区之间交通阻抗的数据(本例假设为费用)的平衡处理注意:如果不平衡,则在中进行.P,A不平3400 4200点击→选择平衡方法点击,出现保存平衡结果对话框:点击,出现运行结果点击,看到平衡结果平衡结果应用重力模型进行交通分布预测(本简单例子没有涉及到重力模型的标定,而是假设重力模型已经标定好,可以直接使用模型进行交通分布预测)点击→→出现应用重力模型的对话框,并完成相应的设置:选项:选项:选择选择选阻抗标定好的交通阻抗函点击,出现保存交通分布结果的对话框:起好名字,点击,出现运行结果:点击,出现运行结果点击,看到分布结果矩阵:交通分布结果交通分配阶段将矩阵的小区行列号转换成为小区质心节点行列号在交通分布中右键→出现对话框:点击,完成以下设置点击,再次回到索引对话框,选择新索引即可。
TRANSCAD教程一
TRANSCAD教程一TRANSCAD教程一1.TRANSCAD概述2.安装TRANSCAD3.创建交通网络在TRANSCAD中,交通网络是交通模拟和分析的基础。
创建交通网络的步骤如下:-在TRANSCAD菜单中,选择“文件”>“新建”>“交通网络”。
-输入交通网络名称和描述,选择坐标系,点击“确定”。
4.导入地理数据要使用TRANSCAD进行交通模拟和分析,首先需要导入地理数据,如道路网络、人口数据等。
可以通过以下步骤导入地理数据:-在TRANSCAD菜单中,选择“文件”>“导入”>“地理数据”。
-选择要导入的文件或文件夹,并设置导入参数。
-点击“确定”开始导入。
5.创建行程在进行交通模拟和分析之前,需要创建行程数据,即模拟的交通出行。
可以通过以下步骤创建行程:-在TRANSCAD菜单中,选择“文件”>“新建”>“行程数据”。
-输入行程数据名称和描述,选择行程类型和所属交通网络,点击“确定”。
6.分配行程行程分配是指将创建的行程数据分配给交通网络中的道路,以模拟交通流。
可以通过以下步骤分配行程:-在TRANSCAD菜单中,选择“行程”>“分配”>“交通网络”。
-选择要分配的行程数据和交通网络,设置分配参数,点击“确定”。
7.运行模拟器在分配行程后,可以运行TRANSCAD模拟器来模拟交通流。
可以通过以下步骤运行模拟器:-在TRANSCAD菜单中,选择“模拟器”>“设置”。
-设置模拟器参数,如模拟时间、时间步长等。
-点击“开始模拟”开始模拟交通流。
8.分析结果模拟完成后,可以对模拟结果进行各种分析。
TRANSCAD提供了许多工具和功能来帮助用户分析交通模拟结果,如交通量分析、行程时间分析、路段流量分析等。
9.优化交通系统在分析交通模拟结果的基础上,可以通过优化交通系统来改善交通流和减少拥堵。
TRANSCAD提供了多种优化工具和算法,如交通信号优化、路径选择优化等。
TRANSCAD操作步骤
TRANSCAD操作步骤1、在CAD中建立路网和小区路段用PL命令,并在交叉口处断开,其他地方不要断开;小区要闭合;图层要分清楚;保存为R12的dxf格式;2、导入到TransCAD中路网数据要检查:先建立网络(这个文件要随时更新),检查到错误节点一般在CAD中修改,少量的可以在TransCAD中修改;导入小区;3、道路属性输入道路根据CAD中的图层分类;车速、行程时间(小数类型)、通行能力(三个主要参数)——根据细化程度分车种输入,例子中只使用小汽车的属性;4、小区编号输入5、建立型心连杆这个过程要在线层和点层中新加元素,而且新的元素和久的元素无差别,要通过小区ID连接;型心连杆可以自动连接也可以手动添加;用最短路工具可以检查新建道路的连通性;我个人建议型心连杆的属性参照支路标准,不要给得太高(为了防止经过性交通流取道型心连杆,例如);将小区编号导入到节点的属性中,以备后用;6、计算阻抗矩阵可以使用时间张度等;7、现状OD模型校验(省略……)8、 OD分布计算小区未来发生和吸引量,并导入到TransCAD中;OD分布:需要打开阻抗矩阵,并且更改矩阵的索引;9、 OD的导入导出导出:保存为dbf格式;导入:10、期望线11、交通流量分配要打开需分配的OD矩阵;把矩阵的索引更改为节点的ID;有的时候它不会自己打开,要到文件夹中把结果找到;把两个表连接到一起,计算饱和度;画出流量图和饱和度图;12、基本完成我这个只是基本的过程,大家知道一个交通预测在TransCAD中的建模过程,希望对你们有一定的帮助。
- 1、下载文档前请自行甄别文档内容的完整性,平台不提供额外的编辑、内容补充、找答案等附加服务。
- 2、"仅部分预览"的文档,不可在线预览部分如存在完整性等问题,可反馈申请退款(可完整预览的文档不适用该条件!)。
- 3、如文档侵犯您的权益,请联系客服反馈,我们会尽快为您处理(人工客服工作时间:9:00-18:30)。
一、概况TransCAD系统是由美国Caliper公司开发的交通GIS软件,现已推出用于Windows平台的3.5版。
二、技术特性TransCAD软件把地理信息技术和交通规划技术较好地结合在一起,可以方便地对各类交通运输及相关数据进行存储、提取、分析和可视化。
由于采用先进的Windows环境及一系列最新的开发方法,使得软件具有较好的风格:先进的菜单界面、强大的图形功能、方便的工具栏、良好的开放性、多文档、多用户操作等等。
TransCAD与其它Windows应用程序相仿,对容量没有硬性限制,最大限度地发挥硬件能力。
运行环境为Windows 3.1及以上版本。
TransCAD 3.5为32位应用程序。
三、功能特性TransCAD主要包括5大功能:∙Windows下的、功能强大的地理信息系统;∙扩展数据模型,提供显示和处理交通数据的基本工具;∙汇集了极其丰富的交通分析过程;∙各式各样、数量巨大的交通、地理、人口统计数据;∙可以生成宏、嵌入、服务器应用及其他用户程序。
交通过程主要包括:∙网络和路径:生成、设置、路段方向、选定路段、转向工具箱、最短路、多路径、货郎担问题、网络分割、带宽设定等∙线路系统:线路服务、站点服务、线路编辑等∙规划:出行产生、吸引、平衡、快速反应模型、出行分布、交通分配等∙公交:网络生成、设置、最短路、网络阻抗计算等∙路线和逻辑分析:成本矩阵计算、货运路线计算与显示、弧最短路、指派问题、运输问题、货流配送、最小成本流、分区、聚类、设施定位等统计:报表、校正、模型估计、模型应用、生成模型文件、邻接矩阵、空间校准等TRANSCAD教程1-- Project and TransCAD OverviewORGANIZATIONLAB OBJECTIVESTo provide hands-on experience with transport planning, analysis, and design and t o present Geographical Information Systems (GIS) fundamentals.TERM PROJECTHomework assignments and the course project will utilize TransCAD, a PC-based GIS for transportation which is installed in the Civil Engineering Computer Lab in E G3141. A formal lab will be held every week; typically on Fridays but occasionally on Mondays and Wednesdays (a discussion section often may be held as part of t he lab). Individual copies of TransCAD are not available, but additional formal lab ti me will be scheduled as needed. TransCAD manuals will be available in the Lab, and may be checked out from the TA or the main CEE office. The course project will be completed individually (or perhaps in teams of 2). There will be intermediate reports due during the quarter, and a comprehensive final report will be due durin g exam week (tentatively, June 16, 2004). Incorporated into the final report will be one or more network design solutions. It is highly recommended that each person/t eam keep all project material in a 3-ring binder to facilitate management of projectdocumentation. All project reports must be prepared professionally. Given the import ance of technical writing in the Civil Engineering profession, each submitted project will receive two equally weighted grades: one for technical content, one for report quality. Formal report preparation guidelines are included in the course notes. Sam ple projects from prior years are available from the instructor or TA.LAB REFERENCES∙Caliper (1996) TransCAD User's Guide Version 4.0∙Additional material focusing on GIS will be available in the lab or on-line.∙Project Report Style GuideGRADINGLab works will account for 35% (30% on term project and 5% on unannounced qui zzes in lab) of the total course grade.SCHEDULESee Overall Course ScheduleINTRODUCTIONWhat is TransCAD?TransCAD is a full-featured Geographic Information System (GIS) designed specific ally for managing analyzing, and presenting data related to transportation systems and facilities. It contains a comprehensive set of transportation analysis models that are commonly used by transportation professionals in their daily work.What is a GIS?Different definitions of a GIS have been used in different disciplines. For the newco mers to GIS, consider this relatively simpler definition: A computer software designed to manage and display data that describe features on the Earth's surface. Examp les of such features with transportation relevance are: freeways, streets, bus routes, intersections, bus stops, etc.Why GIS for transportation system analysis?GIS make it possible to display and visualize phenomenon such as traffic. For exa mple, GIS can display on a map streets with various widths to represent different amount of traffic on these streets. In addition, GIS can be used to prepare data fo r analysis in ways not possible with traditional transportation modeling software.Fundamentals of GISTo be able to use TransCAD efficiently, it is necessary to understand some funda mentals of GIS. Two of the most important GIS concepts are introduced here to fa cilitate the understanding of the tutorial materials. More GIS concepts will be introd uced throughout the quarter.∙Maps are generated from a databaseAlthough GIS display maps, in most cases these maps are not stored in co mputers as image files. Maps are generated by GIS from a database withdifferent tables. For example, each node in the map (Figure 1) is generatedbased on the coordinates in the Nodes table (on the upper right hand side). Each street link is generated by linking the two end nodes (see the Highways/Streets table).∙Features are organized into layersA map can be regarded as a set of overlaying transparencies. Each transparency is drawn with one type of feature. For example, in Figure 1, the ma p consists of two layers: Nodes and Highways/Streets. Each layer is associated with a data table and each feature is linked to a record in the table.TransCAD TutorialSee page 15 to 23 of the TransCAD User's GuideFigure 1 Map and DatabaseThe Miasma Beach Transportation ModelThere are six Traffic Analysis Zones (TAZs) in Miasma Beach, and two external stations. Zones 1 and 2 are in the Central Business District (CBD), zone 3 is an urban residenTI Al area neighboring zone 4, zone 4 is a major commercial and industrial area about two miles east of the CBD, and zones 5 and 6 are suburban residential zones located about fi ve miles east of the CBD. Zones 7 and 8 are External Stations representing the eastern a nd western extremes of Coast Highway, the arterial which traverses the southern border of the City along the beach.The initial transportation network for the city comprises a grid of secondary-classified maj or arterials and a single primary arterial (Coast Highway). The six TAZs are attached by single 0.25 mile centroid connectors. Facility operating characteristics are detailed in Table 1.+---------------------------------------------------------------+| ^^^ ^^^ ^^^ Miasma Mountains ^^^ ^^^ ^^^ |+ N || 1st 2nd 3rd 4th 5th W+E || Str Str Str Str Str S || |+ 1-+----+-------+---------------+----+-5 Mountain || | | | Avenue || CBD |1 mi | 4 Urb.Res. | || | | | | Suburbs |+ 2-+----+-------+---+---+-------+-------+----+-6 Miasma || | | | Blvd || |1 mi 3-+ Comm/Ind | || | | | |+ 8----+---------------+---------------+----7 Coast || 0.5 2.0 2 mi 0.5 Highway || || Ext.Station Ocean Beaches Ext.Station |+ |+---+-------+-------+-------+-------+-------+-------+-------+---+Figure 1. City of Miasma Beach Network Schematic [Spring 2004]Table 1. Miasma Beach Speed-Capacity Table-----------------------------------------------------------------Link Type Speed Lanes Capacity/Lane -----------------------------------------------------------------1. Freeway 60 2 18003. Primary Arterial 45 2 9004. Secondary Arterial 30 1 6005. Local Street 15 1 3008. Ramp 30 1 6009. Centroid Connector 25 9 1000Task 1. VALIDATE 2004 BASE YEAR NETWORKYou are provided with two sets of TransCAD files, mb2004.*and Taz.*. The first, mb2004, contains the GIS layer of the coded transportation network; the second, Taz, contains the Traffic Analysis Zones (TAZ) layer and activity system data (demo graphics and trip ends). The first task is to create a map file in TransCAD and to validate the zone system and network structure.GIS ConceptsWhy are there so many files with the same file names, mb2004and Taz?To efficiently manage information pertaining to a layer, a GIS usually divides the in formation into different files. It takes all the files with the name of mb2004to gene rate the Miasma Beach network in TransCAD. If you want to work from a different directory or computer, you must copy the entire set of files.1.1 Create Base Miasma MapConstruct the TransCAD "map" file which contains the GIS data for the Base Year 2004 Transportation System T and the Activity System A.1.1.1Open a Geographic FileGo to File / Open. On the File Open dialog box, select the drive and directory wh ere you store your files (mb2004.*and Taz.*). Select Geographic File under the L ist Files of Type. You should see MB2004.DBD and TAZ.DBD in the file box. Sel ect MB2004.DBD and click OK.You should now see a "stick" network in front of you. The network does not contai n end points and intersecting points. To see them, go to Map / Layers. On the La yers dialog box, under Layers in Order of Display, select Nodes(it is hidden no w) and click the Show Layer button. Close this dialog box.Exercises:∙Change color and style of the streets∙Hide streets∙Label each street with ITS name (Hint: All you need is the Layers dialog B ox)1.1.2Add Another LayerGo to Map / Layer again. Click the Add Layer button. On the File Open box, op en the Geographic File of TAZ.DBD. You should now see the TAZ layer being add ed to your map but some parts of the TAZ layer seem to be displayed outside of the window. Go to Map / Scale. On the Map Scale dialog box, select Show the E ntire Layer of TAZ and Selection Set All Features.GIS ConceptsWorking Layer (or Current Layer)When you have more than one layers in your map, there is always one layer desi gnated as the Working Layer(or Current Layer). All the manipulations on the ma p (such as labeling or querying) apply to the working layer only.Exercises:∙Ask TransCAD to draw TAZs before the Highway/Streets network.(Hint: Move Up and Move Down in the Layers dialog Box) ∙Ask TransCAD to drop the streets from the map and add it back again (Hint: Drop Layer and Add Layer in the Layers dialog Box) ∙Label each TAZ with its ID and street with its name(Hint: switch the Working Layer between Highways/Streets and TAZ and lab el each layer)Examine the MapExamine the map and compare it with Figure 1. Familiarize yourself with this map and the characteristics of the various link, node, and zone attributes.1.1.3Save the MapAfter you set up the display of the map to the way you want (which should be lab eled properly), go to File / Save As. On the Save As dialog Box, select the drive and directory where you store your files. Select Map File under the List Files of Type. Type in MB2004under File Name for your map and click OK.GIS ConceptsWhat is a *.map file?A *.map file contains information about the settings of the map such as, what layers are in the map, the color and style of each layer, texts, labels, and freehand items (markers) on top of the map, and the scale of the map. It is important to know that the *.map file itself does not contain databases of the layers. It only tells TransCAD where are the dat abases and how to display them. Without the geographic files, the map file alone can not generate maps.1.2 Network UpdatesSelect Highways/Streets as the Working Layer. Implement all network changes identified b elow. Adjust the attributes for all links accordingly.1.Delete the section of Miasma Boulevard between 3rd and 4th Streets (over the Miasma wetlands)2.Delete the section of 2nd Street between Miasma Blvd. and Mountain Avenue.3.Add a section of 4th Street between Coast Highway and Miasma Blvd.4.Add a section of 3rd Street between Miasma Blvd. and Mountain Avenue.5.Due to recent development changes, the centroid of Zone 3 along with its connector have changed. Change the connector so that it connects with Coast Highway instead of 3rd St. It should meet the highway 1.5 miles from 1st St and 1.5 mile f rom 4th St.6.All Miasma network links are secondary arterials with the exception of:a.Mountain Ave from node 310 to 345 is a local streetb.3rd Street from Coast Highway to Miasma Blvd. is a local streetc.The entire length of Coast Highway is a primary arterial1.2.1Delete LinksTo delete a link, go to Tools / Map Editing. The Map Editing tool box will show up. Press down the Delete button and click at the link that is supposed to be deleted (see (1) in the description above). The color of the link would change and you should see the R ed Light and Green Light buttons appear in the Map Editing tool box. Carefully examin e if you click at the link that is supposed to be deleted, if you click at the wrong link, c lick the Red light button. The change will not be saved. If you are sure that you have th e right one, click the Green Light button. The change will be saved and you should see t he link being removed from the map.1.2.2Add LinksTo add a section of 4th Street between Coast Highway and Miasma Blvd, first click on t he Configure Settings button. Click on Update under the "Join/Split Attribute Settings." Change the "Choosen Options" to Copy for both joining and splitting for every field. Clic k on the midpoint of Coast Hwy between 3rd and 5th. This should split this segment to two 1 mile stretches. Click on the info tool (i.e. the i button in the Tools box) and click on Coast Hwy between 3rd and 4th. Change H_DIST from 2.00 to 1.00. Do the same editing for Coast Hwy between 4th and 5th. Press down the Add Line in Map Editing bo x and add a line from the intersection of 4th & Miasma Blvd to Coast Hwy (i.e., single click at the intersection of 4th and Miasma Blvd, drag the dash line straight to Coast Hw y, then double click when the line meets the splitting point). Click on the new line and f ill in each field the same value as that of 5th street, since they have the same length andare both secondary arterial. Follow the same procedure to add a section of 3rd Street bet ween Coast Highway and Miasma Blvd..2.3Move CentroidTo change the centroid location, first delete the centroid connector between the node of c entroid 3 and 3rd St. Press down the Join Line button and click on both links of 3rd St to join them into one. Ensure that the H_DIST of this combined link is 1.00. Using the same process as before, split the section of Coast Highway between 1st St and 3rd St. T he split should be located about 1.5 miles from 1st and 0.5 miles from 3rd, just below th e location of centroid 4. Then add a line from the split point to about 0.25 miles above t he split. Using the info tool, edit this new line so that it contains the same properties as the other centroid connectors. The new node at the end of this link will be assigned an ID by TransCAD (ie, 351.) Again using the info tool, change the number of this node to3. As this node is the centroid, it must be named to correspond with it's zone.1.2.4Edit Link AttributesTo change attributes of network links, use the info tool and follow the way you edit H_ DIST described above.1.3 TAZ UpdatesThe TAZ.* files contain information regarding the traffic analysis zones in Miasma Beach, including demographic data. The zonal information stored in this TransCAD network is i ncomplete, you must fill in a few entries. Set TAZ as your working layer, and open the dataview. For zone 2, change the POP (population) value from 0 to 1550. For zone 5, ch ange the EOTH (other employment) value from 0 to 50, and the ETOT (total employment) from 0 to 150. For Zone 6, change the Household Income from 3800 to 38,000.GIS ConceptsEditing in a GISA GIS usually does not let you undo the editing you do. This is because managing geogr aphic information is more complicated than managing just texts and numbers. To prevent users from changing the database accidentally, most GIS ask for your confirmation (such as the Red light and Green light buttons in TransCAD) before the change is saved. Spatial QueryA GIS let you retrieve information pertaining to a geographic entity on the map. This fun ction is sometimes referred to as Spatial Query. You can use the spatial query tools (suc h as the i button in the Tools box) to review and edit the entity's attribute data.1.4 Formulate AttributesAfter you finish editing the network, you need to calculate the free flow travel time for b oth directions of a street. It is easier to do this task in a Dataview (a table that displays data for the entire layer) than using the info tool, because you are now dealing with all streets, not just some of them. To open the Dataview of the Miasma network, make sure the Highways/Streets is the working layer. Click at the New Dataview button. A data wi ndow will show up. Examine the data. The attributes data shown in Highways/Streets data view should correspond to those in Table 1.GIS ConceptsLink DirectionIn the dataview of the Miasma network, Dir stands for direction and is used to indicate i f the street is one-way of two-way. In Miasma Beach,Dir link values are all 0 indicating that they are all two-way streets. Therefore, on the re cord (i.e., a row in the dataview) of a street, there are two fields correspond to one attrib ute (e.g., speed, capacity, or number of lanes). While AB_SPEED contains free flow spee d of one direction, BA_SPEED contains that of the opposite direction. This could be usef ul, for example, when each direction has different speed limit or capacity. To know whichdirection is AB and which is BA, you need to know the direction in which TransCAD draws this link. Look at the following example.Link 25 contains two end nodes, Node 310 and 320. If this link is drawn from 310 to 3 20, then Arrow 1 is AB and Arrow 2 is BA.Node 310 +------------------+ Node 320Link 25Arrow 1 ------------------->Arrow 2 <-------------------The direction a GIS draws a link is referred to as the topological direction of this link. This information exists internally in the database (e.g., somewhere in the MB2 001 files). If you want to see a link's topological direction in Dataview, set Highwa ys/Streets as the working layer and go to Dataview / Formulate Fields. On the F ormula (Dataview: Highways / Streets)dialog box, click at the Node Fields butto n. Another dialog box Node Formula Fields come up. Highlight ID under Choose one or more node fields and select "From" and "To"under Option. Click OK. You should see two fields, [From ID]and [To ID]being add to the dataview. [Fro m ID] is ID of the node from which the link begins and [To ID] is ID of the ending node.Exercises:How do you designate a link as a one way street? (Hint: 1 or -1 in Dir)To calculate the free flow speed for all the streets in the Miasma network, first go to Dataview / Modify Table. Click on Add Field button. Enter the followings under Field Information:1. Name: AB_TRAVEL_TIME2. Type: Real Number3. Width: 104. Decimals: 25. Uncheck the box in front of IndexClick the Add Field button again. Enter the following:1. Name: BA_TRAVEL_TIME2. Type: Real Number3. Width: 104. Decimals: 25. Uncheck the box in front of Index6. Click OK.You should now see two empty fields AB_TRAVEL_TIME and BA_TRAVEL_TIME being added to the dataview. Highlight AB_TRAVEL_TIME by clicking at its column heading. Go to Edit / Fill... . On the Fill dialog box, select option Formula. On t he Formula Box, build the following formula:(H_DIST / AB_SPEED) * 60Click OK on both the Formula and the Fill boxes. Note the values being filled in t he AB_TRAVEL_TIME field. Pick a few links and verify that the values are correct. Repeat the same procedure for BA_TRAVEL_TIME with the formula:(H_DIST / BA_SPEED) * 601.5 Enhance Miasma Map1.5.1Select Color ThemesWith the Highway/Streets layer active, follow TransCAD instructions (pg. 149-158) f or establishing the following link color themes:1. Freeway = Red 6. Local Street = Light Blue3. Primary Artl = Green 8. Freeway Ramp = Purple4. Secondary Artl = Blue 9. Cntrd Connector = Yellow Select line styles which will also distinguish link types.1.5.2Create LayoutFollow TransCAD instructions (pg. 34-36) to create a layout combining maps and d ata views. Attach appropriate legends and other enhancements.1.6 Print Miasma MapAfter you have verified that your network is correct, print the final map layers and generate reports documenting all data for inclusion in the interim report.1.7 Prepare Task 1 DocumentationPrepare Task 1 documentation, including all TransCAD maps and dataviews. Follow all Project Report Style Guidelines in the preparation of this documentation. This material will be submitted as part of the first Interim Report(see Task 3).The Miasma Beach Transportation ModelTask 2. DEVELOP 2004 BASE YEAR TransCAD NETWORK and SKIMSThe objective of this task is to create a TransCAD network file that will convert the GIS information that represents the Transportation System T into a form suitable for subseque nt transportation analysis. The first such analysis task will be to use TransCAD to find minimum path trees for all Miasma Beach centroids (internal zones and exterrnal stations).2.1 Create TransCAD Network FileSet the Highway/Streets layer as the Working Layer. If you don't see Networks/Paths in your menu bar (on top of the TransCAD window), go to Procedures and check it. If you can see it, go to Networks/Paths / Create... . Create links from: Entire line layer. Rea d length from H_DIST, and choose all link attributes under Optional fields(highlight all fields by clicking on the first field and the last field, while holding the "Shift" key on t he keyboard). Save this file as .2.2 Develop 2004 Base Year SKIM Trees with TransCADThree steps are required. First, the actual Interzonal minimum paths are computed. Intrazo nal travel times cannot be computed directly from the network, thus, a second step involv es approximating these times from interzonal times to neighboring zones. Finally, terminal times are optionally appended to selected zone pairs.Produce a minimum tree schematic for at least one centroid. These schematics will help i dentify any network errors; if any are found, correct them immediately (and repeat earlier tasks as necessary). A sample network tree is in Figure 2.+---------------------------------------------------------------+| ----- link is on minimum path tree N |+ ..... link is NOT on minimum path tree W+E || S || || |+ 1-+----+ . . . + . . . . . . . +----+-5 || | . | || | 4 . | || | | . | |+ 2-+----+-------+---+ . + + . . . +----+-6 || | . | | || | 3 . | | || +-+ | | . | | |+ |8|---+-----------+---+-------+-------+----7 || +-+ || |+-------+-------+-------+-------+-------+-------+-------+-------+Figure 2. Minimum Path Tree for Centroid #82.2.1Create Interzonal Skim TreesSelect network centroids to skim and compute shortest path trees.Select centroidsSet Nodes as the Working Layer. Go to Tools / Selection. Add a selection set by clickin g at the "+" button, then click the "Selection Settings" button. Select your new selection, then click on Remane...Enter Centroids as the new name of this selection. Then, click a t the "Select by Pointing" button on the vertical tool box (the one on the right hand side of the window). You then can click on each of the centroids while pressing down the S hift key on your keyboard (selected nodes will be highlighted).Find Skim TreeMake sure Nodes is the Working Layer and is the active network. Go to Ne tworks/Paths / Multiple Paths. Minimize: Travel Time. From: Centroids. To: Centroids. Select Matrix File as an output option (total cost of each path is stored in a matrix file). Click OK and save resultant file as time.mtx.2.2.2Append Intrazonal ImpedancesCompute the average travel time to the two zones nearest in skim time to the zone in question. Use one half this average as the intrazonal time (diagonal elements). Manually ente r these numbers into the diagonal cells of the matrix created in 2.2.1.2.2.3Update Skim Trees with Terminal TimesOnce you finish step 2.2.2, you have a matrix of Shortest Path with values in the diagon al cells. In this task, you are going to add 1 minute "terminal time" to each interzonal (o ff-diagonal) element. To do this, Go to File / New / Matrix file and click OK. Fill name as Terminal time, IDs are in ID, Rows from centroids, Columns from centroids, then click OK. Save the file as terminal.mtx. A matrix window will appear. Go to Matrix / Fill. In the subsequent dialog box, open the "Single Value" tab, and fill in the following:Go to Matrix / Fill again. This time fill the following under the "Single Value" tab:Go to File / New / Matrix file and click OK. Name this new matrix Skimtree.mtx. IDs are in ID, and both rows and colums are from Centroids. Label this matrix Skim tree. Return to Matrix / Fill. This time click onto the "Cell by Cell" tab. Fill the following:This last file is required for subsequent modeling and corresponds to free-flow travel time between all origin-destination pairs as computed from link distances and input free-flow s peeds. Once volumes are loaded on the network, congested travel times may be computed.2.3 Report Skim TreesAfter skim trees have been generated, plot the trees for each centroid to error check your network data. Report the resulting centroid-to-centroid free flow travel time table.2.4 Prepare Task 2 DocumentationPrepare Task 2 documentation, including all TransCAD maps and dataviews. Follow all Pr oject Report Style Guidelines in the preparation of this documentation. This material will be submitted as part of the first Interim Report(see Task 2.5).2.5 Submit Project Interim Report for Tasks 1 and 2Submit a Project Interim Report incorporating Interim Reports for Tasks 1 and 2. Includ e a cover letter describing you submission. Follow all Project Report Style Guidelines in t he preparation of this interim report.This and subsequent Project Reports will incorporate prior Project Interim Reports, possibl y reflecting additions and corrections based on prior review and grading. Each submission must include a cover letter and an updated Table of Contents. You will be graded for o nly the new material unless you indicate in the cover letter that you are requesting to re-s ubmit earlier reports.。