考研英语图表类作文模板
考研外语二作文万能模板

考研外语二作文万能模板一、图表作文。
开头段,描述图表内容,引出主题。
According to the chart/table, we can see that…。
As is shown in the diagram…。
The chart/table provides some interesting data/statistics about…。
The diagram illustrates the changes in…over the period from…to…。
The table shows the comparison between…in terms of…。
主体段1,分析数据变化原因。
There are several reasons accounting for this phenomenon. First and foremost,…。
Another contributing factor is that…。
Moreover, the rapid development of…also plays a significant role in…。
In addition, the change in…can be attributed to…。
主体段2,进一步分析数据变化原因。
Furthermore, it should be noted that…。
In addition, the improvement in…is another factor that leads to…。
Besides, the increase/decrease in…can be explained by the fact that…。
结尾段,总结图表内容,提出建议或展望未来。
In conclusion, from the above analysis, we can draw the conclusion that…。
考研图表英文作文

考研图表英文作文1. What does the chart show?The chart illustrates the percentage of people who own smartphones in different age groups. It is divided into five age categories, ranging from 18 to 65 years old.2. What is the general trend in smartphone ownership?The general trend in smartphone ownership is that the younger the age group, the higher the percentage of people who own smartphones. For example, the 18-24 age group has the highest percentage of smartphone ownership at 95%, while the 55-65 age group has the lowest at 61%.3. Are there any exceptions to the trend?Yes, there are some exceptions to the trend. In the 45-54 age group, the percentage of smartphone ownership is higher than in the 35-44 age group. This could be due to avariety of factors, such as increased access to technologyor changes in work and social habits.4. What do you think are the reasons for the trend?There are several reasons for the trend of higher smartphone ownership in younger age groups. One reason is that younger people are more likely to be early adopters of new technology. Additionally, smartphones are often seen as a status symbol among young people, and they may be more likely to prioritize purchasing one over other expenses. Finally, younger people tend to be more tech-savvy and may be more likely to use their smartphones for a variety of purposes, such as social media and entertainment.5. Do you think the trend will continue in the future?It is likely that the trend of higher smartphone ownership in younger age groups will continue in the future. As technology continues to advance and become moreintegrated into daily life, younger people will likely continue to be early adopters and prioritize technology intheir spending. However, it is also possible that as older generations become more comfortable with technology, the gap between age groups may begin to narrow.。
英文考研作文图表
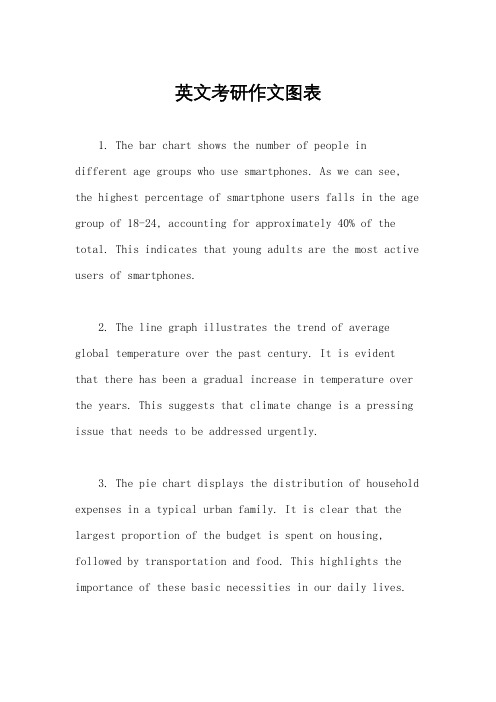
英文考研作文图表1. The bar chart shows the number of people indifferent age groups who use smartphones. As we can see, the highest percentage of smartphone users falls in the age group of 18-24, accounting for approximately 40% of the total. This indicates that young adults are the most active users of smartphones.2. The line graph illustrates the trend of average global temperature over the past century. It is evidentthat there has been a gradual increase in temperature over the years. This suggests that climate change is a pressing issue that needs to be addressed urgently.3. The pie chart displays the distribution of household expenses in a typical urban family. It is clear that the largest proportion of the budget is spent on housing, followed by transportation and food. This highlights the importance of these basic necessities in our daily lives.4. The scatter plot depicts the relationship between hours spent studying and exam scores. Interestingly, there seems to be no clear correlation between the two variables. This suggests that factors other than studying time may influence academic performance.5. The table presents data on the top five countries with the highest GDP growth rates in the past year. It is notable that all of these countries are emerging economies. This demonstrates their potential for rapid economic development.6. The line graph shows the fluctuation in oil prices over a five-year period. It is evident that there have been significant fluctuations in prices, with a sharp increase in 2014 followed by a gradual decline. This indicates the volatility of the oil market.7. The bar chart compares the literacy rates of different countries. It is clear that developed countries have higher literacy rates than developing countries. This highlights the importance of education in promoting socialand economic development.8. The pie chart illustrates the distribution of online shopping preferences by product category. It is evidentthat electronics and clothing are the most popular categories, while books and groceries are less commonly purchased online. This reflects changing consumer behaviorin the digital age.9. The scatter plot displays the relationship between income and happiness levels. Surprisingly, there seems tobe a weak correlation between the two variables. This suggests that factors other than financial well-being contribute to overall happiness.10. The table presents data on the number ofinternational tourists visiting different countries. It is evident that France attracts the highest number of tourists, followed by Spain and the United States. This highlightsthe popularity of these destinations among travelers.。
2024考研英语一作文模板全套
2024考研英语一作文模板全套一、图表作文。
Nowadays, with the rapid development of economy, the issue of (图表中的主题) has aroused wide concern in the society. According to the (图表名称) provided by (提供数据的机构), it can be seen that (图表内容的简单描述). From the data, we can draw the conclusion that (得出的结论).There are several reasons behind this phenomenon. Firstly, (原因一). Secondly, (原因二). Last but not least, (原因三).To solve this problem, I think the government should take effective measures. On the one hand, (解决这一问题的建议一). On the other hand, (解决这一问题的建议二). Only in this way can we (解决这一问题的效果).In conclusion, (总结的观点). As long as we take these measures, we can successfully (得出的结论).二、观点对比类作文。
Nowadays, (话题) has been the focus of the society. Some people hold the view that (观点一), while others argue that (观点二). As for me, I am in favor of the former/latter view.Those who support (观点一) have their reasons. Firstly, (理由一). Secondly, (理由二). What's more, (理由三).On the other hand, those who advocate (观点二) also have their reasons. Firstly, (理由一). Secondly, (理由二). What's more, (理由三).In my opinion, (个人观点). On the one hand, (理由一). On the other hand, (理由二). Therefore, I firmly support the view that (个人观点).In conclusion, (总结观点). As long as we take these measures, we can successfully (得出的结论).三、图画作文。
2023年考研英语一作文范文(精选6篇)
2023年考研英语一作文范文(精选6篇)2023年考研英语一作文篇1一、不同体裁(一)图表类1.开头句:As is vividly shown/described/depicted inthe picture,______________(图表总内容).From the graph/chart/table/pie/bar, we knowthat______________(图表总内容).2.具体描述:In the first/second/left right cartoon,______________ (单个图表内容).As is shown in the second drawing,______________ (单个图表内容).On the one hand, the picture tells us that______________(单个图表内容); On the other hand, the other one informs us that______________(单个图表内容).3. 结尾句:It is safe to draw the conclusion that______________ (结论).It can easily be seen that______________ (结论).(二)说明类1. Some people are in favor of the ideathat______________ (话题). They point out the fact that______________ (正方观点1).They also argue that_________________ (正方观点2). There might be some element of truth in these people’s belief. However, other people stand on a different ground since they consider it harmful to do so. They firmly point out that______________ (反方观点).2. Recently the issue of whether or not_________________(话题) has been in the limelight and has aroused wide concern in the public. There are two major arguments that can be made for. For one thing, the obvious advantage is that______________ (优点1). For another, it is widely hold that people usually when______________ (优点2). But we must not lose sight of the fact that there are still some drawbacks, one of which is that______________ (缺点1).二、不同题材1.保护环境Though being a little exaggerating, the picture illuminates a serious fact that ______________.And for that matter, a recent report also supported this viewby_____________. On the contrary, we are sad to perceive that _____________. Therefore, in my opinion, it is already high time for the whole world to form a solid cooperation fighting against _____________, because not a single government or person can be exempt from its harm. A series of down-to-earth measures need to be urgently implemented to control _____________.2.人口增长The picture depicts a scene in which_____________. The scene is presented in an artistic and ironic manner. Crowds of people are crammed in_____________. Further examination reveals that_____________. Apparently, the picture symbolizes that humans, with such a huge population, may one day suffer from the exhaustion of earth resources.Take_____________for example. Given the fact that _____________, we find that _____________. To make things worse,_____________. If the conflict between population boom and shortage of resources is not properly controlled, we have every reasonto hold a pessimistic perspective towards human’s future on Earth. Perhaps eventually we would face the situation suggested by the picture, that is,_____________. Accordingly, I strongly recommend that the whole globe launch aggressive programs to address this fatal contradiction.3.身体健康The picture_____________. What is strikingly noticeable is _____________ , but it can be easily explainedby_____________shown in the picture. The unhealthiness discloses a prevalent phenomenon that has long existed in the China. One the one hand,_____________. On the other hand,_____________. As a result, the integration of poor living conditions and work pressure leads naturally to theirpoor health and short life-span, just as the picture tells us. The situation is rather depressing because_____________, and it is largely owing to_____________. To solve the problem, I think there should be a thriving social trend_____________, and those who_____________should be rewarded with good living and working conditions.2023年考研英语一作文篇2一、正面话题模板:As is shown above, in the middle of the cartoon stands + 主题词,which symbolizes + 主题词的另一种表达,+ 同位语即主题词第三种表达 + 表示主题词动作的非谓语动词 (例如:in the middle of the cartoon stands a hot pot,which symbolizes culture,the one containing many Chinese culture symbol. The drawer"s intention seems to be highly self-evident and the meaning causes us to be thought-provoking. It is therefore safe to draw the conclusion that + 主题词 + is momentous and fundamental to the mind what food is vital and significant to the body.)Not only I, but also the best philosophers and poets also praise that this concept should be a permanent universal values. Obviously, I can think of no better reasons for the phenomenon other than the following two. Initially, the millennia-long run of + 主题词+ left us with a lot of traditions that are extremely profoundly rooted. 加拓展句:主题词is a kind of emotional strength, which can support us no matter how dark around us becomes.(比如:爱心/自信/亲情/团结/坚持/诚信/友谊/乐观的态度/是一种情感的力量,无论我们周围有多么的黑暗,它都能支持我们。
考研英语一作文模板
考研英语一作文模板一、图表作文。
Recently, there has been a heated discussion about the issue of (图表中的现象). (图表所反映的情况) has been on the rise/fall in recent years. According to the statistics shown in the chart, there has been a dramatic increase/decrease in (图表中的数据) from (具体数字) to (具体数字) during the period from (具体时间) to (具体时间).The reasons for this phenomenon can be various. On the one hand, (理由一). On the other hand, (理由二). In addition, (理由三). All these factors contribute to the change shown in the chart.In my opinion, we should take effective measures to deal with this issue. Firstly, (解决办法一). Secondly, (解决办法二). Only by doing so can we (解决问题所带来的好处).二、观点对比型作文。
When it comes to the issue of (观点对比的话题), people's opinions vary. Some people believe that (观点一). They argue that (支持观点一的理由). On the other hand, there are also people who hold the opposite view. They think that (观点二). Their reasons are that (支持观点二的理由).From my point of view, I tend to agree with the latter opinion. The reasons are as follows. Firstly, (支持观点二的原因一). Secondly, (支持观点二的原因二). In addition, (支持观点二的原因三). All these factors lead me to the conclusion that (你的观点).In conclusion, although different people have different opinions on this issue, I believe that (你的观点).三、问题解决型作文。
研究生英语图表作文模版
研究生英语图表作文模版In recent years, an increasing number of postgraduate students have been enrolled in universities worldwide. This trend can be clearly seen from the bar chart provided.As can be observed, the number of postgraduate students has steadily risen between 2010 and 2019. In 2010, there were approximately 8 million individuals pursuing postgraduate degrees. Over the next five years, this figure experienced a slight increase to around 9 million. However, from 2015 onwards, there was a remarkable surge in the number of postgraduate students, reaching a peak of nearly 14 million in 2019.Breaking down the data further, it becomes evident that the majority of postgraduate students are enrolled in Asian universities. In 2010, Asia accounted for around 40% of the total postgraduate student population worldwide, surpassing both Europe and North America. However, the gap between Asia and other regions dramatically widened over the years. By 2019, Asia was home to more than 60% of all postgraduate students, while Europe and North America trailed far behind.Furthermore, when examining the distribution of postgraduate students by field of study, it is apparent that social sciences, business, and engineering dominate. These three disciplines consistently attract the largest number of postgraduate students throughout the years. In 2019, approximately 35% of postgraduate students were studying social sciences, followed closely by business with 30% and engineering with 25%.In conclusion, the number of postgraduate students has witnessed a significant increase in the past decade, especially in Asian universities. Social sciences, business, and engineering emerged as the most popular areas of study for postgraduate students. Overall, this data highlights the growing preference among individuals to pursue further education beyond undergraduate degrees.。
考研英语一的作文万能模板
考研英语一的作文万能模板一、图表作文。
Nowadays, with the rapid development of economy, the issue of (图表中的主题) has aroused wide concern in the public. According to the chart, we can see that (图表内容简要描述). From the data given, we can draw the conclusion that (结论). There are several reasons for this phenomenon.Firstly, (原因一). Secondly, (原因二). Moreover, (原因三). Therefore, it is high time that we took effective measures to solve the problem.To begin with, the government should make strict laws to limit (解决方法一). In addition, individuals should enhance their awareness of (解决方法二), and try to adopt a more environmentally friendly lifestyle. Only in this way can we build a harmonious society.In conclusion, (结论重述). Only when we take these measures can we solve the problem and achieve sustainable development.二、观点对比型作文。
Nowadays, there is a growing concern over the issue of (话题). Some people believe that (观点一), while others argue that (观点二). As for me, I agree with the former/latter point of view.Those who support the former point of view have their reasons. First of all, (理由一). In addition, (理由二). Therefore, it is reasonable to believe that (观点一).On the other hand, those who support the latter point of view also have their reasons. For one thing, (理由一). For another, (理由二). Therefore, it is reasonable to believe that (观点二).In my opinion, (个人观点). The reason is that (原因). Therefore, it is high time that we took effective measures to (解决方法).In conclusion, (结论重述). Only when we take these measures can we solve the problem and achieve sustainable development.三、利弊对比型作文。
考研英语图表作文范例50篇(9篇)
考研英语图表作文范例50篇(9篇)在学习培训、工作中或日常生活,大家都难以避免地会触碰到作文吧。
尤其是在其中的话题作文,也是普遍,话题作文的主题风格无须从原材料中提炼出,只是从话题讨论引起出去的,原材料的功效取决于阐发话题讨论,启迪学生作文构思,就原材料自身来讲,既能够应用到创作中,还可以不用选用。
下边是我为大伙儿搜集的考研英语图表作文案例50篇【优选9篇】下边是我为大伙儿搜集的,仅作参考,期待可以协助到大伙儿。
If the salinity of ocean waters is analyzed, it is found to vary only slightly from place to place. Nevertheless, some of these small changes are important. There are three basic processes that cause a change in oceanic salinity. One of these is the subtraction of water from the ocean by means of evaporation--- conversion of liquid water to water vapor. In this manner the salinity is increased, since the salts stay behind. If this is carried to the extreme, of course, white crystals of salt would be left behind.The opposite of evaporation is precipitation, such as rain, by which water is added to the ocean. Here the ocean is being diluted so that the salinity is decreased. This may occur in areas of high rainfall or in coastal regions where rivers flow into the ocean. Thus salinity may be increased by the subtraction of water by evaporation, or decreased by the addition of fresh water by precipitation or runoff.Normally, in tropical regions where the sun is very strong, the ocean salinity is somewhat higher than it is in other parts of the world where there is not as much evaporation. Similarly, in coastal regions where rivers dilute the sea, salinity is somewhat lower than in other oceanic areas.A third process by which salinity may be altered is associated with the formation and melting of sea ice. When sea water is frozen, thedissolved materials are left behind. In this manner, sea water directly materials are left behind. In this manner, sea water directly beneath freshly formed sea ice has a higher salinity than it did before the ice appeared. Of course, when this ice melts, it will tend to decrease the salinity of the surrounding water.In the Weddell Sea Antarctica, the densest water in the oceans is formed as a result of this freezing process, which increases the salinity of cold water. This heavy water sinks and is found in the deeper portions of the oceans of the world.英文很重要,不只是在初试中,在复试中,针对名牌大学而言,通常便是一个挑选的副本,针对同等学力同学们而言更是如此,而英语中,作文充分体现你的综合能力了,因此大伙儿要提升自己的作文涵养,借着也有時间要多多的勤奋,下边就从2个层面来谈一谈这个问题。
英语饼图作文万能模板考研
英语饼图作文万能模板考研图表作文是考研英语写作的一个重要趋势,如果能找到一个这样的考研英语图表作文模板,那么对考生来讲备考时间可以大大缩短,同时有了考研英语图表作文模板,考生也能够更轻松的写好作文通过考试。
下面就是小编为大家搜集的一些考研英语图表作文万能模版。
考研英语图表作文模板 1The chart gives us an overall picture of the ____________(图表主题). The first thing we notice is that_______________(图表最大特点). This means that as __________,_________________(进一步说明).We can see from the statistics given that _______________(图表细节一). After ving_________(细节一中的第一个变化), the_____Ved+幅度+时间(紧跟着的变化). The figures also tells us that_________________________(图表细节二). (数据位置,如In the second column), we can see that ____________accounts for _______(进一步描述).Judging from these figures, we can draw the conclusionthat___________(结论). The reason for this, as far as I am concerned is that_____________(给出原因). / It is high time that we Ved(发出倡议)考研英语图表作文模板2第一段(一升一降一不变,一缓慢)What a thought-provoking and illuminating chart it is! As is apparently depicted in the chart, it is obvious that(内容)soared from(数据)in(年份) to(数据) in(年份), While, as a sharp contrast, (内容)decreased from(数据)in(年份) to(数据) in(年份).In addition ,(内容)was almost the same in(年份)and(年份)./(there was only a slow increase from(数据)in(年份) to(数据) in(年份))第二段(解释具体原因)Why does this phenomenon revealed in the chart above appear? Several reasons accounting for the situation can be what follows. To begin with ,I am strongly convinced that this is partly duo to the fact that(原因一), In addition, this is partly because ,(原因二), Last but not least,this is partly because(原因三). Maybe there are some other reasons bring about this phenomenon. But it is generally believed that the above mentioned reasons are commonly acceptable.第三段(发表个人观点)From the analyses made above , we may come to the conclusion that(结论). I am sure my opinion is both sound andwell-grounded.考研英语图表作文模板3This illustration depicts_________ (图画中的人物)Ving,with______________(补充说明). Recently it has become common for people in many walks of life to_____________(进一步阐释) It seems to me that the cartoonist is sending a message about _______(图画主题), which is ______________(进一步的说明). He seems to be saying that_______________(给出细节). In my opinion, ___________(个人阐述).This simple picture is a wake up call for ______(所涉群体,如the whole of the human race). Therefore, it is imperative for us to take drastic measures to put an end to_____________(问题所在). One the one hand, we must_________________(建议一). It is clear that the drawer of the illustration is urging us to _________(进一步说明). On the other hand, ________________(建议二) Only in this way can we___________(展望前景).考研英语图表作文4Recently the issue of whether or not______(讨论话题) has been in the limelight and has aroused wide concern in the public. There are two major arguments that can be made for_________. For one thing, __________can bring ____ to_____________(优点一). For another, it is widely hold that people usually ____when ________________________________(优点二).But we must not lose sight of the fact that there are also drawbacks to__________, among which are ____________(列举缺点). For instance, it can be __________to _____________(举例说明). In addition, many people find it ________(形容词)to _______________(第二个缺点)When asked to __________, I tend to ____________. This is because I _______________(原因一). Furthermore,_______________________(原因二). Finally, ______________(原因三).考研英语图表作文5With the rapid advances of _____________ in recent years,___has____________(引出现象). However, _______has________________, as____________(提出问题). As a result, _____has ____________________(指出影响).The effects ___________ has produced on____________ can be boiled down to two major ones.First , __________________(影响一). More importantly,________________(影响二). Hence, I believe that we will see a ____________(提出展望)/ Nevertheless, I do not think we will see a ______(或反面展望)There are numerous reasons why ____, and I would like to explore a few of the most important ones here. The first is that themore(比较级)_____, the more (比较级). In addition, we all agree that________________________(第二个原因)。
- 1、下载文档前请自行甄别文档内容的完整性,平台不提供额外的编辑、内容补充、找答案等附加服务。
- 2、"仅部分预览"的文档,不可在线预览部分如存在完整性等问题,可反馈申请退款(可完整预览的文档不适用该条件!)。
- 3、如文档侵犯您的权益,请联系客服反馈,我们会尽快为您处理(人工客服工作时间:9:00-18:30)。
考研英语图表类作文模板
图标类的作文应该怎么写比较合适呢?以下是小编整理的考研英语图表类作文,欢迎参考阅读!
考研英语图表类作文模板1 From the table chart given above, we can observe that it reflects the statistics of students’graduation intentions. From 2004 to 2012, the proportion of students who were determined to further study increased rapidly from 45% to 76%. During the same period, the percentage of students who were willing to work after graduation remains steady, around 55% to 60%.
The table chart informs us of the phenomenon that students in increasing numbers are willing to further study after graduation. What exactly contributes to this phenomenon? Reasons can be listed as follows: for one thing, faced with intense competition in the society, quite a few students are convinced that a higher education will put them in a competitive position in the future employment market. For another, their decision could also be attributed to the power of so-called “group dynamics”: when their friends and classmates choose to study after graduation, they will be influenced easily and imitate other’s behavior.
By observing the tendency of the past, we may forecast that the proportion of further study will continue to rise. However, students should bear in mind that a higher education will not guarantee them an ideal job. It is capabilities and skills that determine their future.
考研英语图表类作文模板2 The pie charts inform us of the phenomenon that there exists some difference in the sources of income between American and Chinese students. When it comes to American。