worldview3辐射定标的使用方法
worldview-3 的绝对辐射定标系数
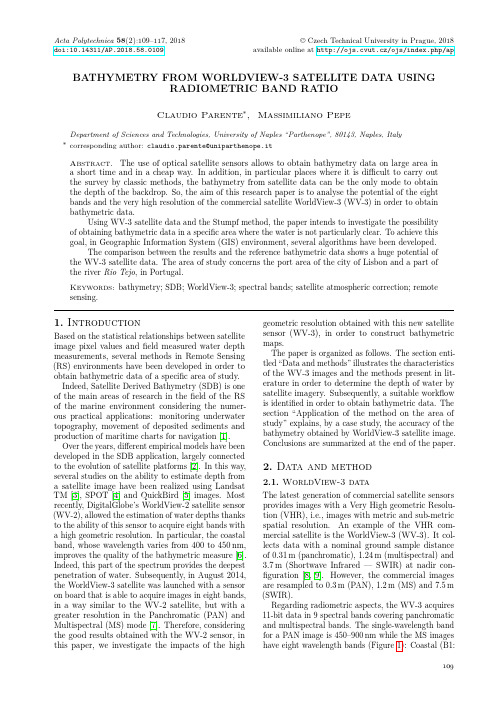
Indeed, Satellite Derived Bathymetry (SDB) is one of the main areas of research in the field of the RS of the marine environment considering the numerous practical applications: monitoring underwater topography, movement of deposited sediments and production of maritime charts for navigation [1].
Keywords: bathymetry; SDB; WorldView-3; spectic correction; remote sensing.
1. Introduction
Based on the statistical relationships between satellite image pixel values and field measured water depth measurements, several methods in Remote Sensing (RS) environments have been developed in order to obtain bathymetric data of a specific area of study.
辐射定标和大气校正过程参考
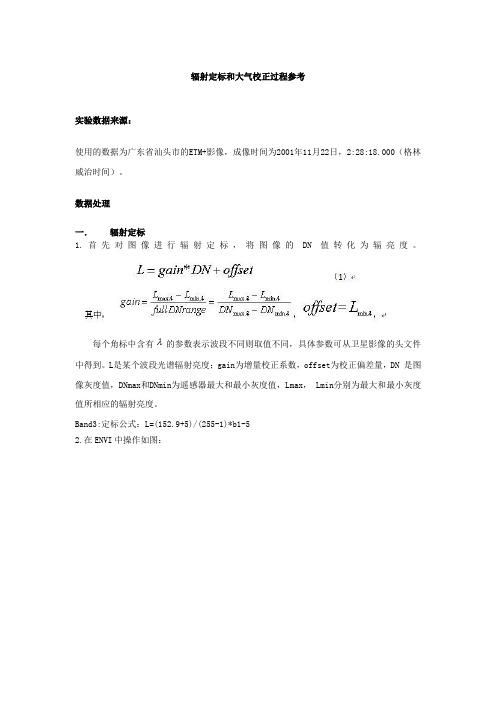
辐射定标和大气校正过程参考实验数据来源:使用的数据为广东省汕头市的ETM+影像,成像时间为2001年11月22日,2:28:18.000(格林威治时间)。
数据处理一.辐射定标1.首先对图像进行辐射定标,将图像的DN值转化为辐亮度。
每个角标中含有 的参数表示波段不同则取值不同,具体参数可从卫星影像的头文件中得到。
L是某个波段光谱辐射亮度;gain为增量校正系数,offset为校正偏差量,DN 是图像灰度值,DNmax和DNmin为遥感器最大和最小灰度值,Lmax, Lmin分别为最大和最小灰度值所相应的辐射亮度。
Band3:定标公式:L=(152.9+5)/(255-1)*b1-52.在ENVI中操作如图:定标前: 定标后:二. 大气校正1.将图像的辐亮度转化为表现反射率))cos(*/(**2θπρESUN d L =其中ρ为表观反射率,L 为表观辐亮度,d 为日地距离,ESUN 为太阳平均辐射强度,θ为太阳天顶角。
ESUN 的值从表3中查得。
d 的值根据影像成像的儒略日(在一年中所在天数)从表4查得,如实习影像成像时间是2001年11月22日,儒略日为第326天,d=0.9860天文单位。
θ从头文件中读取为41.36°,cos θ=0.7506,表观反射率计算公式为: ρ=3.142*L*(0.9860)2/(1554*0.7506)。
参考表格:2.在ENVI中操作如图:结果图:1.输入文件:input32.通过cmd.exe执行下列操作得到output3.txt文件3.找到所需数据由output3.txt可知coefficients xa xb xa : 0.00543 0.02145 0.05637。
4. 利用公式计算校正后的反射率其中,ρ为校正后的反射率,L i是i波段的辐射量度得到计算公式为:y=0.00543*L i-0.021455.利用ENVI计算用6s得到模型进行的大气纠正四.对比大气纠正完得到的是地表真实反射率,而辐射定标完得到的是表观发射率,二者的区别就是表观反射率经过大气校正之后得到的才是真实反射率,所以两个的值有所差别。
传感器辐射定标的方法

传感器辐射定标的方法传感器辐射定标是指通过一系列实验和数学模型建立传感器响应与环境辐射之间的关系,以提高传感器测量的准确性和可靠性。
传感器辐射定标是分析辐射场中各种辐射的能量分布及其与传感器响应的关系,通过定义传感器的响应函数,将所测量的辐射能量转换为传感器所能够接收到的能量,从而确定传感器的灵敏度和相对校准常数。
本文将介绍几种常用的传感器辐射定标方法。
第一种方法是基准源法。
这种方法是将已知辐射能量的标准源放在传感器的测量范围内,通过测量标准源的辐射能量和传感器的响应值,建立二者之间的关系。
标准源通常是已知辐射能量的放射体,如辐射度计。
通过记录辐射度计的读数和传感器的响应值,建立辐射能量与传感器响应之间的线性关系,从而进行传感器辐射定标。
第二种方法是黑体法。
黑体是指具有完全吸收辐射能力的物体,它能够从各个方向均匀地辐射能量。
通过将黑体放置在传感器的测量范围内,并记录黑体的辐射能量和传感器的响应值,建立黑体辐射能量与传感器响应之间的关系。
黑体法适用于对传感器的相对响应进行定标。
第三种方法是比较法。
比较法是通过将待定标传感器与已知辐射能量的标准传感器进行比较,获得待定标传感器的响应函数。
比较法可以通过将两个传感器置于相同环境条件下进行测量,然后比较两者的响应值来建立它们之间的关系。
也可以通过将待定标传感器的响应值与标准传感器的响应值进行差值计算,以确定传感器的校准量。
第四种方法是光电器件法。
光电器件法是通过利用光电器件对光的敏感性和响应能力来进行辐射定标。
常用的光电器件有光电二级管和光敏电阻。
通过将光电器件置于辐射源周围,在不同辐射能量条件下测量光电器件的响应值,建立光电器件的响应函数,然后利用该函数对其他传感器进行辐射定标。
综上所述,传感器辐射定标是通过一系列实验和数学模型建立传感器响应与环境辐射之间的关系,以提高传感器测量的准确性和可靠性。
常用的传感器辐射定标方法包括基准源法、黑体法、比较法和光电器件法。
photonview软件使用说明书
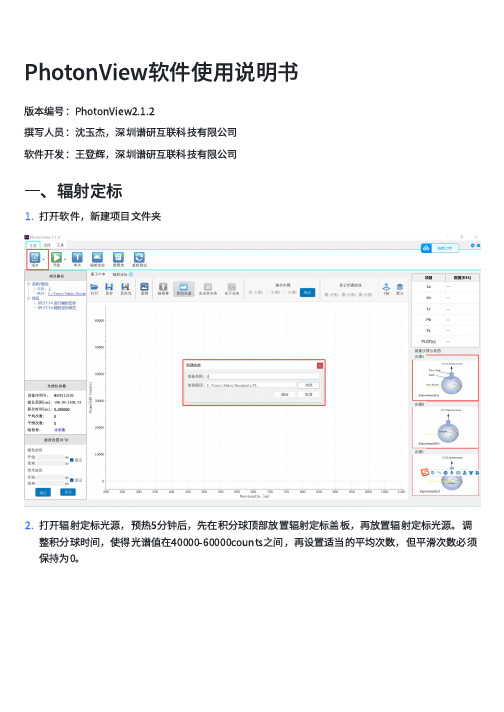
PhotonView软件使⽤说明书版本编号:PhotonView2.1.2撰写⼈员:沈⽟杰,深圳谱研互联科技有限公司软件开发:王登辉,深圳谱研互联科技有限公司⼀、辐射定标1.打开软件,新建项⽬⽂件夹2.打开辐射定标光源,预热5分钟后,先在积分球顶部放置辐射定标盖板,再放置辐射定标光源。
调整积分球时间,使得光谱值在40000-60000counts之间,再设置适当的平均次数,但平滑次数必须保持为0。
3.把辐射定标光源的Shutter开关拨动到中间,内部挡⽚挡住光源,此时光谱曲线⼏乎为0,。
点击“暗背景”按钮,存储暗背景,此时按钮变成“扣暗光谱”字样。
4.把辐射定标光源的Shutter开关拨动到OPEN⼀侧,再次打开光源,再依次点击“保存S0”、“计算”、“保存”等按钮,完成辐射定标,此时波段设置组件激活。
点击“数据表”,可以查看到辐射定标相关数据。
5.辐射定标完成后,关闭并取下光源,取出辐射定标盖板。
对应功率为μw,⾮紫外光,短时间观察对眼睛⽆伤害。
激光器使⽤前,最好预热5分钟,使得光谱值更稳定。
三、PLQY测量特别注意:由于激光器波⻓尖峰很窄,平滑次数会⼤⼤降低激光器尖峰,严重影响测量精度,在进⾏PLQY测量时光谱仪平滑次数只能为0。
PLQY测量分为三个步骤,分别命名为A、B、C,对应得到La、Lb、Pb、Lc、Pc共计5个变量数据,根据公式计算得出PLQY。
1.设置激光器强度在测试开始前,盖住顶部样品⼝,调节激光器强度,使得激光器光谱强度值在50000-60000counts之间。
积分时间、平均次数和平滑次数,通常保持和辐射定标⼀致,也可以按需调整。
2.存储暗背景关闭激光器,点击“暗背景”,存储当前暗背景,此时光谱曲线可在原始光谱、光功率分布和光⼦分布三个模式下任意切换。
该步骤⼀定需要操作,否则⽆法激光操作步骤。
下⾯对三个步骤分别进⾏光谱数据测量。
3.步骤A。
打开激光器,观察到激光器光谱,在操作步骤位置的步骤A选项下,点击“确定”按钮,右侧显⽰出La数值。
三维坐标仪使用方法

三维坐标仪使用方法使用三维坐标仪是一项非常重要的技能,它可以帮助我们更准确地测量物体的体积和形状。
在这篇文章中,我将向您介绍如何使用三维坐标仪进行测量。
我们需要将三维坐标仪放置在一个平坦的表面上,并确保它是水平的。
然后,我们需要将我们要测量的物体放在三维坐标仪的工作台上,并将其固定在那里。
在固定物体的同时,我们还需要确保它与三维坐标仪的坐标轴保持垂直。
接下来,我们需要打开三维坐标仪的软件,并进行初始设置。
这包括设置坐标轴的起点和终点,以及设置我们要使用的测量单位。
一旦我们完成了这些设置,我们就可以开始进行测量了。
在测量之前,我们需要确定我们要测量的物体的参考点。
这通常是物体的中心点或底部。
我们需要将三维坐标仪的探头放置在参考点上,并记录下其坐标。
接下来,我们需要将探头移动到物体的另一个点,并记录下其坐标。
我们需要在物体的各个位置进行这个过程,直到我们测量了整个物体。
在进行测量时,我们需要确保探头与物体的表面接触,并且不会产生任何移动或摇晃。
一旦我们完成了所有测量,我们就可以使用三维坐标仪的软件来计算物体的体积和形状。
我们可以使用三维坐标仪提供的工具来创建一个三维模型,并在模型上进行各种测量。
我们还可以将模型导出为其他文件格式,以便在其他软件中使用。
在使用三维坐标仪进行测量时,我们需要注意以下几点:1. 确保三维坐标仪是水平的,并与物体的坐标轴垂直。
2. 确定参考点,并在各个位置进行测量。
3. 确保探头与物体表面接触,并不会产生移动或摇晃。
4. 使用三维坐标仪的软件进行测量和计算。
使用三维坐标仪进行测量需要一定的技能和经验。
我们需要注意各种细节,确保我们得到准确的测量结果。
当我们熟练掌握这项技能时,我们将能够更准确地测量各种物体的体积和形状。
三坐标操作使用规程

三坐标操作使用规程概述三坐标测量仪器是一种高精度的测量设备,广泛应用于各种工业制造领域中。
为了保证三坐标测量仪器正常运行和准确测量,制定三坐标操作使用规程十分必要。
本文将详细介绍三坐标操作使用规程,包括什么是三坐标操作、三坐标操作的基本要求、操作注意事项等。
什么是三坐标操作三坐标操作是指在三坐标测量仪器上进行的所有操作,包括启动、校准、测量、保存测量数据等。
在三坐标操作中,使用者需要根据三坐标设备的规格和操作手册,了解三坐标的基本配置和最佳操作方法,以确保准确测量目标物体的尺寸和形状。
三坐标操作基本要求设备安全操作在操作三坐标测量仪器之前,使用者应该确保设备状态良好,如下:•仔细检查机器表面是否有损坏。
•检查操作面板和其他设备的所有部分是否紧固和整齐。
•检查全电路是否接正,以及是否符合安全标准。
•检查设备地线是否符合安全标准。
设备前期准备在进行三坐标操作之前,需要进行的准备工作包括:•开启三坐标测量仪器并调整相应设置。
•确保检测头的正确连接和调校。
•放置待测物体并进行适当的定位。
•准确测量待测物体的荷重重心。
测量操作流程进行三坐标操作之前,需要了解测量操作流程,以确保正确高效地完成工作。
该流程通常包括:•安装样品并校准检测头。
•建立新测量点或设置旧测量点。
•设置和调整测量参数。
•进行测量操作。
•根据测量结果进行调整,并保存测量数据。
操作注意事项•在使用过程中,需要遵循使用说明书中给出的操作流程。
•在测量时要准确把握测量的范围和准确性,不能出现过度或不足的情况。
•对于不同的使用程序,需要正确选择所需的程序,并按照操作说明进行操作。
•在设备运行中,要避免丢失数据和崩溃的情况,如出现异常情况,要及时停止设备并进行排查。
•操作完成后,应在设备中清空数据防止对下一次检测带来干扰。
结语三坐标操作使用规程是保证三坐标测量仪器正常运行和准确测量的重要规范。
在运行操作过程中,要严格遵照该规程进行操作,准确检测样品的尺寸和形状,保障工业制造的质量和生产效率。
WorldView3卫星影像数据(北京揽宇方圆)

北京揽宇方圆信息技术有限公司
热线:4006019091
第 1 页 WorldView-Ⅲ卫星影像数据
该卫星于8月13日宣布成功发射WorldView-3卫星,具有高光谱和高分辨率的优势。
WorldView-3号卫星将以0.31米的分辨率进行高光谱图像的采集,图像的清晰度将是其他卫星公司的5倍。
除此之外,WorldView-3还将为用户提供光谱分布最为丰富的商业卫星图像,并将成为第一颗提供多种短波红外线(SWIR)波段的卫星,它使透过雾霾、烟尘以及其他空气颗粒进行精确图像采集成为可能。
WorldView-3也是唯一一颗装备CAVIS 装置(云层、气溶胶、水汽、冰雪等气象条件下的大气校正设备)的卫星,通过该装置可以对气象条件进行监测并进行数据的校正,这也将达到一个前所未有的技术水平。
WorldView-3卫星的发射开创了更高级别清晰度的卫星影像新时代,也使DigitalGlobe 进一步扩展了其图像产品范围,将为各大地图供应商提供更好的卫星影像解决方案。
Worldview3卫星影像参数

Worldview3卫星影像参数北京揽宇方圆信息技术有限公司WV3卫星提供31厘米全色分辨率\1.24米多光谱分辨率和3.7米红外短波分辨率。
优势超高分辨率*--全色31 厘米--多光谱1.24 米--短波红外3.7 米-- CAVIS 30 米同步高分辨率超光谱影像大面积单景和立体采集可消除时态变化无地面控制点亦可实现精确地理定位每天采集全球680,000 平方公里的影像新增和加强版应用包括:--制图--土地分类--防灾准备/响应--特征提取/变化监测--土壤/植物分析--地质情况:石油和天然气、采矿--环境监测--水深测量/海岸带应用--人造材料识别卓越的阴霾穿透能力市场有售中光谱多样性最大的产品--全色波段-- 4 种标准VNIR 颜色:蓝、绿、红、near-IR1 -- 4 种附加VNIR 颜色:海岸带、黄、红边和near-IR2-- 8 个SWIR 波段:穿透阴霾、尘雾、烟雾、粉尘、烟、薄雾和卷云-- 12 个CAVIS 波段:云、浮质、蒸汽、冰和雪的校准行业领先的地理定位精度在各种采集模式中均拥有高容量双向扫描使用控制力矩陀螺迅速重新瞄准目标(比其他任何竞争对手快2 倍以上)直接从客户网站访问任务,并将图像传送到客户网站每日回访设计规格轨道高度:617 公里类型:太阳同步,1:30 pm 降交点周期:97 分钟使用寿命规定的使用寿命:7.25 年预计使用寿命:10 - 12 年航天器尺寸、重量、功率尺寸:5.7 米(18.7 英尺)高x 2.5 米(8 英尺)宽»太阳能电池帆板展开后总跨度7.1 米(23 英尺)质量:2800 公斤(6200 磅)功耗:太阳能电池3.1 千瓦,蓄电池100 安培小时传感器波段全色:450 - 800 纳米8 个多光谱:海岸带:400 - 450 纳米红:630 - 690 纳米蓝:450 - 510 纳米红边:705 - 745 纳米绿:510 - 580 纳米Near-IR1:770 - 895 纳米。
- 1、下载文档前请自行甄别文档内容的完整性,平台不提供额外的编辑、内容补充、找答案等附加服务。
- 2、"仅部分预览"的文档,不可在线预览部分如存在完整性等问题,可反馈申请退款(可完整预览的文档不适用该条件!)。
- 3、如文档侵犯您的权益,请联系客服反馈,我们会尽快为您处理(人工客服工作时间:9:00-18:30)。
Radiometric Use of WorldView-3 ImageryTechnical NoteDate: 2016-02-22Prepared by: Michele KuesterThis technical note discusses the radiometric use of WorldView-3 imagery. The first two sections briefly describe the WorldView-3 instrument and general radiometric performance including the WorldView-3 relative spectral radiance response and relative radiometric correction of WorldView-3 products. Section 3 covers conversion to top-of-atmosphere spectral radiance and conversion to top-of-atmosphere spectral reflectance. WorldView-3 imagery MUST be converted to spectral radiance at a minimum before radiometric/spectral analysis or comparison with imagery from other sensors in a radiometric/spectral manner. The information contained in this technical note applies to the raw WorldView-3 sensor performance and linearly scaled top-of-atmosphere spectral radiance products. Caution is advised when applying the equations provided here to pan-sharpened products, dynamic range adjusted (DRA) products, or WorldView-3 mosaics with radiometric balancing because the generation of these products may apply non-linear transformations to the pixel DN values.1 WorldView-3 InstrumentThe WorldView-3 high-resolution commercial imaging satellite was launched on August 13, 2014, from Vandenberg Air Force Base. The satellite is in a nearly circular, sun-synchronous orbit with a period of 97 minutes, an altitude of approximately 617 km, and with a descending nodal crossing time of approximately 10:30 a.m. The revisit is 4.5 days at a greater than 20-deg off nadir angle. WorldView-3 acquires 11-bit data in 9 spectral bands covering panchromatic, coastal, blue, green, yellow, red, red edge, NIR1, and NIR2. An additional shortwave infrared (SWIR) sensor acquires 14-bit data in eight bands covering the 1100 to 2500 nm spectral region. See Table 1 for details. At nadir, the collected nominal ground sample distance is 0.31 m (panchromatic), 1.24 m (multispectral) and 3.7 m (SWIR). Commercially available products are resampled to 0.3 m (panchromatic), 1.2 m (multispectral) and 7.5 m (SWIR). The nominal swath width is 13.1 km (slightly less for the SWIR sensor). The WorldView-3 instrument is a pushbroom imager, which constructs an image one row at a time as the focused image of the Earth through the telescope moves across the linear detector arrays, which are located on the focal plane.1.1 WorldView-3 Relative Radiance ResponseThe spectral radiance response is defined as the ratio of the number of photo-electrons measured by the instrument system, to the spectral radiance [W-m-2-sr-1- m-1] at a particular wavelength present at the entrance to the telescope aperture. It includes not only raw detector quantum efficiency, but also transmission losses due to the telescope optics and filters. The spectral radiance response for each band is normalized by dividing by the maximum response value for that band to arrive at a relative spectral radiance response. The curves for theWorldView-3 visible and near infrared multispectral bands are shown in Figure 1. The curves for the WorldView-3 SWIR bands are shown in Figure 2. The corresponding data are provided in Attachement A.Figure 1: WorldView-3 Relative Spectral Radiance Response (nm) for the VNIR bands.Figure 2: WorldView-3 Relative Spectral Radiance Response (nm) for the SWIR bands.1.2 WorldView-3 Effective BandwidthThe effective bandwidth for each band of the WorldView-3 system is defined as:∞Δλ=∫R′(λ)dλwhere ∆λ is the effective bandwidth in μm for a given band, and R'(λ) is the relative spectral radiance response for a given band. The effective bandwidths should be used in the conversion to top-of-atmosphere spectral radiance for each bandand are listed in Table 1. For reference, the center wavelength for each band is also given. The effective bandwidths are also included in the image metadata (.IMD file extension) accompanying the image product.2 Relative Radiometric Correction of WorldView-3 ProductsRelative radiometric calibration and correction are necessary because a uniform scene does not create a uniform image in terms of raw digital numbers (DNs). Major causes of non-uniformity include variability in detector response, variability in electronic gain and offset, lens falloff, and particulate contamination on the focal plane. These causes manifest themselves in the form of streaks and banding in imagery. In the case of a pushbroom system focal plane containing linear arrays, the data from every pixel in a given image column comes from the same detector. Any differences in gain or offset for a single detector show up as a vertical streak in raw imagery. Differences in gain and offset for a single readout register show up as vertical bands as wide as the number of detectors read out by the register. Relative radiometric correction minimizes these image artifacts in WorldView-3 products.A relative radiometric correction is performed on raw data from all detectors in all bands during the early stages of WorldView-3 product generation. This correction includes a dark offset subtraction and a non-uniformity correction (e.g. detector-to-detector relative gain).It is important to note that, after radiometric correction, the corrected detector data are spatially resampled to create a specific WorldView-3 product that has relative radiometrically corrected image pixels. Once spatial resampling is performed, the radiometric corrections are not reversible. Data from all WorldView-3 detectors are relative radiometrically corrected and used to generate WorldView-3 products. To date, no detectors have been declared as non-responsive detectors. The WorldView-3 VNIR instrument collects data with 11 bits of dynamic range. These 11 bits are either stored as 16 bit integers or are scaled down to 8 bits to reduce the file sizes of WorldView-3 products and for use with specific COTS tools that canonly handle 8-bit data. The same is done for the 14 bit SWIR data. Whether the final bit depth is 16 or 8 bits, the goal of the relative radiometric correction, other than minimize image artifacts, is to scale all image pixels to top-of-atmosphere spectral radiance so that one absolute calibration factor can be applied to all pixels in a given band.3 Absolute Radiometric Correction of WorldView-3 Products and Conversion to Top-of-Atmosphere Spectral RadianceWorldView-3 products are delivered to the customer as relative radiometrically corrected image pixels. Their values are a function of how much spectral radiance enters the telescope aperture and the instrument conversion of that radiation into a digital signal. That signal depends on the spectral transmission of the telescope and filters, the throughput of the telescope, the spectral quantum efficiency of the detectors, and the analog to digital conversion. Therefore, image pixel data are unique to WorldView-3 and should not be directly compared to imagery from other sensors in a radiometric/spectral sense. In addition, bands taken at different TDI levels may give misleading spectral information if left in digital number space. Image pixels should be converted to top-of-atmosphere spectral radiance at a minimum.A pre-flight calibration has been performed and these data are provided in the .IMD metadata file that is delivered with the imagery. Since launch, DigitalGlobe has performed an extensive vicarious calibration campaign to provide an adjustment to the pre-launch values. The top-of-atmosphere radiance, L, in units of Wµm-1 m-2 sr-1, is then found from the DigitalGlobe image product for each band by converting from digital numbers (DN) using the equation,The TDI and scan direction specific abscalfactor and effectiveBandwidth are delivered with the imagery in the metadata file. The digital number, DN, is the pixel value found in the imagery. The Gain and Offset are the absolute radiometric calibration band dependent adjustment factors that are given in Table 2. Note that these are not necessarily static values and they are revisited annually.Table 2. Absolute radiometric Calibration Adjustment Factors for WorldView-3 as of 1/29/2016. It is recommended that these values are used for more accurate at sensor radiance values. Updates will be made available to the public online alongside this technical paper or by request.The absolute radiometric calibration factor and effective bandwidth values for each band are delivered with every WorldView-3 product and are located in the image metadata files (extension .IMD). An excerpt from a product .IMD file shows the absolute radiometric calibration factor (absCalFactor) and the effective bandwidth (effectiveBandwidth), for example:BEGIN_GROUP = BAND_C…absCalFactor = 9.295654e-03;effectiveBandwidth = 4.730000e-02;END_GROUP = BAND_CThis example is for the coastal band. There are sections for each band, in particular: BAND_C = Coastal; BAND_B = Blue; BAND_G = Green; BAND_Y = Yellow; BAND_R = Red; BAND_RE = Red Edge; BAND_N = NIR1; BAND_N2= NIR2. Note that the values are provided in scientific notation.The absolute radiometric calibration factor is dependent on the specific band, as well as the TDI exposure level, line rate, pixel aggregration, and bit depth of the product. Based on these parameters, the appropriate value is provided in the .IMD file. For this reason, care should be taken not to mix absolute radiometric calibration factors between products that might have different collection conditions.4 Conversion to Top-of-Atmosphere ReflectanceFor many multispectral analysis techniques such as band ratios, Normalized Difference Vegetation Index (NDVI), matrix transformations, etc., it is common practice to convert multispectral data into reflectance before performing the analysis. In addition, techniques for removal of atmospheric effects range from a simple dark object subtraction or empirical line method, to more robust radiative transfer approaches. These methods require that first the imagery be normalized for solar irradiance and sensor radiance by conversion to top of atmosphere reflectance, ρ(TOA)λ.ρ(TOA )λ=L λd 2πE λcos θSwhere L λ is the at-sensor radiance for the spectral band λ in W/m 2/µm/sr found in the previous section above, d is the Earth-Sun distance in astronomical units, E λ is the band-averaged solar exoatmopsheric irradiance in W/m 2/µm, and θS is the solar zenith angle.Top-of-atmosphere reflectance does not account for topographic, atmospheric, or BRDF differences. Consult the references by Schott or Schowengerdt for further discussion on correction for topographic or atmospheric effects. Typically a dark object subtraction technique is recommended at a minimum to reduce atmospheric effects due to the upwelling path radiance (Richards, p. 46, 1999 or Schowengerdt, p. 315, 1997) followed by atmospheric modeling.4.1 Solar Exoatmospheric IrradianceThe WorldView-3 instrument is sensitive to wavelengths of light in the visible through shortwave-infrared portions of the electromagnetic spectrum as shown in Figure 1 and Figure 2. In this region, top-of-atmosphere radiance measured by WorldView-3 is dominated by reflected solar radiation. Spectral irradiance is defined as the energy per unit area falling on a surface as a function of wavelength. Because the Sun acts like a blackbody radiator, the solar spectral irradiance can be approximated using a Planck blackbody curve at 5900 degrees Kelvin, corrected for the solar disk area and the distance between the Earth and the Sun (Schowengerdt, pp. 36-37, 1997). However, a model of the solar spectral irradiance is better used for this purpose. The solar spectral irradiance curve peaks around 450 nm in the coastal and blue bands and slowly decreases at longer wavelengths. The WRC Solar Spectral Irradiance Curve is shown in Figure 3 as an example. Thuillier 2003 is used for the vicarious calibration work at DigitalGlobe and is our recommended curve. The ChKur and WRC band averaged values are also given as they are also widely used and accepted in the remote sensing community. NOTE: the curves are given for an Earth-Sun distance of 1 Astronomical Unit (AU) normal to the surface being illuminated.In general, band-averaged solar spectral irradiance is defined as the weighted average of the peak normalized effective irradiance value over the detector bandpass as shown in the following equation:where Esun λBand is the band-averaged solar spectral irradiance [W-m -2-μm -1] for a given band, Esun(λ) is the solar spectral irradiance curve [W-m -2-μm -1] (WRC shown in Figure 3), and R '(λ)Band is the relative spectral radiance response for a given band.⎰⎰∞∞⋅'⋅'⋅=BandBandBand d )(R d )(R )Esun(Esun λλλλλλFigure 3: WRC Solar Spectral Irradiance CurveSpecific to WorldView-3, the band-averaged solar spectral irradiance values for an Earth-Sun distance of 1 AU, normal to the surface being illuminated, are listed in Table 3.Table 3: WorldView-3 Band-Averaged Solar Spectral Irradiance4.1.2 Earth-Sun DistanceIn order to calculate the Earth-Sun distance for a given product, the customer must first use the image acquisition time to calculate the Julian Day. The acquisition time for a product is contained in the image metadata file (.IMD file extension). Acquisition time uses the UTC time format and in the relevant section of the .IMD files looks like:Basic Product:BEGIN_GROUP = IMAGE_1 … firstLineTime = YYYY_MM_DDThh:mm:ss:ddddddZ; …END_GROUP = IMAGE_1Standard (projected) Product:BEGIN_GROUP = MAP_PROJECTED_PRODUCT …earliestAcqTime = YYYY_MM_DDThh:mm:ss:ddddddZ; …END_GROUP = MAP_PROJECTED_PRODUCTFrom the UTC time format, retrieve the year, month, day and calculate the Universal Time (UT) from the hours, minutes, and seconds:3600.0ss.dddddd60.0mm hh UT DD day MM month YYYY year ++====If the customer has an algorithm that can calculate the Julian Day, that value can also be used. Otherwise use the equations listed below (Meeus, p. 61, 1998). The word “int” listed in the equations means to truncate the decimals and only use the integer part of the number. If the image was acquired in January or February, the year and month must be modified as follows:12month month 1year year +=-=Next, calculate the Julian Day (JD):[][]1524.5B 24.0UTday )1month (30.6001int )4716year (365.25int JD 4A int A 2B 100year int A -++++⋅++⋅=⎪⎭⎫⎝⎛+-=⎪⎭⎫ ⎝⎛=As an example, the WorldView-2 launch date of October 8, 2009 at 18:51:00 GMT corresponds to the Julian Day 2455113.285. Once the Julian Day has been calculated, the Earth-Sun distance (d ES ) can be determined using the following equations (U.S. Naval Observatory):)cos(2g 0.00014cos(g)0.016711.00014d D0.98560028357.529g 2451545.0JD D ES ⋅-⋅-=⋅+=-=NOTE: g is in degrees but most software programs require radians for cosine calculations. Conversion may be necessary for g from degrees to radians. The Earth-Sun distance will be in Astronomical Units (AU) and should have a value between 0.983 and 1.017. For the WorldView-2 launch date, the Earth-Sun distance is 0.998987 AU. At least six decimal places should be carried in the Earth-Sun distance for use in radiometric balancing or top-of-atmosphere reflectance calculations.4.1.2 Solar Zenith AngleThe solar zenith angle does not need to be calculated for every pixel in an image because the sun angle change is very small over the 13.4 km image swath and the along-track image acquisition time. The average solar zenith angle for the image is sufficient for every pixel in the image. The average sun elevation angle [degrees] for a given product is calculated for the center of the scene and can be found in the .IMD files:BEGIN_GROUP = IMAGE_1 …meanSunEl = 68.7;…END_GROUP = IMAGE_1The solar zenith angle is simply:sunEl S -=0.90θThis example is for a sun elevation angle of 68.7 degrees, which corresponds to a solar zenith angle of 21.3 degrees. 5 Radiometric Balancing for Multiple Scene MosaicsFor many customers, it may be desirable to create large area mosaics from multiple WorldView-3 scenes. Ignoring geometric effects, adjacent areas might appear to have different brightness values leaving a visible seam between scenes. As stated earlier, WorldView-3 pixel digital numbers are a function of the spectral radiance entering the telescope aperture at the WorldView-3 altitude of 617 km. This top-of-atmosphere spectral radiance varies with Earth-Sun distance, solar zenith angle, topography (the solar zenith angle is calculated for flat terrain so topography adds an extra geometry factor for each spot on the ground), bi-directional reflectance distribution function (BRDF-the target reflectance varies depending on the illumination and observation geometry), and atmospheric effects (absorption and scattering).Topography, BRDF, and atmospheric effects can be ignored for simple radiometric balancing. Consequently, the major difference between two scenes of the same area is the solar geometry. The solar spectral irradiance values listed in Table 4 correspond to the values for the mean Earth-Sun distance, normal to the surface being illuminated. The actual solar spectral irradiance for a given image varies depending on the Earth-Sun distance and the solar zenith angle during the individual image acquisition. This variation will cause two scenes of the same area (or adjacent areas) taken on different days to have different radiances and hence different image brightnesses. The difference can be minimized by correcting imagery for Earth-Sun distance and solar zenith angle or simply converting to top-of-atmosphere solar reflectance as described in this technical document.6 SummaryRaw WorldView-3 imagery undergoes a relative radiometric correction process to reduce visible banding and streaking in WorldView-3 products. The products are linearly scaled to absolute spectral radiance. Various types of spectral analysis can be performed on this radiometrically corrected WorldView-3 imagery. Depending on the application, WorldView-3 products may need to be converted to top-of-atmosphere spectral radiance or spectral reflectance. These transformations are performed using the equations listed in this technical note. In the case of large area mosaics, Top-of-atmosphere reflectance isrecommended as a starting point. Additional radiometric balancing may help match the brightness of the scenes used in the mosaic. For customers interested in comparing WorldView-3 products with imagery from other sensors, keep in mind the spectral response curves and gain settings which are specific to WorldView-3. Many of the differences in analysis results can be explained by the differences in the sensors themselves.7 ReferencesMeuss, Jean. "Astronomical algorithms, 2nd Ed.." Richmond, VA: Willmann-Bell(1998).Richards, John A. and Xiuping Jia. “Remote Sensing Digital Image Analysis: An Introduction 3rd ed.,” Springer, Berlin, 1999.Schott, John R. “Remote Sensing: The Image Chain Approach,” Oxf ord University Press, New York(1997). Schowengerdt, Robert A. “Remote Sensing: Models and Methods for Image Processing 2nd e d.,” Academic Press, San Diego(1997).Thuillier, G., et al. "The solar spectral irradiance from 200 to 2400 nm as measured by the SOLSPEC spectrometer from the ATLAS and EURECA missions." Solar Physics 214.1 (2003): 1-22.Wehrli, C. “Extraterrestrial Solar Spectrum,” Publication 615, Physikalisch-Metrologisches Observatorium Davos and World Radiation Center, Davos-Dorf, Switzerland, pp. 23(1985).。