用 MATLAB 连结 Zemax OpticStudio 之一:连线与基本操作
如何使用Matlab进行光学系统设计与分析

如何使用Matlab进行光学系统设计与分析光学系统是现代科学和工程领域中非常重要的一部分。
它涉及到光的传播和控制,以实现一系列的功能,如成像、聚焦、衍射等等。
光学系统的设计与分析可以帮助我们更好地理解光的行为并优化系统性能。
在本文中,我们将介绍如何使用Matlab进行光学系统设计与分析。
第一部分:光学系统建模在光学系统设计与分析中,必须首先对系统进行建模。
Matlab提供了强大的工具和函数,用于建立光学系统的模型。
其中最基本的模型是射线模型,它将光线视为直线,并描述光的传播路径。
这种模型适用于较简单的系统,如透镜或凸透镜组。
除了射线模型外,Matlab还支持波模型和光场模型。
波模型将光视为一组波动方程,可以更好地描述光的衍射和干涉现象。
光场模型则将光视为波的能量分布,可以更准确地描述成像效果和光场分布。
第二部分:光学系统分析光学系统分析是对光学系统性能进行评估和优化的过程。
Matlab提供了一系列函数和工具,帮助我们进行光学系统分析。
其中最常用的分析方法是光线追迹和波前传播分析。
光线追迹是通过模拟光线的传播路径来分析光学系统。
Matlab提供了raytrace函数,可以实现光线追迹的模拟。
通过调整光线的发射角度和位置,我们可以研究光线在系统中的传播路径和成像效果。
波前传播分析是通过模拟波的传播来分析光学系统。
Matlab提供了fft函数和光学传输函数等工具,用于模拟波的传播和成像效果。
通过调整波的频率和振幅,我们可以研究波在系统中的传播和衍射效果。
第三部分:光学系统设计光学系统设计是根据特定需求来选择合适的光学元件并确定其位置和参数的过程。
Matlab提供了优化算法和优化函数,帮助我们实现光学系统设计。
在光学系统设计中,我们可以根据需求选择合适的透镜、反射镜、滤波器等元件,并利用优化算法来确定它们的位置和参数。
Matlab提供了fmincon和fminsearch等函数,可以帮助我们进行优化,并找到最佳的元件配置。
ZEMAX光学设计软件操作说明详解_光学设计
ZEMAX光学设计软件操作说明详解_光学设计.txt9母爱是一滴甘露,亲吻干涸的泥土,它用细雨的温情,用钻石的坚毅,期待着闪着碎光的泥土的肥沃;母爱不是人生中的一个凝固点,而是一条流动的河,这条河造就了我们生命中美丽的情感之景。
ZEMAX光学设计软件操作说明详解介绍这一章对本手册的习惯用法和术语进行说明。
ZEMAX使用的大部分习惯用法和术语与光学行业都是一致的,但是还是有一些重要的不同点。
活动结构活动结构是指当前在镜头数据编辑器中显示的结构。
详见“多重结构”这一章。
角放大率像空间近轴主光线与物空间近轴主光线角度之比,角度的测量是以近轴入瞳和出瞳的位置为基准。
切迹切迹指系统入瞳处照明的均匀性。
默认情况下,入瞳处是照明均匀的。
然而,有时入瞳需要不均匀的照明。
为此,ZEMAX支持入瞳切迹,也就是入瞳振幅的变化。
有三种类型的切迹:均匀分布,高斯型分布和切线分布。
对每一种分布(均匀分布除外),切迹因素取决于入瞳处的振幅变化率。
在“系统菜单”这一章中有关于切迹类型和因子的讨论。
ZEMAX也支持用户定义切迹类型。
这可以用于任意表面。
表面的切迹不同于入瞳切迹,因为表面不需要放置在入瞳处。
对于表面切迹的更多信息,请参看“表面类型”这一章的“用户定义表面”这节。
后焦距ZEMAX对后焦距的定义是沿着Z轴的方向从最后一个玻璃面计算到与无限远物体共轭的近轴像面的距离。
如果没有玻璃面,后焦距就是从第一面到无限远物体共轭的近轴像面的距离。
基面基面(又称叫基点)指一些特殊的共轭位置,这些位置对应的物像平面具有特定的放大率。
基面包括主面,对应的物像面垂轴放大率为+1;负主面,垂轴放大率为-1;节平面,对应于角放大率为+1;负节平面,角放大率为-1;焦平面,象空间焦平面放大率为0,物空间焦平面放大率为无穷大。
除焦平面外,所有的基面都对应一对共轭面。
比如,像空间主面与物空间主面相共轭,等等。
如果透镜系统物空间和像空间介质的折射率相同,那么节面与主面重合。
matlab-optic
∇2E
−
ε0μ0
∂2 E ∂t 2
=
∇
⎛ ⎜ ⎝
ρ ε0
⎞ ⎟ ⎠
+
μ0
∂J ∂t
(1.14)
需要指出的是,上式中没有考虑到介质的极化。弱考虑到介质的极化和实际一般光学问题中
自由电荷为零的条件,上式修正为:
∇2E − ε0μ0
∂2 E ∂t 2
=
μ0
∂J free ∂t
+ μ0
∂2P ∂t 2
−
1 ε0
∇×
B μ0
−
ε0
∂E ∂t
=
J
(Maxwell 修正的安培定律)
(1.4)
式中, E 和 B 分别代表了电场和磁场分量。电荷密度 ρ 描述路径空间单位体积内的电荷量
分布;电流 J 描述电荷的移动(单位电荷乘以速度)。 ε0 表示真空介电常数,其值为 ε0 = 8.854 ×10⁻¹²C 2 / N ·m 2 。μ0 表示真空磁导率常数,其值为 μ0 = 4π×10−7T ·m / A(或 者 kg·m /C 2 )。
2
wz=w0*sqrt(1+(lambda*pz/pi/w0ˆ2).ˆ2); Iopt=w0ˆ2./wz.ˆ2.*exp(-2*py.ˆ2./wz.ˆ2); surf(pz,py,Iopt); shading interp; xlabel(’位置 /mm’);
ylabel(’位置 /mm’);
zlabel(’相对强度 /a.u.’);
在安培定律中引入了一个关键参数之后,Maxwell 意识到,方程组构成了一个完美的电
磁现象自洽理论。此外,方程组预言了电磁波的存在,并以光速传播。在 Maxwell 时代之
zemax手把手教程

附:教程简介这一章将要教你如何使用ZEMAX,这一章的每一节将会让你接触一个不同的设计问题。
第一个设计例子是非常简单的,如果你是一个有经验的镜片设计师,你也许觉得它并不值得你去费心,但是,如果你花费一点点时间去接触它,你可以学到如何运行ZEMAX,然后你可以继续你自己特别感兴趣的设计。
前几个例子中,提供了一些关于镜片设计理论的教程内容,用来帮助那些对专用术语不是很了解的人。
但在总体上来说,这本手册,以及其中的这些特例,目的都不是要将一个新手培养成为一个专家。
如果你跟不上这些例子,或者你不能理解程序演示时与计算有关的数学知识,可以参考任何一本“简介”这一章中所列出的好书。
在开始课程之前,你必须先通过正当手段安装ZEMAX。
课程1:单透镜(a singlet)你将要学到的:开始ZEMAX,输入波长和镜片数据,生成光线特性曲线(ray fan),光程差曲线(OPD),和点列图(Spotdiagram),确定厚度求解方法和变量,进行简单的优化。
假设你需要设计一个F/4的镜片,焦距为100mm,在轴上可见光谱范围内,用BK7玻璃,你该怎样开始呢?首先,运行ZEMAX。
ZEMAX主屏幕会显示镜片数据编辑(LDE)。
你可以对LDE窗口进行移动或重新调整尺寸,以适合你自己的喜好。
LDE由多行和多列组成,类似于电子表格。
半径、厚度、玻璃和半口径等列是使用得最多的,其他的则只在某些特定类型的光学系统中才会用到。
L DE中的一小格会以“反白”方式高亮显示,即它会以与其他格子不同的背景颜色将字母显示在屏幕上。
如果没有一个格子是高亮的,则在任何一格上用鼠标点击,使之高亮。
这个反白条在本教程中指的就是光标。
你可以用鼠标在格子上点击来操纵LDE,使光标移动到你想要停留的地方,或者你也可以只使用光标键。
LDE的操作是简单的,只要稍加练习,你就可以掌握。
开始,我们先为我们的系统输入波长。
这不一定要先完成,我们只不过现在选中了这一步。
ZeMax Matlab使用方法
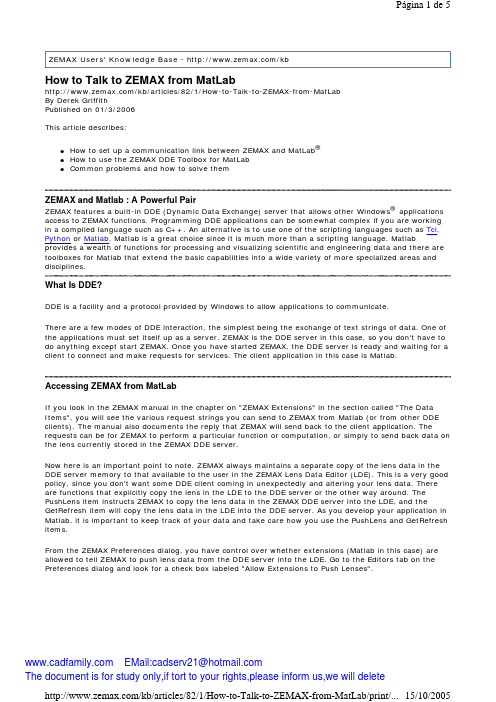
ZEMAX Users' Knowledge Base - /kbHow to Talk to ZEMAX from MatLab/kb/articles/82/1/How-to-Talk-to-ZEMAX-from-MatLabBy Derek GriffithPublished on 01/3/2006This article describes:®z How to set up a communication link between ZEMAX and MatLabz How to use the ZEMAX DDE Toolbox for MatLabz Common problems and how to solve themZEMAX and Matlab : A Powerful PairZEMAX features a built-in DDE (Dynamic Data Exchange) server that allows other Windows® applications access to ZEMAX functions. Programming DDE applications can be somewhat complex if you are working in a compiled language such as C++. An alternative is to use one of the scripting languages such as Tcl, Python or Matlab. Matlab is a great choice since it is much more than a scripting language. Matlab provides a wealth of functions for processing and visualizing scientific and engineering data and there are toolboxes for Matlab that extend the basic capabilities into a wide variety of more specialized areas and disciplines.What Is DDE?DDE is a facility and a protocol provided by Windows to allow applications to communicate.There are a few modes of DDE interaction, the simplest being the exchange of text strings of data. One of the applications must set itself up as a server. ZEMAX is the DDE server in this case, so you don't have to do anything except start ZEMAX. Once you have started ZEMAX, the DDE server is ready and waiting for a client to connect and make requests for services. The client application in this case is Matlab.Accessing ZEMAX from MatLabIf you look in the ZEMAX manual in the chapter on "ZEMAX Extensions" in the section called "The Data Items", you will see the various request strings you can send to ZEMAX from Matlab (or from other DDE clients). The manual also documents the reply that ZEMAX will send back to the client application. The requests can be for ZEMAX to perform a particular function or computation, or simply to send back data on the lens currently stored in the ZEMAX DDE server.Now here is an important point to note. ZEMAX always maintains a separate copy of the lens data in the DDE server memory to that available to the user in the ZEMAX Lens Data Editor (LDE). This is a very good policy, since you don't want some DDE client coming in unexpectedly and altering your lens data. There are functions that explicitly copy the lens in the LDE to the DDE server or the other way around. The PushLens item instructs ZEMAX to copy the lens data in the ZEMAX DDE server into the LDE, and the GetRefresh item will copy the lens data in the LDE into the DDE server. As you develop your application in Matlab, it is important to keep track of your data and take care how you use the PushLens and GetRefresh items.From the ZEMAX Preferences dialog, you have control over whether extensions (Matlab in this case) are allowed to tell ZEMAX to push lens data from the DDE server into the LDE. Go to the Editors tab on the Preferences dialog and look for a check box labeled "Allow Extensions to Push Lenses".Matlab has a few basic functions for performing DDE client operations. They include the following.ddeinit - This function is used to initiate a DDE conversationddereq - Used to request data from the DDE serverddeterm - Terminates the DDE linkThe basic sequence for accessing ZEMAX from Matlab is1) Start ZEMAX and Matlab.2) Initiate the DDE link from Matlab using the ddeinit function.3) Send requests and obtain replies from ZEMAX using the ddereq function.4) Terminate the link to ZEMAX using the ddeterm function.The ddereq function is used in the text mode, that is, you send data to ZEMAX in the form of a text string and the answer is returned in the form of another string. To get the strings into object classes that are more useful in Matlab (floats, doubles, integers etc.) you will use the sscanf function or other functions for string data conversion e.g. str2num.The ZEMAX DDE Toolbox for MatlabYou can save yourself some effort by downloading the ZEMAX DDE toolbox from the Mathworks Central File Exchange. This toolbox is open source under the GPL and implements a Matlab function for each of the data items documented in the ZEMAX manual in the chapter on ZEMAX Extensions. The corresponding Matlab function in the toolbox has the same name as the data item, but prefixed with "z". To get started, perform the following steps.1.Download the toolbox archive (.zip file).2.Unzip the archive to a sub-directory called MZDDE anywhere on your local disk.3.Start ZEMAX and Matlab.4.Add the directory MZDDE to your Matlab path to enable Matlab to find the new functions (go to theFile menu and select Set Path ...)5.If you type help mzdde at the Matlab prompt, you should get a list of all the functions in the toolboxand a short description of each function. If so, you are ready to use the toolbox.e the function zDDEInit to open the DDE link to ZEMAX. This step is important. If you don't dothis before trying to execute other calls in the toolbox, Matlab will issue a verbose error message suggesting that something terrible has happened and that you should contact the Mathworkstechnical support staff. If this happens, just ignore the error and make the call to zDDEInit.7.Call other functions in the toolbox as required, making judicious use of zPushLens and zGetRefreshif you need to interact with the ZEMAX user interface. Of course, you can call the functions from the Matlab command line, or incorporate them into your Matlab functions and scripts.8.Finish off by calling zDDEClose. This is not important in most cases, and you can just terminateMatlab and ZEMAX without closing the DDE link.Note that the toolbox function names are capitalized for readability. Matlab function names are case insensitive under Windows?, so that zddeinit is equivalent to zDDEInit. This is convenient at the Matlab command line, but the capitalization helps for readability in functions and scripts. The source code for all of the functions is available for modification and reuse, and you can examine the source to see how the basic Matlab DDE calls are used.TimeoutsEvery DDE call made by Matlab to ZEMAX is subject to a timeout limit. The default is set in the zDDEInit function to 3 seconds. That is, if ZEMAX does not respond to the DDE request within 3 seconds, the Matlab call will return empty-handed. You will want to increase the timeout limit if you are calling on ZEMAX to do time-consuming computations. This can be done using the zSetTimeout function call.ExampleHere is a simple example of an interaction with ZEMAX at the Matlab prompt. Having started ZEMAX in the usual way, enter the following commands in Matlab.>> zddeinitans =>> zLoadFile('C:/ZEMAX/Samples/Sequential/Objectives/Cooke 40 degree field.zmx')ans =>> zpushlens(1)ans =>> [x, y] = SpiralSpot(0.4, 0, 1, 10, 10000);>> plot(x,y)You should get a plot something like this ...Firstly the DDE link was initialized and the result of 0 indicated success, then ZEMAX was asked to load a lens into the DDE server with the zLoadFile function call. Now, a pretty way of representing a spot diagram is to trace a spiral of rays through the lens pupil and to plot the ray intercepts at the image plane. This is implemented in a toolbox function called SpiralSpot. Get help for the function by typing help spiralspot at the Matlab prompt. Because SpiralSpot acts on the lens in the LDE by starting out with a zGetRefresh, it is necessary to perform a zPushLens before calling SpiralSpot. A timeout of 1 second was specified for zPushLens to complete in this case.Note that in this example you would get the same result if you had loaded the same lens into ZEMAX from the ZEMAX File menu rather than using the zLoadFile call.Tracing Large Numbers of RaysThe standard text mode of the DDE call is adequate for many purposes, but not when large amounts of data have to be exchanged between the client and the server. This situation arises when you need to trace a large number of rays.Instead of tracing the rays one at a time, an array containing a list of all the rays to be traced is created, and then the entire array is passed to ZEMAX at one time. ZEMAX then traces all the rays, and passes the entire array back to the client. Rather than transferring all this data over DDE, a pointer to the location inmemory of the array is passed instead. This eliminates the bottlenexck of DDE communication whentracing large numbers of rays.Unfortunately, at the time of writing the toolbox, Matlab did not allow DDE modes other than text. To circumvent this problem, it was necessary to write some C code in mex (Matlab executable) format. The resulting .dll is called zArrayTrace.Type help zArrayTrace to get more information on bulk ray tracing. It will also be useful to consult the corresponding section in the ZEMAX manual. To help set up the ray input data for zArrayTrace mode 0, there is a function called genRayDataMode0.Compiling Standalone ZEMAX Extensions written in MatlabIf you have the Matlab compiler, it is possible to compile your Matlab scripts written using the toolbox to standalone extensions that can be run from the ZEMAX Extensions menu. There are a few traps that must be avoided when attempting this.Firstly, there are a few Matlab functions that cannot be compiled, and you will have to think of workarounds for such functions (fortunately not many).Secondly, while your standalone extension should run fine on a machine on which Matlab is installed, it will not run on a machine that does not have the Matlab runtime libraries. You must therefore package your extension together with the Matlab runtime libraries to make it fully portable. Mathworks makes this easier by packaging most of the required runtime libraries in a self-extracting archive called mglinstaller.exe (typically found in C:/MATLAB/extern/lib/win32 or thereabouts).The final trap is that the regular Matlab runtime libraries do not contain the code for the DDE functions mentioned above. These .dll files can be found by searching your Matlab installation for files matchingdde*.dll (typically C:/MATLAB/Toolbox/matlab/winfun or thereabouts). The runtime libraries, including the DDE libraries, must be installed to a directory that is on the Windows search path.Things to Remember when using the Toolbox1) Your first call after starting up ZEMAX and Matlab must be to zDDEInit.2) Timeouts can be a problem. Increase the DDE timeout limit using zSetTimeout if necessary.3) ZEMAX has two copies of the lens data, one displayed in the Lens Data Editor, and the other stored in the DDE server. Your can copy the one to the other using the zPushLens and zGetRefresh functions. zPushLens always requires a single parameter giving the timeout in seconds.4) zPushLens will only work if you have granted ZEMAX extensions permission to push lenses by checking the box on the Editors tab of the ZEMAX Preferences dialog.。
用 MATLAB 连结 Zemax OpticStudio 之二:常见语法问题

摘要:此系列文章共有三篇。
第一篇中,我們會示範如何利用MATLAB連結ZOS-API,並說明相關操作重點。
第二篇中,我們會重點提示撰寫時,幾個常見語法問題。
第三篇中,我們提供幾個有用的範例碼,說明幾個常見應用如何撰寫。
發布時間:March 17, 2017簡介關於ZOS-API本身,請參考知識庫內另一篇「簡介」。
MATLAB在透過ZOS-API連結OpticStudio時,主要有兩種模式:Standalone (獨立運作) 以及Interactive Extension (互動擴展)。
使用Standalone模式運作時,MATLAB會以背景模式連結到OpticStudio,然後所有動作都在Windows背後進行,過程中不會看到OpticStudio主視窗開啟。
反之,使用Interactive Extension模式運作時,必須先開啟OpticStudio,然後使用者需要先在OpticStudio開放連結,讓MATLAB能夠順利接入並控制,控制過程中OpticStudio不能手動操作,直到使用者手動在OpticStudio取消互動模式,取回控制權。
此文章為第二篇,說明一些語法要點。
關於連線的方法,請看第一篇。
變數宣告在MATLAB中,不需要宣告變數,因此語法很簡潔,可以像下面這樣寫。
lde1 = TheSystem.LDE;列舉型態在OpticStudio中設定資料時,有些是純數值,像是LDE中的半徑、厚度等。
有一些則是有限選項,例如視場型態(Field Type) 或是系統孔徑(System Aperture),這選項在UI中大部分都是以下拉式選單方式存在。
這種有限選項的參數設定,一般我們採用列舉來設定,比起用0、1、2、3… 來代表很一個選項,然後查表撰寫程式碼。
以下是一個設定系統孔徑(System Aperture) 的範例:TheSystem.SystemData.Aperture.ApertureType = ZOSAPI.SystemData.ZemaxApertureType.EntrancePupilDiameter;上面範例中的ZemaxApertureType即可以在Interface Document中找到定義,這種列舉的表示更直觀,撰寫時不易出錯,也讓程式碼更有可讀性。
【精品】zemax基本介绍和操作

对话框(Dialogs)
固定大小,在过程中跳出来的视 窗(鼠标拖曳不能改变大小) 用于定义或更新视场(Fields)、 波长(Wavelengths)、孔径 (Apertures)、面型(Surface types)等。
重庆大学 - 光学CAD
多视窗同时显示
重庆大学 - 光学CAD
重庆大学 - 光பைடு நூலகம்CAD
Non-sequential
以object为对象建模 不限制光线和相交的顺序 光线与同一面或物可多次相交 光线会分裂 镜面反射和漫反射 可以是全反射 在object外的光线也进行追迹 object的位置由全局坐标确定 所有空间是等价的 分析的光线多,计算速度慢 不能做优化和公差分析
执行已经编译好的宏程序。宏程序的编程过程:(1)使用一般的文本编辑器或使用 ZEMAX自身的编辑功能创建扩展名为“*.ZPL”文件,该文件置于ZEMAX目录下的 Macros目录中;(2)使用ZEMAX提供的命名或函数库进行程序编写;(3)用 Macros菜单下的“Run/Edit Zpl Macros…”执行宏程序。宏程序可以提取光线追迹数 据、像质指标等,可以定义新的优化设计用的操作符。执行时,宏程序作用的对象是 当前显示的镜头系统。
报告(Report)
形成镜头设计结果的报告,可以作为每一个光学面的形成报告(Surface data); 也能为镜头系统形成高斯参数或光学特性参数的报告(System data);还可以给出 设计结果的详细数据报告(Prescription data)。
重庆大学 - 光学CAD
菜单栏
宏编程(Macros)
RMS半径
RMS半径:先把每条光线和参考点 之间的距离的平方,求出所有光线 的平均值,然后取平方根
Matlab数字衍射光学实验讲义(一)
2015 级光电工程专业综合实验-信息光学专题实验
imagesc(z) figure(2) mesh(z) %%---------------------matlab 代码-------------------------
改变参数 a,b 的取值,观察模拟结果变化。 4)第一类贝塞尔函数 besselj(v,z)
1. 实验目的:
掌握基本的 Matlab 编程语言,了解其编程特点;模拟几种常用函数,了解其编 程过程及图像显示命令函数,掌握 Matlab 画图方法;通过设计制作一系列光学 研究物体掌握其编程方法; 掌握光波的 matlab 编程原理及方法, 初步了解 Matlab
2
2015 级光电工程专业综合实验-信息光学专题实验
4
2015 级光电工程专业综合实验-信息光学专题实验
figure(4) surfl(x,y,z)%三维 %%---------------------matlab 代码-------------------------
改变变量 a,b 观察模拟图像变化。
x 2 x 3)高斯函数:一维高斯函数 Gauss exp a a
二维高斯函数: sinc
x y x y , sinc sinc ,a,b 为正数。 a b a b
2 2 x y x y x y Gauss , Gauss Gauss exp a b a b a b
二维 sinc 函数: sinc
x y x y , sinc sinc ,a,b 为正数。 a b a b
%%---------------------matlab 代码------------------------clear %清除内存 close all %关闭所有窗口 [x,y] = meshgrid(-2:.05:2, -2:.05:2); %设置二维网格 z=sinc(x).*sinc(y); %sinc 函数 figure(1) imshow(z) %二维灰度图 figure(2) imagesc(z) %二维彩色 figure(3) mesh(z)%三维
- 1、下载文档前请自行甄别文档内容的完整性,平台不提供额外的编辑、内容补充、找答案等附加服务。
- 2、"仅部分预览"的文档,不可在线预览部分如存在完整性等问题,可反馈申请退款(可完整预览的文档不适用该条件!)。
- 3、如文档侵犯您的权益,请联系客服反馈,我们会尽快为您处理(人工客服工作时间:9:00-18:30)。
摘要:此系列文章共有三篇。
第一篇中,我們會示範如何利用MATLAB連結ZOS-API,並說明相關操作重點。
第二篇中,我們會重點提示撰寫時,幾個常見語法問題。
第三篇中,我們提供幾個有用的範例檔,說明幾個常見應用如何撰寫。
作者:Michael Cheng
發布時間:March 13, 2017
簡介
關於ZOS-API本身,請參考知識庫內另一篇「簡介」。
MATLAB在透過ZOS-API連結OpticStudio時,主要有兩種模式:Standalone (獨立運作) 以及Interactive Extension (互動擴展)。
使用Standalone模式運作時,MATLAB會以背景模式連結到OpticStudio,然後所有動作都在Windows背後進行,過程中不會看到OpticStudio主視窗開啟。
反之,使用Interactive Extension模式運作時,必須先開啟OpticStudio,然後使用者需要先在OpticStudio開放連結,讓MATLAB能夠順利接入並控制,控制過程中OpticStudio不能手動操作,直到使用者手動在OpticStudio取消互動模式,取回控制權。
以下將分別說明如何用兩種不同模式連線。
使用Standalone模式連線
首先是到OpticStudio中點選Programming > MATLAB > Standalone Application,以產生樣板程式碼。
Click To Enlarge
點擊後,可以看到系統會自動建立一個範例的.m檔,並且打開存放的資料夾,如果電腦中有安裝MATLAB,則會自動被開啟,並顯示範例的.m檔。
Click To Enlarge
這個.m檔可以直接被執行,他的設計是讓使用者直接把需要執行的動作的語言,加到以下截圖中的“% Add your custom code here...” 這行下面的部分中。
而不需要去管與OpticStudio連結的語法。
讓使用者可以專心執行工作。
我們可以看到在“%Add your…” 這行前一句是
TheSystem = TheApplication.PrimarySystem;
這行需要這樣解讀:我們呼叫TheApplication這個物件的一個叫做PrimarySystem的屬性,然後把結果交給一個叫做TheSystem的變數中。
以下是幾個基本說明,請注意這部分與ZOS-API並不直接相關,主要是關於MATLAB,或是大部分程式語言所共通的語法:
1. TheSystem僅為物件變數,可以是任何名稱,例如你也可以寫ABC = TheApplication.PrimarySystem;。
這只是
一個存放物件資料的變數名稱。
此為重要觀念之一。
2. 這些TheSystem或TheApplication都對應到一個“介面(i nterface)”。
介面就像方向盤或遙控器,你可以利用他的方法(method) 或是屬性(properties) 來下指令,執行各種動作。
3. 這些介面通常實際對應到OpticStudio中的某個工具或編輯器,例如ILensDataEditor就是鏡頭數據編輯器。
有些介面代表比較模糊的概念,例如IOpticalSystem代表整個你正在操作的系統。
這裡的IOpticalSystem指的是介面的名稱(type name),你不能直接使用IOpticalSystem這樣的介面名稱,我們必須建立一個變數來代表他才能使用,前面提到的TheSystem就是一個代表IOpticalSystem介面的變數。
4. 介面可以呼叫介面,他們的關係通常在OpticStudio中也看的到,例如IOpticalSystem可以呼叫ILensDataEditor。
通常我們會寫為
TheLDE = TheSystem.LDE;
注意TheSystem與TheLDE都是變數名稱,可以隨意更改。
LDE則是IOpticalSystem的一個屬性,名字是固定,無法隨意更改。
另外前面提到的這段語法也是介面呼叫介面。
TheSystem = TheApplication.PrimarySystem;
就是我們呼叫TheApplication這個物件中的PrimarySystem,而此物件會回傳IOpticalSystem介面,最後我們用一個等號“指定” 給TheSystem這個變數來代表這個介面的實體。
5. 每個介面有哪些屬性以及方法,這些屬性以及方法分別有什麼功能,會回傳什麼物件,都可以在我們的Interface Document中找到詳細說明,開啟位置如下圖:
下圖是一個很好的例子,可以看到在IOpticalSystem的Properties (屬性) 列表中,就有一個LDE。
只要存在,就可以呼叫,因此我們當然也可以撰寫如下:
TheMCE = TheSystem.MCE;
TheAnalyses = TheSystem.Analyses;
Click To Enlarge
至於上面令好的TheAnalyses變數可以做什麼,則可以點擊上圖中的Analyses連結,就可以看到如下的畫面:
Click To Enlarge
可以看到原來IOpticalSystem的Analyses屬性會回傳I_Analyses介面。
讓我們再點一下I_Analyses的連結,然後可以看到如下:
Click To Enlarge
因此在這裡我們可以知道I_Analyses有哪些屬性、方法可以使用。
例如我可以用TheAnalyses.NumberOfAnalyses得知目前系統中開啟了幾個分析視窗。
我也可以用FFTMTF = TheAnalyses.FftMtf()來開啟一個FFT MTF分析視窗的控制介面,並指定給FFTMTF這個變數。
或用TheAnalyses.CloseAnalysis(3)來關閉編號3的分析視窗。
依此類推。
請注意技術支援服務能協助你瞭解這些物件如何被設計,預期要如何操作,但是並不能協助你從最基本的程式語言操作開始。
使用Interactive Extension模式運作
此部分將僅說明跟Standalone模式不同的部分,關於語法的操作上,前面關於Standalone的說明都適用,因此建議讀者仍然閱讀前面的說明。
跟Standalone的模板代碼不同,Interactive Extension的模板程式碼幾乎只需要建立一個,之後就可以一值沿用,建立方法跟Standalone一樣,都是到Programming > MATLAB > Interactive Extension開啟。
Click To Enlarge
下圖中可以看到因為我已經是第三次按這個按鈕產生,因此產生的.m檔後面有後綴一個編號2,名字叫做MATLABZOSConnection2。
Click To Enlarge
在執行這段程式碼之前,我們需要先到OpticStudio中開放接口,如下圖:
Click To Enlarge
然後我們就可以執行這個.m檔,你會看到如下圖,MATLAB會自動用ans這個變數名稱來承接產生出來的物件,而這個物件就是ZOSAPI_Application介面。
也就是我們習慣用命名為TheApplication的變數來承接的介面。
Click To Enlarge
並且可以看到OpticStudio中介面顯示為Connected,表示已經正確連結:
由於ans這個變數名稱是MATLAB預設的結果儲存區,因此任何沒有變數承接的數值或物件,都會預設儲存到ans 之中。
這會造成問題,如果ans被儲存的其他內容,則我們就再也沒辦法呼叫ZOSPI_Application了!你可以試著在執行這個.m檔之後,隨意在計算須中輸入任一數字看看,例如123,我們會發現現在ans是一個整數變數,內容存放的是123:
Click To Enlarge
解決這個問題的方法很簡單:首先我們要把該.m的資料夾加入到MATLAB的“Path” 中,然後直接在呼叫這個.m 檔的時候,指定把產生的結果儲存到變數之中。
聽起來很複雜,其實很容易,首先加入Path的方法如下。
1. 來到MATLAB主畫面,選擇Set Path:
Click To Enlarge
2. 然後選擇你的Interactive Extension的.m檔資料夾加入,並按OK,如下:
Click To Enlarge
然後你就可以直接輸入如下,把ZOSAPI_Application介面設定給TheApplication這個變數存放。
TheApplication = MATLABZOSConnection2();
Click To Enlarge
接著你就可以呼叫IOpticalSystem、ILensDataEditor、I_Analyses等等,如下:
Click To Enlarge
你也可以把這些計算等語法寫入另一個.m檔之中,進行一些更複雜的工作,如下: Click To Enlarge。