1_ Retinal Blood Flow Evaluation
2019年《玻璃体后脱离、视网膜裂孔和格子样变性眼科临床指南》解读

中华实验眼科杂志 2021 年 1 月第 39 卷第 1 期 Chin J Exp Ophthalmol , Januac 2021, Vol. 39 ,No. 1-67 --继续教育-2019年《玻璃体后脱离、视网膜裂孔和格子样变性眼科临床指南》解读黄子旭王冬冬宋宗明河南省人民医院眼科河南省立眼科医院河南省眼科研究所河南省眼科学与视觉科学重 点实验室 郑州市眼科医学重点实验室 郑州大学人民医院450003通信作者:宋宗明 #EmXl : szmeyes@ 126. cam【摘要】 玻璃体后脱离(PVD )、视网膜裂孔和格子样变性是眼科临床工作中的常见问题,存在视网膜脱离、玻璃体视网膜牵拉的风险,对患者生活质量造成较大影响(2019年9月美国眼科学会发布了《玻璃体后脱离、视网膜裂孔和格子样变性眼科临床指南》,基于循证医学对玻璃体后脱离、视网膜裂孔和格子样变性的 定义、流行病学资料、诊断和治疗进行了阐述,对于不同病变类型如何进行治疗和随访提供了相对明确的方 案(本文就该《指南》主要内容进行介绍和解读(【关键词】 玻璃体后脱离;视网膜裂孔;格子样变性;视网膜脱离;美国眼科学会;指南解读基金项目:河南省医学科技攻关计划项目(SBGJ2018080 );河南省科技攻关计划项目( 192102310075)DOI :10.3760 ccma. 115989-20201016-00697Interpretation of the 2019 Posterior Vitreous Detachment , Retinal Breaks , and Lattice Degeneration PreferredPractice PatteraHuang Zixu , Wang Doogdoog , Soog ZoogmingDeparment 昕 Ophthalmology , Heean "rovincial People [ Hospital , Henan Hospital , Heean Eye Institute , Heean KeeLaboratory 吋 OpPthalmology and Visual Sciencc , Zhepgzhou Key Laboratory o Ophthalmology , Zhepgzhop UniversittPeople [ Hospital , Zhepgzhop 450003 , ChinaCorresponding author : Soog Zoogming , Emaii : szmeyep @ 126. comAbstract Posterior vitreous detachment ( PVD ) , retinal breaks , and lattice deyeneration are commonproblems in ophthalmic clinical practice , which not only cause disturbance te patients" life-quality , but alse increase the risk of retinal detachment and vitrecretinal traction. in September 2019, the American Academy of Ophthalmologypublished "osterior Vitreoup Detac0mept , Retinal Breaks , and Lattice Depenerahop "referreP "radicc Pattern ( PPP ).Based on clinical evidence , thiz PPP provides outhoritativv guidance for the definition, epidemiolovical background , diaynosiz and treatment of these diseases. Thiz PPP also gives definite solution for treatment and follow-up of differentsub-types. Thiz article provides introduction and interpretation of thiz PPP.Key wo C s Posterior vitrecus detachment ; Retinal breaks ; Lattice deveneration ; Retinal detachment ;American Academy of Ophthalmolovy ; Guidelines interpretationFund program : Medical Key Science and Technolovy Provram of Henan Province ( SBGJ2018080 ) ; Key Science and Technolovy Provram of Henan Province ( 192102310075)DOI :10.3760 ccma. 115989-20201016-00697视网膜后脱离(posterior vitreous detochineni ,PVD )、视网膜裂孔和格子样变性是常见的临床问题, 多数眼科工作者熟悉其定义和表现,但对其规范化诊 断、治疗和随访重视不足。
牵牛花综合征1例并文献复习
临床医学研究与实践2021年4月第6卷第11期DOI :10.19347/ki.2096-1413.202111002作者简介:陈治威(1994-),男,汉族,重庆涪陵人,住院医师,硕士在读。
研究方向:中西医治疗眼病。
*通讯作者:李慧丽,E -mail :lhl117@.A case of morning glory syndrome and literature reviewCHEN Zhiwei 1,LI Huili 2*,YANG Jiao 2,JING Yu 2,CHEN Jinqiang 2(1.Graduate School,Guizhou University of Traditional Chinese Medicine,Guiyang 550002;2.Ophthalmology Department,Chongqing Traditional Chinese Medicine Hospital,Chongqing 400021,China)ABSTRACT:Morning glory syndrome (MGS)is a kind of congenital abnormal development of the optic papilla,which is rare in clinic.At present,great progress has been made in the study of its pathogenesis,clinical auxiliary examination,treatment and prognosis at home and abroad.In this paper,a case of clinically diagnosed MGS is reported,and the latest research progress of MGS is reviewed by literature retrieval,in order to provide reference for clinical treatment.KEYWORDS:morning glory syndrome;literature review;abnormal development of the optic papilla牵牛花综合征1例并文献复习陈治威1,李慧丽2*,杨娇2,景域2,陈进强2(1.贵州中医药大学研究生院,贵州贵阳,550002;2.重庆市中医院眼科,重庆,400021)摘要:牵牛花综合征(MGS )作为一种先天性视乳头发育异常疾病,临床罕见,目前国内外对其发病机制、临床辅助检查、治疗及预后的研究都取得了较大进展。
糖化血红蛋白检测在2型糖尿病诊断中的应用效果

·医学检验·DIABETES NEW WORLD糖尿病新世界糖尿病新世界2021年3月作为一种常见的内科疾病,2型糖尿病具有很高的发病率。
2型糖尿病患者在发病后若是没有得到及时有效的治疗,病情会不断加重,而且很容易出现周围神经病变、糖尿病足、糖尿病肾病等一系列的并发症,在严重的情况下甚至会危及其生命,极大地影响到了患者的身体健康,而且其生活质量也会不断下降[1]。
由于我国人民饮食结构的变化,2型糖尿病在我国的发病率变得越来越高,成为威胁我国人民身体健康的重要基础疾病之一,在这一背景下,如何有效地诊断和治疗2型糖尿病受到临床上的普遍重视。
为了能够及早地针对糖尿病患者进行治疗和干预,必须要做到早诊断、早确诊,只有这样才能够进一步保证糖尿病患者的身体健康,降低并发症的发生率[2]。
相对于正常健康人群而言,2型糖尿病患者具有异常升高的糖化血红蛋白水,平因DOI:10.16658/ki.1672-4062.2021.05.063糖化血红蛋白检测在2型糖尿病诊断中的应用效果王超济宁市中医院检验科,山东济宁272000[摘要]目的对2型糖尿病诊断中糖化血红蛋白检测的作用进行探究。
方法于2019年4月—2020年3月选择该院收治的确诊为2型糖尿病的患者50例纳入研究,将其作为甲组。
同时选择同一时期的健康人员50名作为乙组。
对两组实施糖化血红蛋白检测,比较两组的糖化血红蛋白水平,从而分析在2型糖尿病诊断中糖化血红蛋白检测的价值。
结果甲组的糖化血红蛋白水平(8.8±1.2)%、空腹血糖水平(10.6±1.3)mmol/L 和餐后2h 血糖水平(15.3±5.5)mmol/L 均明显高于乙组糖化血红蛋白水平(5.1±0.6)%、空腹血糖水平(4.8±0.4)mmol/L 和餐后2h 血糖水平(6.6±1.3)mmol/L,差异有统计学意义(t=19.500、27.345、10.885,P<0.05)。
自发眼球内出血的磁共振影像及超声影像表现

·论著·自发眼球内出血的磁共振影像及超声影像表现李亚军肖立志周顺科肖满意高玲杨沛【摘要】目的提高自发眼球内出血磁共振影像(MRI )诊断的准确性。
设计回顾性病例系列。
研究对象自发眼球内出血患者6例。
方法回顾性分析经手术后病理证实的6例自发眼球内出血病例的影像资料,经灰阶超声检查6例,彩色多普勒检查5例,MR 检查6例,其中MR 增强检查5例。
主要指标病变形态、信号、强化特点、声像特点。
结果在MRI 图像上,病灶新月形1例,扁豆状2例,驼峰状3例。
短T1短T2、长T1长T2、短T1长T2信号各2例。
T2WI 上病灶有低信号环2例。
5例病灶内部均无强化。
其中2例病灶邻近眼环强化,1例病灶环形强化。
MRI 诊断正确2例,2例误诊为脉络膜黑色素瘤,2例误诊为肿瘤并出血;灰阶超声6例均诊断为肿块。
彩色多普勒超声4例诊断为出血,主要依据为病灶内无血流信号,1例诊断为肿物。
结论自发眼球内出血MR 信号多变,病灶内部无强化是其主要特点。
综合利用超声信息可以提高诊断的准确性。
(眼科,2010,19:105-108)【关键词】玻璃体出血;眼肿瘤;视网膜脱离;磁共振成像;声像图Magnetic resonance imaging and ultrasonography in 6cases of spontaneous ocular hemorrhage LI Ya -jun,XIAO Li -zhi,ZHOU Shun -ke,XIAO Man -yi,GAO Ling,YANG Pei.Second Xiangya Hospital,Center -South University,Changsha 410011,China Corresponding author:LI Ya -jun,Email:liyajun9966@【Abstract 】Objective To improve the accuracy with magnetic resonance imaging (MRI)diagnosis of spontaneous intraocular hemorrhage.Design Retrospective case series.Participants 6patients with spontaneous intraocular hemorrhage.Methods The image findings were retrospectively analyzed in 6patients confirmed by surgery with or without pathology.All of them were examined with ultrasonography and 5cases with color ultrasonography.MRI was performed in 6cases,and enhanced MRI in 5cases.Main Outcome Measures Configuration,signal intense,characteristics of enhancement signal and ultrasonograph.Results 1case was crescent shape on MRI of spontaneous intraocular hemorrhage,2cases were lenticular shape,3cases were hump shape.2cases showed high signal intensity on T1WI,and low signal on T2WI.2cases showed high signal on both T1and T2WI.2cases showed low signal on T1WI,and high signal intensity on T2WI.2cases presented a ring with hypointensity on T2WI.No enhancement was revealed within the lesions in 5cases.Liner enhancement was showed in 2cases;ring enhancement was showed in 1case.2cases were corrected diagnosed by MRI,2cases were misdiagnosed as melanoma,and 2cases were misdiagnosed as tumor concomitant hemorrhage,and all cases were diagnosed as tumor with ultrasonography.With color Doppler imaging 4cases were correctly diagnosed as hemorrhage based on without blood -flow signal,and 1case was diagnosed as tumor.Conclusions The MRI signal characteristic of spontaneous ocular hemorrhage is variable,and the main feature is no enhancement within the lesion.MRI combined with ultrasonography can make the diagnosis more correctly.(Ophthalmol CHN,2010,19:105-108)【Key words 】vitreous hemorrhage;eye neoplasms;retinal detachment;magnetic resonance imaging;ultrasonography作者单位:410011湖南长沙,中南大学湘雅二医院放射科(李亚军、肖立志、周顺科),眼科(肖满意、高玲),海南省海口市解放军187医院放射科(杨沛)通信作者:李亚军,Email :liyajun9966@典型的视网膜脱离合并出血呈V 形,其MR 的信号变化遵从血肿的衍变过程,比较有特征性,诊断不困难[1]。
R F I
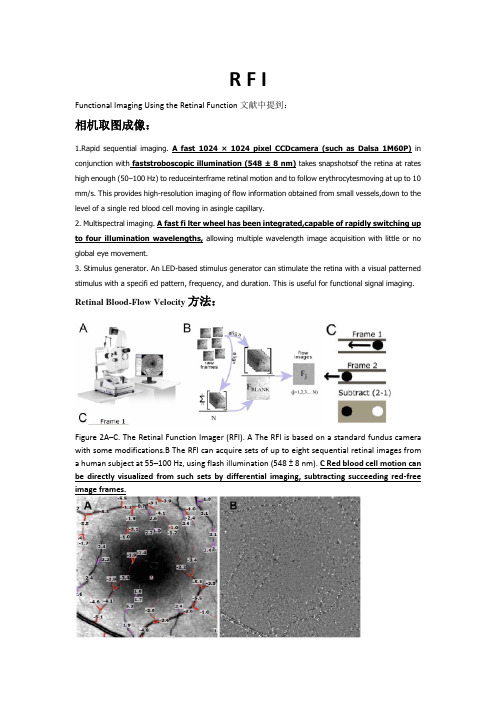
R F IFunctional Imaging Using the Retinal Function文献中提到:相机取图成像:1.Rapid sequential imaging. A fast 1024 ×1024 pixel CCDcamera (such as Dalsa 1M60P)in conjunction with faststroboscopic illumination (548 ± 8 nm) takes snapshotsof the retina at rates high enough (50–100 Hz) to reduceinterframe retinal motion and to follow erythrocytesmoving at up to 10 mm/s. This provides high-resolution imaging of flow information obtained from small vessels,down to the level of a single red blood cell moving in asingle capillary.2. Multispectral imaging. A fast fi lter wheel has been integrated,capable of rapidly switching up to four illumination wavelengths, allowing multiple wavelength image acquisition with little or no global eye movement.3. Stimulus generator. An LED-based stimulus generator can stimulate the retina with a visual patterned stimulus with a specifi ed pattern, frequency, and duration. This is useful for functional signal imaging. Retinal Blood-Flow Velocity方法:Figure 2A–C. The Retinal Function Imager (RFI). A The RFI is based on a standard fundus camera with some modifications.B The RFI can acquire sets of up to eight sequential retinal images from a human subject at 55–100 Hz, using flash illumination (548 ± 8 nm). C Red blood cell motion can be directly visualized from such sets by differential imaging, subtracting succeeding red-free image frames.Figure 3A, B. Quantification of retinal blood-flow velocity in the human retina. A RFI image showing calculated velocity in mm/s, obtained automatically. The image shows several arteries (reddish) and veins (pink) that were manually selected for quantification. A negative value indicates blood flow away from the heart, whereas a positive value indicates blood flow toward the heart. B Single frame of a flow movie from the same human retina. Erythrocyte clusters (black) and gaps (white) move through the small vessels shown here at an average velocity rate of 2 to 3 mm/s.[1]OPS成像设备OPS (Orthogonal polarized spectral imaging)imaging.Intraoperative OPS imaging was performed with the CYTOSCAN A/R (Cytometrics Inc, Philadelphia,Pa) equipped with a 5×lens and a chargecoupled device camera, resulting in a final 264-fold magnification on the video screen. The technique of OPS imaging consists of illuminating the tissue with linearly polarized light and processing the reflected light through an orthogonally placed polarized analyzer. The conjunctiva was epi-illuminated with light of a specific wavelength (548 nm) at which oxyhemoglobin and desoxyhemoglobin absorb equally (isobestic point), focusing on a region of approximately 1 mm diameter and a penetration depth of 1 mm. Light remitted from the conjunctiva forms an image of the illuminated region within a target of the video camera. The polarization analyzer selectively allows depolarized photons scattered within the tissue to pass the analyzer and contribute to generation of the image. Generation of the OPS image with reflected light requires scattered light for illumination and absorbed light for contrast enhancement. Thus hemoglobin-containing structures such as the conjunctival microvasculature are visualized as dark areas, and the surrounding tissue void of hemoglobin appears as a light area.[2]OPS成像原理:OPS 通过浅表组织对偏振光的散射在被观测组织的内部产生一个虚拟的光源来实现组织内部微血管的照明成像。
眼睛检查英文作文

眼睛检查英文作文Title: Importance of Regular Eye Examinations。
In today's fast-paced world, where screens dominate our daily lives, our eyes are constantly subjected to strainand stress. Hence, regular eye examinations are paramountto maintaining good eye health. In this essay, I will delve into the significance of eye examinations, their benefits, and why everyone, irrespective of age or vision condition, should prioritize them.Firstly, eye examinations serve as proactive measuresto detect potential eye problems at their early stages. Many eye conditions, such as glaucoma, macular degeneration, and diabetic retinopathy, often manifest without noticeable symptoms in their initial phases. Through comprehensive eye exams, optometrists can identify these issues before they progress into more severe complications, thereby enabling timely intervention and treatment. Early detection not only preserves vision but also prevents irreversible damage tothe eyes.Furthermore, eye examinations are not solely about vision correction; they also offer insights into one's overall health. The eyes provide a window to systemic health conditions, including diabetes, hypertension, and even certain cancers. For instance, diabetic retinopathy is a common complication of diabetes that affects the eyes. By monitoring changes in the retina during an eye exam, optometrists can detect signs of diabetes and prompt patients to seek medical attention for further evaluation and management. Similarly, hypertension can cause retinal blood vessel changes, which are detectable through a comprehensive eye exam. Thus, regular eye examinations contribute not only to ocular health but also to the early detection of systemic diseases.Moreover, eye examinations are essential for maintaining optimal vision and visual comfort. With the widespread use of digital devices in both personal and professional settings, many individuals experience digital eye strain, characterized by symptoms like eye fatigue,headaches, and dry eyes. Routine eye exams allow optometrists to assess visual acuity, screen for refractive errors like nearsightedness, farsightedness, and astigmatism, and prescribe corrective measures such as glasses or contact lenses. Additionally, optometrists can provide personalized recommendations to mitigate digital eye strain, such as the 20-20-20 rule (taking a 20-second break every 20 minutes and looking at something 20 feet away) and proper ergonomics for computer use. By addressing these issues proactively, individuals can enhance their visual comfort and productivity in today's digital-centric world.Furthermore, eye examinations play a crucial role in promoting eye safety and preventing injuries. Occupational hazards, sports-related activities, and even everyday tasks pose risks to ocular health. Regular eye exams allow optometrists to assess the need for protective eyewear and educate patients on eye safety measures. Whether it's wearing safety goggles in industrial settings, sports goggles during athletics, or sunglasses with UV protection outdoors, preventive measures can significantly reduce therisk of eye injuries and long-term complications.In conclusion, regular eye examinations are indispensable for safeguarding eye health, detecting systemic diseases, optimizing visual comfort, and preventing injuries. As the adage goes, "prevention is better than cure." By prioritizing routine eye exams, individuals can take proactive steps towards preserving their vision and overall well-being. Remember, your eyes are precious—don't wait until you experience problems to seek professional care. Schedule your next eye exam today and invest in a lifetime of healthy vision.。
停用羟苯磺酸钙导致肌酐检测值突然升高1例及文献综述
停用羟苯磺酸钙导致肌酐检测值突然升高1例及文献综述发表时间:2018-08-16T15:28:51.567Z 来源:《中国误诊学杂志》2018年第13期作者:张童燕1 杜亚君2 王志奇3 陈孝辉4 付滨*1(通[导读] 羟苯磺酸钙被公认为对肌酐、尿酸、甘油三酯、总胆固醇、高密度脂蛋白及低密度脂蛋白有负向影响,因此在临床工作中应注意此类患者的用药及其对肌酐等重要指标的影响。
1.天津中医药大学第二附属医院肾病风湿科 300250;2.天津泰达普华医院;3.牡丹江市中医医院内分泌科;4.天津市宝坻区中医院血液透析室摘要:羟苯磺酸钙作为眼科用药,有调整和改善毛细血管壁的通透性和柔韧性、降低血粘度、减少血小板聚集、抑制血栓形成和改善淋巴液回流等作用,常用于糖尿病眼病的治疗。
慢性肾功能衰竭中糖尿病是重要病因之一,因此肾病科临床工作中经常要与服用羟苯磺酸钙的患者进行接触。
羟苯磺酸钙被公认为对肌酐、尿酸、甘油三酯、总胆固醇、高密度脂蛋白及低密度脂蛋白有负向影响,因此在临床工作中应注意此类患者的用药及其对肌酐等重要指标的影响。
关键词:羟苯磺酸钙;肌酐;负性影响Acute elevation of creatinine after Calcium dobesilate withdrawn:A case study and literature reviewZhang Tong-Yan1,Du Ya-Jun2,Wang Zhi-Qi3,Chen Xiao-Hui4,Fu Bin*11Second affiliated hospital of Tianjin university of traditional Chinese medicine2Tianjin TEDA Puhua hospital3Mudanjiang traditional Chinese medicine hospital4Tianjin Baodi district traditional Chinese medicine hospitalContact author:69 Zengchan Road,Hebei District,Tianjin;PD:300250;email:fubin5393@Abstract:Calcium dobesilate as an ophthalmological agent has the effects of adjusting and improving the permeability and flexibility of the capillary wall,reducing the blood viscosity,reducing platelet aggregation,inhibiting thrombosis and improving the return of lymph fluid,and is often used for the treatment of diabetic eye diseases. . Diabetes is one of the most important causes of chronic renal failure. Therefore,the nephrologist is often in contact with patients taking calcium dobesilate. Calcium dobesilate is recognized as having a negative effect on creatinine,uric acid,triglycerides,total cholesterol,high-density lipoprotein,and low-density lipoprotein. Therefore,attention should be paid to the use of these drugs and their effect on creatinine in clinic.Keywords:Calcium dobesilate;creatinine;negative effect病例描述:黄XX,男,28岁,主因发现肌酐升高3年,为明确病因入院。
骨髓间充质干细胞移植治疗缺血性心脏病的研究进展
Tropel P.Platet N,Platel JC,et a1.Functional neuronal differentia. tion of bone marrow.deriverJ me∽nchymal stem ceils J i.Stem
Cells,2006,24(12):2868.2876. Tomita M.Mori T,Maruyama K.et 02.A comparison of neural dif- fercntiation and retinal transplantation with bone marrow-derived cells and retinal progenitor cells[J].Stem Cells。2006,24(10): 2270-2278.
[6]Pittenger MF,Mackay AM,Beck SC,et a1.Muhilineage potential of aduh human mesenchymal stem cells j I.Science,I 999,284 (5411):143·147.
[7]Vogel W,Grunerach F,Messam CA,et a1.Heterogeneity among hu-
2002.5(5):392—394.
收稿日期:2009.-06-06修回日期:2009—10-30
骨髓间充质干细胞移植治疗缺血性心脏病的研究进展
活体情况下评价载脂蛋白A1对小鼠视网膜血管生成的影响
第42卷第2期2021年3月Vol.42No.2March2021中山大学学报(医学科学版)JOURNAL OF SUN YAT⁃SEN UNIVERSITY(MEDICAL SCIENCES)活体情况下评价载脂蛋白A1对小鼠视网膜血管生成的影响苏焜仪,胡安娣娜,陈珠婷,连玉,吕林,胡洁(中山大学中山眼科中心//眼科学国家重点实验室,广东广州510060)摘要:【目的】用眼底照相及荧光造影探讨载脂蛋白A1(apoA1)正常生理状态下及缺氧状态下对小鼠视网膜血管生长情况的影响。
【方法】在正常生理条件(常氧)下,通过apoA1+/+鼠、apoA1-/-鼠与C57/BL6J小鼠对比,分别在第17天末(幼年期)、8周龄(成年期)、20周龄(中老年期),进行体内实验:①小鼠眼底照相(观察血管形态)及②荧光造影(FFA)(观察血管渗漏情况,分析视网膜平均血管密度、孔隙率及连接点个数);并分别制备它们缺氧条件下的氧诱导的视网膜病变(OIR)模型进行实验:①眼底照相;②荧光眼底血管造影。
【结果】常氧下,①眼底照相示3种小鼠不同时期视网膜血管形态相似;②FFA提示3种小鼠不同时期毛细血管分布均匀,无明显无灌注区及荧光渗漏等表现。
组间无统计学差异(P血管密度=0.59>0.05,P孔隙率=0.52>0.05);缺氧状态下,①眼底照相示:视网膜主要血管明显迂曲扩张;②FFA示3组均有静脉串珠样改变,毛细血管分布不均,见无灌注区及荧光渗漏等表现。
对血管密度、孔隙率和连接点个数进行分析,组间有显著差异(P血管密度=0.0016<0.01,P孔隙率=0.0019<0.01,P连接点个数=0.0013<0.01)。
【结论】通过小鼠视网膜成像系统在活体情况下发现在生理条件下,apoA1基因表达量的多少对小鼠正常视网膜血管生长无影响。
缺氧状态下,apoA1表达量增高可使小鼠视网膜无灌注区面积减少,荧光渗漏减少。
空洞残差U型网络用于视网膜血管分割
2021577青光眼是世界上第一种不可逆转的致盲性眼科疾病,也是成为世界上第二大致盲疾病。
青光眼疾病的早期并没有明显的症状,往往到晚期才会暴露出来,但一旦发生将不可逆转。
由于其隐蔽性强、致盲率高以及危空洞残差U型网络用于视网膜血管分割胡扬涛1,裴洋2,林川1,李世成2,易玉根21.中国人民解放军联勤保障部队第908医院眼科,南昌3300022.江西师范大学软件学院,南昌330022摘要:青光眼是一种不可逆转的致盲性眼科疾病,应当早发现和早治疗。
但人工诊断是费时费力的过程,而且受基层医疗资源的限制,人工诊断很容易产生漏诊和误诊的现象。
因此,利用深度学习技术辅助诊断眼疾病具有重大意义。
如何更为准确且有效地分割视网膜血管成为眼疾病辅助诊断的研究热点问题。
于是,基于U型网络(U-Net)提出一种新的网络结构称为空洞残差U型网络(Atrous Residual U-Net,AR-Unet)。
在AR-Unet中,为了避免U-Net 中的梯度消失以及图像结构信息丢失等问题,将残差网络(ResNet)引入到U-Net中。
为了扩大感受野和提高物体间的相关性,再将空洞卷积(Atrous Convolution)整合到U-Net中,从而使得血管分割更加精确。
在三个公开的彩色眼底图像数据集DRIVE、STARE和CHASE上进行大量实验,结果表明在不同评价指标下,AR-Unet方法的性能均要优于大多数对比方法。
关键词:视网膜血管分割;空洞残差U型网络;空洞卷积;U型网络;残差网络文献标志码:A中图分类号:TP391doi:10.3778/j.issn.1002-8331.2009-0215Atrous Residual U-Net for Retinal Vessel SegmentationHU Yangtao1,PEI Yang2,LIN Chuan1,LI Shicheng2,YI Yugen21.Department of Ophthalmology,No.908Hospital of the Peoples Liberation Army Joint Logistics Support Force,Nan-chang330002,China2.School of Software,Jiangxi Normal University,Nanchang330022,ChinaAbstract:Glaucoma is an irreversible blinding ophthalmic disease,which should be found and treated promptly.However, the process of artificial diagnosis is time-consuming and laborious.Furthermore,it is prone to missed diagnosis and misdi-agnosis due to the limitation of basic medical resources.Therefore,auxiliary diagnosis of eye diseases using deep learning technology has become more significant.How to segment the retinal blood vessels more accurately and effectively become a hot research problem for auxiliary diagnosis of eye diseases.To this end,a novel network structure based on U-Net named Atrous Residual U-Net(AR-Unet)is proposed.In AR-Unet,the Residual Network(ResNet)is firstly intro-duced into U-Net for the sake of avoiding the vanishing gradient and the loss of image structural information.Then,the Atrous Convolution is integrated into U-Net for expanding the receptive field and improving the correlation between objects, which makes the segmentation of blood vessels more accurate.At last,extensive experiments are conducted on three public available color fundus images databases including DRIVE,STARE and CHASE.The experimental results demon-strate that the performance of the proposed AR-Unet method is better than that of well-known methods under different evaluation criteria.Key words:retinal vessel segmentation;Atrous Residual U-Net(AR-Unet);atrous convolution;U-Net;Residual Net-work(ResNet)基金项目:国家自然科学基金(62062040);江西省科技厅自然科学基金(0202BABL202016);江西省教育厅自然科学基金(GJJ191689)。
- 1、下载文档前请自行甄别文档内容的完整性,平台不提供额外的编辑、内容补充、找答案等附加服务。
- 2、"仅部分预览"的文档,不可在线预览部分如存在完整性等问题,可反馈申请退款(可完整预览的文档不适用该条件!)。
- 3、如文档侵犯您的权益,请联系客服反馈,我们会尽快为您处理(人工客服工作时间:9:00-18:30)。
Fax +41 61 306 12 34E-Mail karger@karger.chE URETINA – Review O phthalmologica 2013;229:61–74D OI:10.1159/000338186R etinal Blood Flow Evaluation C onstantin J. Pournaras a Charles E. Riva baD epartment of Ophthalmology, Vitreo-Retinal Unit, Geneva University Hospitals, G eneva , andbP rof. em., Medical School, University of Lausanne, L ausanne , Switzerlandmeasure the velocities of blood in discrete areas of the reti-nal tissue microcirculation. Adding a scanning capability, a spatial map of velocities across the retinal tissue is obtained. The blue-field simulation technique allows the quantifica-tion of the velocity, number and velocity pulsatility of leuko-cytes moving in the retinal capillaries of the macular region. With color Doppler imaging, the peak systolic and end-dia-stolic values of blood velocity in the ophthalmic and central retinal artery are measured, from which a resistivity index is obtained. These techniques may help better understand the role of altered retinal blood flow and its regulation in the pathogenesis of retinal diseases of vascular origin. C opyright © 2012 S. Karger AG, Basel I ntroduction T he retinal circulation supplying the fundus of the eye can be observed using optical instruments that allow the recording of either the vessel diameter or the passage of dyes through the human retinal vascular system, from which the first quantitative measurements of retinal he-modynamics were derived [1].T echnological developments in the field of optics and lasers have since led to a variety of noninvasive tech-K ey Words R etinal blood flow ؒ Retinal Vessel Analyzer ؒ Laser Doppler velocimetry ؒ Laser Doppler flowmetry ؒ Laser speckle flowgraphy ؒ Color Doppler imaging ؒ Retinal ischemic microangiopathyA bstractM uch of our basic knowledge of retinal blood flow regula-tion is based on data obtained from animal experiments through the use of invasive techniques. However, during the last decades, major developments in the field of optics and lasers have led to a variety of noninvasive techniques, which have been applied to the human eye for the investigation of retinal hemodynamics, and more specifically the regulation of retinal blood flow in response to a number of physiologi-cal and pharmacological stimuli. The Retinal Vessel Analyzer has markedly simplified the measurement of the diameter of retinal vessels, as well as the change in this diameter evoked by various physiological stimuli (dynamic measurements). Bidirectional laser Doppler velocimetry allows the measure-ment of absolute red blood cell centerline velocity, which, when combined with the diameter allows the calculation of retinal blood flow in the main retinal vessels. Laser Doppler flowmetry and laser speckle flowgraphy are techniques that Received: February 22, 2012A ccepted: February 22, 2012P ublished online: December 18, 2012 OphthalmologicaProf. Constantin J. Pournaras La Colline, Ophtalmologie Avenue de La Roseraie, 76ACH–1205 Genève (Switzerland)©2012 S. Karger AG, Basel 0030–3755/13/2292–0061$38.00/0Accessible online at:e d b y : .149 - 2/24/2014 10:59:18 A MP ournaras/RivaOphthalmologica 2013;229:61–7462niques, which have permitted the investigation of variousparameters pertaining to human ocular hemodynamics and the response of these parameters to a number of physiological and pharmacological stimuli. T hese techniques have provided information on hu-man retinal circulatory physiology and have led to new, important information on the role of retinal blood flow in the pathogenesis of retinal diseases of vascular origin.G eneral Hemodynamic Considerations B lood flow (BF) through a blood vessel depends upon the perfusion pressure (PP) , i.e. the pressure that drives blood through the vessel, and the flow resistance (R)gen-erated by the vessel. For an incompressible uniform vis-cous liquid (dynamic viscosity, ) flowing through a cy-lindrical tube (length L ) with radius (r),B F is given by the Hagen-Poiseuille law: B F = P P /R , where R = L /2 r4.Many factors make it difficult to directly apply this lawto a microvascular bed. These include thedependence on local hematocrit, the changes in the velocity profile ofthe red blood cells (RBCs) and shear rate at branchingsand junctions and others.A nother approach at characterizingB F through a sys-tem of blood vessels is based on Murray’s law[2],which says that through each vessel of a circulatory system with optimal design (blood flowing with minimal loss of en-ergy) B F = k (r 3 /Ί ). The constant k depends upon L and r [3]. T he mean ocular P P driving blood through the eye is the mean blood pressure in the ophthalmic artery minus the pressure in the veins leaving the eye. The venous pres-sure is close to the intraocular pressure (IOP)[4].With the subject in sitting or standing position, mean ocularP P is about 2/3 of the mean brachial artery blood pressure (ABP),i.e. P P = 2/3 [ A BP d iast + 1/3 ( A BP s yst – A BP d iast)] – I OP. The factor 2/3 stands for the drop in pressure between the heart and the ophthalmic artery. A BP d iast a nd A BP s yst a re the brachial A BP during diastole and systole, respec-tively. It is understood that this expression for P P is based on a group average and therefore provides only an ap-proximate value for a single individual. The value of has been experimentally related to hematocrit at defined shear rates. It diminishes with increasing shear rate to become almost constant with further decreases of this rate[5] . An increase in viscosity (e.g. in cases of hyper-globulinemia, high hematocrit, leukemia, sickle cell ane-mia) substantially alters retinal B F , which may induce stasis in the veins and ultimately their occlusion [6] . T he main resistance to B F is located in the arterioles with half of the resistance in vessels with a radius of 10–25 m . As R i s proportional to 1/ r4, even a small change in r w ill have a considerable effect on R ; r and consequently the diameter (D) of a vessel is modulated by the interac-tion of multiple systemic and local control mechanisms affecting the tone of the smooth muscle cells and perhaps the pericytes.A lterations in retinal vessel D have been linked to sev-eral vascular related pathologies, including systemic hy-pertension and diabetes, in large population-based stud-ies. Abnormal retinal vascular regulation may also be identified through metabolic provocation, such as flicker stimulation of the retina. Thus, the ability to obtain exactmeasurements of D is of crucial importance to our under-standing of retinal B F and its regulation during the evo-lution of retinal ischemic microangiopathies. N oninvasive Techniques Used in Physiological and Clinical Research I n the last decades the development of noninvasive techniques has led to new and important information on retinal hemodynamics and B F r egulation in the healthy and diseased human eye. These techniques include themeasurements of the following retinal hemodynamic pa-rameters: D , using photography or video recording and the newly developed Retinal Vessel Analyzer (RVA); mean circulation time (MCT) and arteriovenous passage time (AVP) of fluorescein through retinal segments bythe dye dilution technique; velocity and number of leu-kocytes in the macular area by the blue-field simulation technique; velocity of fluorescent leukocytes and hyper-fluorescent segments in retinal capillaries by video angi-ography; velocity and RBC flow in the main retinal ves-sels using bidirectional laser Doppler velocimetry (BLD V)combined with the measurement of D ; blood flow in the tissue of the optic disk and peripapillary retina by laser D oppler flowmetry (LD F) and central retinal arterial blood velocity by color Doppler imaging. M easurement of D of Retinal VesselsD has been measured in the past from magnified fun-dus photographs using a caliper or by scanning acrossthe vessels[7, 8] . In recent years, the RVA has markedly simplified this measurement [9, 10] , allowing also the quasi-continuous recording of D changes evoked by var-ious physiological maneuvers (dynamic measurements)( f ig. 1 ).e d b y : .149 - 2/24/2014 10:59:18 A MR etinal Blood Flow Evaluation Ophthalmologica 2013;229:61–7463I n principle, the RVA assesses D by analyzing the brightness profile of the vessel. This assessment is based on the fact that the green light used for fundus illumina-tion is mostly absorbed by the RBCs within the retinal vessels, whereas the environment mostly reflects this light. Thus, the RVA measures mainly the width of the RBC column within the selected vessels.T he interpretation of the vessel brightness map is hampered by the possible occurrence of several distur-bances, such as shadowing structures or reflections on the vessel surface, which complicate the analysis. To over-come this problem, the RVA uses an adaptive algorithm based on variation in brightness, which compensates for reflections and other disturbances that occur during measurement.W ith the RVA, a vessel is scanned 25 times/s within a rectangular window having a length of about 1.5 mm and a width slightly larger than the diameter of the vessel. Af-ter determination of the angle between the vessel and the direction of the window, D is calculated automatically. The RVA is particularly well suited for the evaluation of the temporal dynamic of D in response to various physi-ological stimuli, pharmacological and therapeutic agents ( f ig. 1 ). The technique requires dilatation of the pupil. Us-ing vessels with a D 190 m , it is possible to obtain a pre-cision in D of the order of 1 m . Temporal resolution of D r ecordings is about 40 ms.S tudies have reported that long- and short-term repro-ducibility of D m easurements is slightly higher for retinal veins than for retinal arteries, probably reflecting a better optical resolution of veins (in comparable fundus loca-tions, veins are larger than arteries) or differences in the absorption properties of arteries compared with veins[10]. T he short-time coefficient of variation (CV) of D was assessed in a group of 9 healthy volunteers. The CVs of D f or measurements taken 12 min apart have been reported to be 1.3 and 2.6% for retinal veins and retinal arteries, respectively. The CVs for the day-to-day variability of D were 4.4% for retinal veins and 5.2% for retinal arteries inthe same group of volunteers[11]. D o f retinal veins was assessed continuously for 5 min in 12 healthy volunteers and the measurements were re-peated at the same vessel location after 2 h. This resulted in a short-term CV of D o f 1.5% for retinal veins. The same study assessed long-term reproducibility compar-ing measurements at baseline and after 1 month. The re-ported CV of D w as 2.8% for retinal veins[12] . CV of D ,d etermined for short-term (less than 2 h) and long-term (2 weeks), was 1.5 and 2.8%, respectively[10] .F licker StimulationF ollowing the first demonstration that D of retinal vessels can be modulated by flickering the fundus illumi-nation light [13] the use of the RVA has permitted the de-termination of the time course of the flicker-induced Dr esponse and of the effect of varying the flicker frequen-cy on this response[14] .T here is now compelling evidence from studies in an-imals and human subjects that visual stimulation with flickering light increases retinal vessel diameter, retinal blood flow and optic nerve head (ONH) blood flow in humans [15] . Therefore, stimulation with flicker light has been used as a physiological provocation to investigate the regulation of vascular tone. Further investigations in a large number of subjects might generate new insight into the reliability of flicker data. This is important for the design and planning of future studies.abF ig. 1. a The RVA device consists of a retinal camera, a charge-coupled device (CCD)-measuring camera for electronic onlineimage acquisition, and a computer for system control analysis and archiving of the D data. In general, a vessel section of about 1.5 mm in length is scanned at a frequency of 25 images/s. b Time course variation of D of a retinal vein measured by the RVA over a given vessel length from P1 to P2. Vein constriction is due to inhalation of 100% oxygen by the subject.e d b y : .149 - 2/24/2014 10:59:18 A MP ournaras/RivaOphthalmologica 2013;229:61–7464C linical Use M easurements ofD are important, not only for scien-tific purposes, but also because several large-scale epide-miological studies have consistently reported the exis-tence of a correlation between systemic disease factors and retinal vessel D . In particular, increased systemic blood pressure is reflected in the generalized arterial va-soconstriction of retinal vessels[16] . Thus, there is in-creasing evidence that changes in the retinal vessel D not only carry information about the retinal circulation per se, but may also reflect systemic pathologies as such changes have been shown to predict risk for coronaryheart disease, stroke and stroke mortality[17, 18].Pooled data from the Beaver Dam Eye Study and the Blue Moun-tains Eye Study also showed that smaller arterial D and larger retinal venous D are associated with increased riskfor stroke mortality[19] . These data clearly support the suggestion that retinal vessel D may serve as a predictor for events in other vascular beds, such as in the heart or brain.I t has been shown that changes in retinal vessel D ob-served during systemic pathologies may be influenced by treatment. In particular, D was found to be significantly reduced in diabetic patients who underwent laser treat-ment[20] . This finding has been interpreted as a sign for decreased blood flow due to better oxygenation of the photocoagulated tissue.D ye Dilution Tec hniqueT he dye dilution technique allows the determination of M CT , i.e. the average time it takes for dye molecules, such a fluorescein injected into the circulation, to travel from the entry to the exit of a microvascular segment. The segment is assumed to have a single inflow (feeding artery) and a single outflow (draining vein). The passage of fluorescein through the artery and corresponding vein (arterial and venous dilution curves) is recorded by de-tecting photographically, photoelectrically, or by video the fluorescence intensity emitted by the dye, when the fundus is illuminated with light at wavelengths within the range of the excitation spectrum of fluorescein (blue). A barrier filter prevents excitation light from reaching the detection system. The dye dilution technique provides re-liable data on M CT only if the vascular segment, the in-jected dye, the mode of recording of the dilution curves, and the correction for recirculation of the dye satisfy spe-cific conditions[21–23] . In the application of this tech-nique to the eye, particularly in cases of retinal vascular pathology (for instance, in proliferative retinopathy, dif-fusion of fluorescein from the retinal vessels may distortthe dilution curves), the measured M CT must be regard-ed as an approximation of true M CT [24].U sing scanning laser ophthalmoscopy, additional pa-rameters from the fluorescence intensity time course have been determined, such as the mean velocity of the dye in a retinal artery, which has been calculated from the appearance time of the dye front at two sites along a ves-sel and the distance between the sites, and the A VP,which is the time difference between a reference point at the temporal retinal artery and the first appearance in a veinadjacent to the artery[25] . In contrast to M CT ,A VP f avors strongly the measurement of passage times of the dye through the shortest segment between an artery and avein close to the papilla[24] . A study in monkeys, undertaken to determine the cor-relations between M CT and A VP and retinal B F , the latter measured by labeled microspheres, showed that these correlations were not statistically significant (p 10.05) [26] , even when the M CT was calculated using an impulseresponse technique[27] . Clearly, M CT and A VP data should not be interpreted in terms of B F .V elocity of Leukocytes T he velocity of leukocytes (V l euk) has been measured by means of scanning laser ophthalmoscopy after tag-ging the cells with various dyes and tracking their motion in the retinal capillaries, veins and arteries on video im-ages [28–32]. V l euk of leukocytes moving in perifoveal retinal capil-laries (diameter 7–11 m ) measured by scanning laserophthalmoscopy was reported to be 1.4 mm/s[31].Using the blue-field simulation technique, which is based on the entoptic observation of one’s own leukocytes mov-ing in the macular area of the retina, it is possible to de-termine quantitatively the number (N l euk),V l euk ,and V l euk pulsatility of these particles[33] . With this tech-nique, subjects are asked to compare and match the global motion of a field of computer-simulated leuko-cytes displayed on a video monitor to the global motion of their own leukocytes by adjusting with potentiome-ters N l euk ,V l euk , and V l eukp ulsatility (variation of the speed during the cardiac cycle) of the simulated leuko-cytes [34] . Mean V l euk o btained under physiological con-ditions by various investigators ranged from 0.23 to 1.9m /s [35–39] . The motion of these leukocytes is pul-satile in phase with the heartbeat, with an averageV l euk, systole /V leuk, diastole of 2.8 [33] .V isual acuity must be better than 20/50 for a reliable measurement[40] . The ability of a subject to do the blue-field simulation test can be assessed by having subjectse d b y : .149 - 2/24/2014 10:59:18 A MR etinal Blood Flow Evaluation Ophthalmologica 2013;229:61–7465match the speed and number of two simulated leukocyte motions displayed on computer screens. Blue-field data have been confirmed by the objective scanning laser oph-thalmoscope-adaptive optics imaging technique [41] .B idirectional Laser Doppler Velocimetry B LDV allows the measurement of a bsolute b lood ve-locity. BLDV is based on the Doppler effect ( f ig. 2 ) [42].Retinal B F (in l /min) in the main retinal vessels is cal-culated from the centerline velocity (V m ax) of RBCs [43].The measurement is independent of the direction of theincident light defined by K i n (f ig. 2)[43, 44].Combined with D measurements of these vessels mean B F i s calcu-lated as ! D 2 ! V m ean /4.V m ean represents an average of the RBC velocities over the vessel cross section. For aparabolic velocity profile (see below), V m ean =V m ax /2.The average RBC velocity during the heart cycle is obtained by integrating V m ean over this cycle.I n straight portions of the first-order retinal arteries and veins of the human eye, the velocity profile of RBCs does not differ significantly from the parabolic shapeduring both systole and diastole ( f ig. 4 )[45–48].D evia-tions from the parabolic profile increase, however, with the diminution of the diameter of the vessels and a cor-rection factor in the formula given in f igure 3 is neededto improve the fit[47, 49] . At retinal arterial branchings and venous junctions marked deviations from the para-bolic profile are expected, as illustrated by measurements using the techniques of confocal scanning laser Dopplervelocimetry ( f ig. 4 )[47]. A veraged over the cardiac cycle, V m ax ranges from ap-proximately 7 to 35 mm/s in arteries with a D between 40 and 130 m and from 5 to 25 mm/s in veins with a D be-tween 60 and 180 m [50–52]. Similar values were found in the primate retina with the targeted dye delivery tech-nique[53, 54] . In normal human and primate monkey eyes, V m ax increases linearly withD , as found in most vas-cular beds[50, 54] .R etinal B F represents only about 4% of total ocular B F [55]. In humans, recent measurements of total retinal B F (40.8–52.9 l /min) using Fourier-D omain OCT (FD -OCT) [56] are in the range of values obtained by BLDV[50] . Retinal B F calculated from BLDV is larger in the temporal human retina than in the nasal region, suppos-edly due to the larger size (by 20–25%) and higher meta-abF ig. 2. a Doppler effect. The frequency of laser light scattered byan RBC (moving at speed V m ax ) is shifted by an amount ⌬ f m ax compared to the frequency of the light incident (f i ) on the RBC. ␣ i and ␣ s are the angles between V m ax and the directions of the incident and scattered light, respectively. is the wavelength ofthe incident light [with permission from ref. 42].b Principle of bidirectional LDV (BLDV). Laser light scattered from the RBCsis detected along two directions: K s 1 and K s 2 (angle␣between them). is the angle between the plane of the vessel at the site of measurement and the direction of the velocity. V m ax, the center-line velocity of the RBCs, is determined from the maximum shifts in the Doppler shift power spectrum obtained in each scattering direction and the geometrical scattering parameters. The mea-surement is independent from the direction of the incident light defined by K i n [with permission from ref. 43].max 1K o l d d V d V R ¯µ µ¡° ¡°¡°¢±F ig. 3. Central velocity (V m ax) of RBCs (proportional to cutoff fre-quency of Doppler shift power spectrum) in a retinal artery (di-ameter, 100 m ). V( d ) is the velocity at distance (d) from the innerwall, d 0 the position of the vessel center.K is 2.38 in the systolic, 1.94 in the diastolic phase [from ref. 47, with permission].e d b y : .149 - 2/24/2014 10:59:18 A MP ournaras/RivaOphthalmologica 2013;229:61–7466bolic rate of the former. B F values in the superior and inferior hemispheres were found to be similar. In con-trast, B F in the superior retinal hemisphere does not ap-pear to differ from B F in the inferior hemisphere [50, 57–59]. This pertains also to B F in the superior and inferior parts of the macular region[60]. I n normal subjects, B F differs between studies, with values between 30 and 46 l /min [50, 52, 56, 61, 62]and 65–80 ml/min[57, 59, 63] . By comparison, the micro-sphere injection technique provided volumetric flowrates of 25 and 34 l /min for the macaque monkey and50 8 39 l /min for the rhesus monkey[64, 65].A stabilized retinal laser Doppler instrument adapted to a fundus camera achieved excellent reproducibility of results andB F measurements in units of microliters per minute, indicating that the instrument can be used for reliable comparison of blood flow characteristics at dif-ferent retinal vascular sites in the same eye, at comparable sites in both eyes, and for comparison between patientsand healthy control subjects[66] .D oppler FD-OCTO CT provides high-resolution cross-sectional imag-ing and is commonly used in the diagnosis and manage-ment of retinal diseases. In addition to obtaining mor-phological images, OCT can also detect the Doppler shift of reflected light, which provides information on three-dimensional distribution of the axial velocity componentof blood in retinal vessels[67, 68] . For Doppler FD-OCT [69, 70] light reflected by moving blood induces a Doppler frequency shift that is proportional to the velocity com-ponent parallel to the axis of the probing beam. This fre-quency shift introduces a phase shift in the spectral in-terference pattern that is captured by a line camera. The spectral information is converted into complex axial scans containing both amplitude and phase, using the fast Fourier transform. The phase differences between se-quential axial scans at each pixel are calculated to deter-mine the D oppler shift. In vivo flow measurements in branch retinal vessels have been reported using DopplerFD-OCT[71, 72].D oppler FD -OCT combined with a double circular scan pattern around the optic disk to rapidly measure to-tal retinal B F has been used in a group of normal humansubjects[56] . Four pairs of circular scans that transected all retinal branch vessels were completed in 2 s. Total ret-inal B F was obtained by summing the flows in the branch veins. Total retinal B F could be measured in 8 of 10 sub-jects: mean (SD) = 45.6 (3.8) l /min (range 40.8–52.9 l /min). The coefficient of variation for repeated measure-ments was 10.5%. These flow values are within the range previously established by laser Doppler velocimetry com-bined with D measurements [56] .L aser Doppler Flowmetry I n a tissue, such as the optic disk, B F can be measuredby using LDF[73] . Two measurement modes have been implemented: In the first mode, a laser beam is focused onto the tissue and the light scattered from this tissue isdetected to obtain the Doppler shift power spectrum re-F ig. 4. Velocity profiles of RBCs in a retinal vein downstream of a venular junction. At a distance of about one (A) and two (B) ves-sel diameters from the junction, the velocity profiles are asym-metric. At 5 diameters downstream from the junction (C), the profile is symmetric, although still significantly blunted. D ata collected in the systolic (closed circles) and diastolic (open circles) phase of the cardiac cycle. The continuous line (C) is the fit ac-cording to the equation given in figure 3, with K = 2.38 8 0.5 in the systolic and 1.94 8 0.80 (95% CI) in the diastolic phase, re-spectively [from ref. 47, with permission].e d b y : .149 - 2/24/2014 10:59:18 A MR etinal Blood Flow Evaluation Ophthalmologica 2013;229:61–7467sulting from the motion of RBCs. Applying the theory of Bonner and Nossal[74] , the following flow parameters are derived from the Doppler shift power spectrum: V el ,the mean speed of the RBCs moving in the sampling vol-ume, V ol , the number of moving RBCs and B F = k ! V el! Vol , the total flux of RBCs in this volume. V el is ex-pressed in Hertz, and V ol and F in arbitrary units; k i s a constant of proportionality. With the second mode, scan-ning the laser beam across a two-dimensional area of the fundus provides an image of the RBC flux in the capillar-ies of the optic disk and peripapillary retina, as well as an intensity image of the perfused retinal vessels [75]( f ig. 5 ).L aser Spec kle FlowgraphyT he temporal variations of laser speckle resulting from the interference of laser waves scattered by the tissue can be used to determine the velocity of RBCs in the ONH, retinal and choroidal circulations[76, 77] . This la-ser speckle flowgraphy and the LDF approaches are dif-ferent ways of looking at the same phenomenon. Both techniques measure at a single point in the tissue. In both cases, adding scanning provides a map of the spatial ve-locity and flux[78, 79].O ne important point when applying these laser-based techniques is that the measured flux depends on the scat-tering and optical absorption properties of the tissue. Therefore, direct comparison between flux values from different eyes may not be valid due to variations in the scattering properties resulting from differences in tissuestructure and composition[80, 81] . Furthermore, for a valid comparison between flux values obtained at differ-ent times in the same eye by dynamic and scanning LDF and laser speckle flowgraphy, the tissue must be assumed to maintain the same scattering properties over time, which may not be the case during the development of various pathologies.C olor Doppler ImagingC olor Doppler imaging for retrobulbar vessels is an ultrasound technique that combines B-scan imaging of tissue structure, color representation of blood flow based on Doppler-shifted frequencies, and pulse-Doppler mea-surements of blood velocities. The flow parameters mea-sured are the peak-systolic velocity(PSV) , the end-diastolic velocity (EDV) , and the resistivity index R I =( P SV – E DV )/ P SV [82] . The application of color Doppler imaging to ophthalmology has provided data on centralretinal arterial P SV and E DV[83] . A nonexhaustive re-view of the literature between 1991 and 2006 reveals that the average P SV and E DV values in normal subjects rangefrom about 6 to 20 and 1.7 to 10 cm/s, respectively [24, 84]. M odifications of Retinal Blood Flow in Ischemic Microangiopathies B ranch Retinal Vein Occlusion B ranch retinal vein occlusion (BRVO) most common-ly occurs at an arteriovenous crossing where arteries andveins are bound together in a common adventitia. As aconsequence, arteriosclerotic changes can disturbB F in the venule, damage the endothelial cells and leading tothrombus formation[85, 86] . Clinical and angiographic findings have confirmed disturbances of venous B F and,exceptionally, reveal complete flow interruption. The im-portance of measuring retinal B F in retinal venous occlu-sions as an indicator of the severity of microcirculatorydisorders has been discussed. In particular, blood veloc-ity appears to provide an important criterion for the as-sessment of the stasis conditions and the diameter of thevessels offers essential information on local regulativeF ig. 5. Perfusion maps obtained from the ONH and temporal ret-ina of a normal eye. From top to bottom: reflectance image, vol-ume map, flow map, velocity map. The perfusion maps are color-coded; light colors show high perfusion values [from ref. 79, with permission]. e d b y :.149 - 2/24/2014 10:59:18 A M。