【材料研究方法】光谱分析(英文)
光谱分析法简介(UV AAS FTIR NMR)..

式中,A ——吸光度
K ——常数 ——意义 该式是原子吸收光谱定量分析的基本关系式:吸光度 (absorbance)A与样品中某元素的含量 C呈线性关系。通过一组已 知浓度的标准样品,做出A与C之间的工作曲线。在同样条件下,测 量未知物的吸光度后,利用工作曲线就可求得未知物的浓度Cx
2018/10/8
转变成原子蒸气,是原子吸收光谱分析法中的关键部件之一。有 火焰原子化器和无焰原子化器两类
●分光系统单色器 ●检测系统
作用是把要测量的吸收谱线同其他谱线
分开。分光部件有棱镜和光栅两种类型
作用是接受光信号,并把光信号转换成电信号 ,经放大和运算处理,给出分析结果。主要由检测器、放大器、 读数和记录系统等组成
——摩尔吸收系数 在A=lg(I0/It)=Kbc中,当浓度c用mol· L-1, 液层b厚度用cm表示,则K用摩尔吸光系数代之
A= bc
的意义 物质的量浓度为1mol· L-1,液层厚度为1cm时溶液的吸
光度。它反映了吸光物质对光吸收的能力,一定条件下为常数; 同一物质用不同显色剂时,有不同的值
——同一波长的光称单色光,由不同波长组成的光称复合光。物质 有色是因其分子对不同波长的光选择性吸收而产生。下页表列出了 颜色与吸收光之间的关系。其中对应颜色的光称互补色光 ——测量物质对不同波长单色光的吸收程度,以波长为纵坐标,吸 光度为横坐标,得一条吸收光谱曲线,它清楚地描述物质对光的吸 收情况。图片分光UV-1图1为MnO4-和Cr2O72-的选择性吸收曲线 。可见, MnO4-在可见光范围内对525nm附近的绿光有最大吸收 max=525nm。浓度不同光吸收曲线形状相同,吸光度大小不同 UV-11
( 6)灵敏度高
(7)样品损坏少
第三章光谱分析-SEM

4、扫描电镜图像和衬度
背散射电子像
1. 成分衬度
样品表面上平均原子序数Z大 的部位形成较亮的区域;
平均原子序数较低的部位形 成较暗的区域。
背散射电子像
2. 形貌衬度
分辨率远比二次电子低。 背反射电子是来自一个较大 的作用体积; 背向检测器的样品表面检测 器无法收集到背反射电子。
背散射电子探头采集的成分像(左图)和形貌像(右图)
6、试样的制备 生物医学材料试样制备
生物样品制备的一般原则: 防止样品污染、损伤,保持原有形貌、微细结构 去除样品内的水分-避免样品体积变小、表面收缩 增加样品的导电性能 注意辨认和保护观察面
3. 扫描电镜衬度像 二次电子像 背散射电子像
衬度:明暗程度
4、扫描电镜图像和衬度 二次电子像
KUST
6、试样的制备 非金属材料试样制备
镀膜材料的选择:Au、C、Ag、Cr、Pt等 熔点较低、易蒸发 与常用的钨丝加热器不发生任何作用 二次电子、背散射电子发射效率高 化学性能稳定
镀膜厚度 导电膜应均匀、连续,厚度200-300Å 不能太薄,否则导电膜显著不均、易破裂,甚至部分表 面未蒸镀上导电膜 不能太厚,否则导电膜易产生龟裂,掩盖试样表面结构 细节 先蒸发一层很薄的炭,然后再蒸镀金属层可以获得比较 好的效果。
制约因素主要有: 入射电子束束斑直径 入射电子束在样品中的扩展效应 信噪比
4、扫描电镜的主要性能和特点
景深D大
景深: 透镜对高低不平的试样 各部位能同时聚焦成像的一个能力 范围。
图像立体感强,适合粗糙不平 的断口样品观察。
扫描电镜的景深比透射电镜的 景深大10 倍。
4、扫描电镜的主要性能和特点
2、扫描电镜的结构原理和构造
光谱分析法导论(中英文版)

2. 联用技术
电感耦合高频等离子体(ICP)—质谱
激光质谱:灵敏度达10-20 g
3. 新材料
光导纤维传导,损耗少;抗干扰能力强;
04:01:03
4. 交叉
电致发光分析;光导纤维电化学传感器
5. 检测器的发展
电荷耦合阵列检测器光谱范围宽、量子效率高、线性范 围宽、多道同时数据采集、三维谱图,将取代光电倍增管; 光二极激光器代替空心阴极灯,使原子吸收可进行多元素 同时测定;
04:01:03
原子的能级通常用光谱项符号表示:nMLJ
n:主量子数;M:谱线多重性符号; L:总角量子数; J :内量子数
钠原子的光谱项符号 32S1/2;
表示钠原子的电子处于n=3,M =2(S = 1/2),L =0,
J = 1/2 的能级状态(基态能级);
04:01:03
电子能级跃迁的选择定则
5. 分子磷光分析法
处于第一最低单重激发态分子以无辐射弛豫方式进入第 一三重激发态,再跃迁返回基态发出磷光。测定磷光强度进 行定量分析的方法。
6. X射线荧光分析法
原子受高能辐射,其内层电子发生能级跃迁,发射出特征
X射线( X射线荧光),测定其强度可进行定量分析。
7. 化学发光分析法
利用化学反应提供能量,使待测分子被激发,返回基态 时发出一定波长的光,依据其强度与待测物浓度之间的线性 关系进行定量分析的方法。
1.光谱项符号
原子外层有一个电子时,其能级可由四个量子数决定: 主量子数 n;角量子数 l;磁量子数 m;自旋量子数 s; 原子外层有多个电子时,其运动状态用总角量子数L;总 自旋量子数S;内量子数J 描述;
04:01:03
总角量子数
L=∑ l 外层价电子角量子数的矢量和,(2 L +1)个 L=| l 1+ l2 | , | l 1+ l2 -1|,· · · · · · , | l 1 - l2 | 分别用S,P,D,F · · · · · · ,表示:
【材料研究方法】光谱分析(英文)

Vibrational spectroscopy6.3.7 Absorbant intensity and IR spectroscopyt r a n s m i t t a n c e Fig. 6-18 IR spectrum. s (strong )、m (medium )、w(weak )、vw (very weak )a b s o r b a n c eVibrational spectroscopy3334 cm -1–OH stretch. Normal range: 3350±150 cm -1. This is a verycharacteristic group frequency. All of the peaks due to the OH group are broad due to hydrogen bonding.Vibrational spectroscopy 3390 cm-1–NH2antisymmetric stretch.Normal range: 3300±100 cm-1. Muchweaker adsorption than the OH stretchin hexanol.Vibrational spectroscopy 3290cm-1–NH2symmetric stretch. 2°amines have only one NH stretch, and3°amines have none.Vibrational spectroscopy Spectral interpretation always starts at the high end, because there are the best group frequencies and they are the easiest to interpret. No peaks appear above 3000 cm-1, the cut-off for unsaturated C-H. the four peaks below 3000 cm-1 are saturated C-H stretching modes.Vibrational spectroscopy 3050 ±50 cm-1 corresponds to the aromatic orunsaturated C(sp2)-H stretch. Always above3000 cm-1. These bands are not assigned tospecific vibrational modes.Vibrational spectroscopy 3080cm-1=CH3080 cm1 2 antisymmetric stretch. An absorption above 3000 cm-1 indicates the presence of an unsaturation (double or triple bond or an aromatic ring).Vibrational spectroscopy 2247 cm-1 C≡N stretch. Normal range:2250±10 cm-1 , lowered 10-20 cm-1when conjugated. Compare to the C ≡Cstretch in 1-heptyne (3000 cm-1).Vibrational spectroscopy 1742 cm-1, -C=O stretch. In small ring esters, this vibration is shifted to higher frequency by coupling to the stretch ofthe adjacent of O-C and C-C bonds. The amount of coupling depends on the O-C(O)-C angle. As with other carbonyl groups, conjugation lowers the frequency.Vibrational spectroscopy 1642 cm-1, C=C stretch. Normalrange:164020cm-1for cis andrange: 1640±20 cm for cis andvinyl, 1670±10 cm-1for trans, tri andtetra substituted. Trans-2-hexene(overlay menu) has only a very weakabsorption, because there is verylittle dipole change when an internaldouble bond stretches (it is nearlysymmetric).Vibrational spectroscopyThe broad peak at approximately 1460 cm-1is actually two overlapping peaks. At1640±10 cm-1, the antisymmetric bend ofthe CH3group absorbs. This is a degenerage bend (one shown).Vibrational spectroscopy At 1375 ±10cm-1, the CH3 symmetric bend (also called the“umbrella” bend) absorbs. This peak is very useful becauseit is isolated from the other peaks. Compare the spectrum ofcyclohexane. The most prominent difference between thetwo spectra is the absence of a CH3 symmetric bend in thecyclohexane spectrum./cm-11715 1800 1828 1928。
光谱分析法导论(中英文版)

13:52:22
辐射能的特性:
(1) 吸收 (2) 发射 (3) 散射 物质选择性吸收特定频率的辐射能,并从低能 将吸收的能量以光的形式释放出; 丁铎尔散射和分子散射;
级跃迁到高能级;
(4) 折射
(5) 反射 (6) 干涉
折射是光在两种介质中的传播速度不同;
干涉现象;
(7) 衍射
(8) 偏振 光。
光分析法导论
an introduction to optical analysis
13:52:22
第一节 光分析基础
fundamental of optical analysis
13:52:22
一、光分析及其特点 optical analysis and its feature 二、电磁辐射的基本性质 properties of electromagnetic radiation 三、光分析法的分类 classification of optical analysis 四、各种光分析法简介 a brief introduction of optical analysis 五、光分析的进展 development of optical analysis
13:52:22
一、光分析法及其特点
optical analysis and its characteristics
光分析法:基于电磁辐射能量与待测物质相互作用后 所产生的辐射信号与物质组成及结构关系所建立起来的分析 方法;
电磁辐射范围:射线~无线电波所有范围;
相互作用方式:发射、吸收、反射、折射、散射பைடு நூலகம்干 涉、衍射等;
原子光谱(线性光谱):最常见的三种
基于原子外层电子跃迁的原子吸收光谱(AAS); 原子发射光谱(AES)、原子荧光光谱(AFS); 基于原子内层电子跃迁的 X射线荧光光谱(XFS); 基于原子核与射线作用的穆斯堡谱;
常用材料分析方法中英文对照

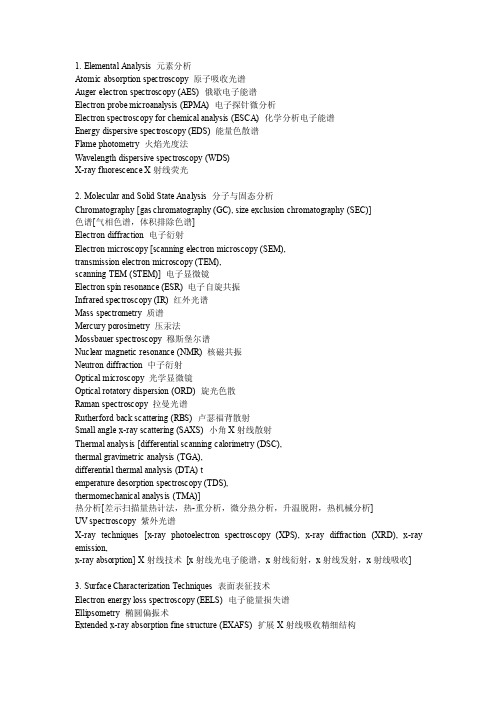
1. Elemental Analysis 元素分析Atomic absorption spectroscopy 原子吸收光谱Auger electron spectroscopy (AES) 俄歇电子能谱Electron probe microanalysis (EPMA) 电子探针微分析Electron spectroscopy for chemical analysis (ESCA) 化学分析电子能谱Energy dispersive spectroscopy (EDS) 能量色散谱Flame photometry 火焰光度法Wavelength dispersive spectroscopy (WDS)X-ray fluorescence X射线荧光2. Molecular and Solid State Analysis 分子与固态分析Chromatography [gas chromatography (GC), size exclusion chromatography (SEC)]色谱[气相色谱,体积排除色谱]Electron diffraction 电子衍射Electron microscopy [scanning electron microscopy (SEM),transmission electron microscopy (TEM),scanning TEM (STEM)] 电子显微镜Electron spin resonance (ESR) 电子自旋共振Infrared spectroscopy (IR) 红外光谱Mass spectrometry 质谱Mercury porosimetry 压汞法Mossbauer spectroscopy 穆斯堡尔谱Nuclear magnetic resonance (NMR) 核磁共振Neutron diffraction 中子衍射Optical microscopy 光学显微镜Optical rotatory dispersion (ORD) 旋光色散Raman spectroscopy 拉曼光谱Rutherford back scattering (RBS) 卢瑟福背散射Small angle x-ray scattering (SAXS) 小角X射线散射Thermal analysis [differential scanning calorimetry (DSC),thermal gravimetric analysis (TGA),differential thermal analysis (DTA) temperature desorption spectroscopy (TDS),thermomechanical analysis (TMA)]热分析[差示扫描量热计法,热-重分析,微分热分析,升温脱附,热机械分析]UV spectroscopy 紫外光谱X-ray techniques [x-ray photoelectron spectroscopy (XPS), x-ray diffraction (XRD), x-ray emission,x-ray absorption] X射线技术[x射线光电子能谱,x射线衍射,x射线发射,x射线吸收]3. Surface Characterization Techniques 表面表征技术Electron energy loss spectroscopy (EELS) 电子能量损失谱Ellipsometry 椭圆偏振术Extended x-ray absorption fine structure (EXAFS) 扩展X射线吸收精细结构Helium (or atom) diffractionLateral (or frictional) force microscopy (LFM) 横向(摩擦)力显微镜Low-energy electron diffraction (LEED) 低能电子衍射Magnetic force microscopy (MFM) 磁力显微镜Near-edge x-ray adsorption fine structure (NEXAFS) 近边X射线吸收精细结构Near field scanning 近场扫描Reflection high-energy electron diffraction (RHEED) 反射高能电子衍射Scanning tunneling microscopy (STM) 扫描隧道显微镜Scanning force microscopy (SFM) 扫描力显微镜Secondary ion mass spectroscopy (SIMS) 二次离子质谱Surface enhanced raman spectroscopy (SERS) 表面增强拉曼光谱Surface extended x-ray adsorption fine structure (SEXAFS) 表面扩展X射线吸收精细结构Surface force apparatus 表面力仪器。
光谱分析法导论(中英文版)

5. 分子磷光分析法
处于第一最低单重激发态分子以无辐射弛豫方式进入第 一三重激发态,再跃迁返回基态发出磷光。测定磷光强度进 行定量分析的方法。
6. X射线荧光分析法
原子受高能辐射,其内层电子发生能级跃迁,发射出特征 X射线( X射线荧光),测定其强度可进行定量分析。
7. 化学发光分析法
(2) 发射 将吸收的能量以光的形式释放出; (3) 散射 丁铎尔散射和分子散射; (4) 折射 折射是光在两种介质中的传播速度不同; (5) 反射 (6) 干涉 干涉现象; (7) 衍射 光绕过物体而弯曲地向他后面传播的现象; (8) 偏振 只在一个固定方向有振动的光称为平面偏振 光。
21:49:51
21:49:51
光分析法导论
an introduction to optical analysis
第一节 光分析基础
fundamental of optical analysis
21:49:51
一、光分析及其特点 optical analysis and its feature 二、电磁辐射的基本性质 properties of electromagnetic radiation 三、光分析法的分类 classification of optical analysis 四、各种光分析法简介 a brief introduction of optical analysis 五、光分析的进展 development of optical analysis
法法法
原 原原 X
子
子子
射 线
发 吸荧 荧
射 收光 光
原子光谱法
吸收光谱法
原紫红核 子外外磁 吸可可共 收见见振
材料现代研究方法第八章 分子光谱分析法-红外和拉曼光谱法_1

Mechanic Model as a Stretching Vibration
in a Diatomic Molecule 双原子分子伸缩振动的力学模型
Hooke’s law 胡克定律
F ky
k: force Constance for the bond 化学键的力常数
Mechanic Model as a Stretching Vibration in a Diatomic Molecule双原子分子伸缩振动的力学模型
CHCl3
Calculated* Measured
C-H stretching
3002
3020
C-H bending
1120
1219
C-Cl stretching
701
773
C-Cl bending
418
671
* Spartan ’02 AM1 minimization
CDCl3
Measured
2256 912 737 652
– Linear Molecule 线形分子: 3N-5
Instrumentation for IR Measurement 用于红外范围测量的仪器
• Dispersive Infrared Spectrometers色散型红外光谱仪
The same as UV-vis spectrophotometer with the light source, the dispersive elements and the detector adequately designed for IR Drawbacks:缺点 Slow scan speed, low sensitivity and low resolution 扫速慢 灵敏度低 光谱分辨率低
- 1、下载文档前请自行甄别文档内容的完整性,平台不提供额外的编辑、内容补充、找答案等附加服务。
- 2、"仅部分预览"的文档,不可在线预览部分如存在完整性等问题,可反馈申请退款(可完整预览的文档不适用该条件!)。
- 3、如文档侵犯您的权益,请联系客服反馈,我们会尽快为您处理(人工客服工作时间:9:00-18:30)。
Vibrational spectroscopy
6.3.1 Fundamentals of vibrational spectroscopy
Definition Vibrational spectroscopy:is concerned with the d t ti f t iti detection of transitions between energy levels in molecules that result from stretching and bending vibrations of the interatomic bonds.
asymmetrical
Vibrational spectroscopy
Kinds of vibrational spectroscopy ¾Infra-red spectroscopy
(more sensitive to polarized group)6.3.1 Fundamentals of vibrational spectroscopy
symmetrical
¾Raman spectroscopy (more
sensitive to non-polarized)Both methods are concerned with vibrations in molecules , they differ in the manner in which interaction with the exciting radiation occurs .
Linear PE: (a) IR, (b)
Raman
Fig. 6-14 Dipole moment of HCl
Vibrational spectroscopy
Vibrating of Disulfide carbon
Symmetrical stretching
Infrared inactive 6.3.2 Infrared spectroscopy
Asymmetrical stretching
Bending
Infrared active
Infrared inactive Fig. 6-15 Vibration of Disulfide carbon
m1
low
High/cm-1
High/cm-1
low
Vibrational spectroscopy Methylbenzene(甲苯)
2005.2 S. Gu
v =0 represents the ground state v =l the excited vibrational state
6.3.3 Raman spectroscopy
(1)
(2)
(3)
Vibrational spectroscopy ¾The essential prerequisite for Raman scattering is a change in the polarizability of the bond when vibrations occur.
Polarizability may be thought of as a measure of 6.3.3 Raman spectroscopy
¾Polarizability may be thought of as a measure of the
Fig. 6-16 Motion state of linear molecules Degrees of freedom (H2O) : 3×3−6 = 3
Vibraitonal modes (methylene group)
:2926cm-1(s)as
ν
Asymmetrical
s
ν: 2853 cm Symmetrical
δ:1468 cm-1(m) δr:720 cm-1(CH
1306~1303cm-1(w)γ
t :1250cm
scissoring rocking wagging
Hexane
Four peaks
p
Spectral interpretation always starts at the high end, because there are the best group frequencies and they are the easiest to interpret. No peaks appear above 3000 cm-1, the cut-off for unsaturated C-H. the four peaks below 3000 cm-1 are saturated C-H stretching modes.
Hexane
The peak at 2962 cm-1 is
assigned to the antisymmetric
assigned to the antisymmetric
stretch of the CH3group. This
vibration is always found in
the range 2962±10 cm-1. there
are actually two degenerate
antisymmetric stretching
modes (only one shown).Hexane
At 2926cm-1, the CH2
antisymmetric stretch
absorbs.Normal range:
2926±10 cm-1.
Hexane
At 2872cm-1, the CH3
symmetric stretch
absorbs.Normal range:
2872±10 cm-1.Hexane
At2853-1,the CH
At 2853cm, the CH2
symmetric stretch
absorbs.Normal range:
2853±10 cm-1.
Vibrational spectroscopy Hexane
1470cm-1This is the C-H bending
region, expanded to show the
nearly overlapping peaks for
the CH3and CH2bends.
Vibrational spectroscopy
Hexane
rocking When four or more CH2groups are
in a chain, a vibration at 720±10
cm-1corresponds to concerted
rocking of all of the CH2’s.
Vibrational spectroscopy
Hexanol
3334 cm-1–OH stretch. Normal range: 3350±150 cm-1.
This is a very characteristic group frequency. All of the
peaks due to the OH group are broad due to hydrogen
bonding.
Vibrational spectroscopy Hexanol 1430 cm -1–OH bend . Normal range: 1400±100 cm -1. This broad peak is buried under the CH bending modes.
Vibrational spectroscopy
Hexanol
660 cm -1–OH wag. While not a group frequency, this is another band due to the OH.
Vibrational spectroscopy Aromatic ring expansion (Methylbenzene )
At 1601 cm -1, the
symmetric ring strethch absorbs. Normal range: 1590±10 cm -1. This ib ti h di l
Only not
symmetrically substituted.
vibration has a dipole change (and absords in IR) only when not
symmetrically substituted. The intensity of this band also varies with the
substituent. Compare to p-xylene from the overlay menu.
Vibrational spectroscopy
Aromatic ring expansion (Methylbenzene )
At 1500cm -1, a different ring stretch absorbs. Range: 1500±10cm -1. Variable intensity
Vibrational spectroscopy 6.3.6 Comparing of IR and Raman Spectroscopy
asymmetrical
symmetrical
Fig. 6-17 Linear PE: (a) IR, (b) Raman。
