美国室内空气质量标准(英文版)
NationalAmbientAirQualityStandards美国空气质量标准
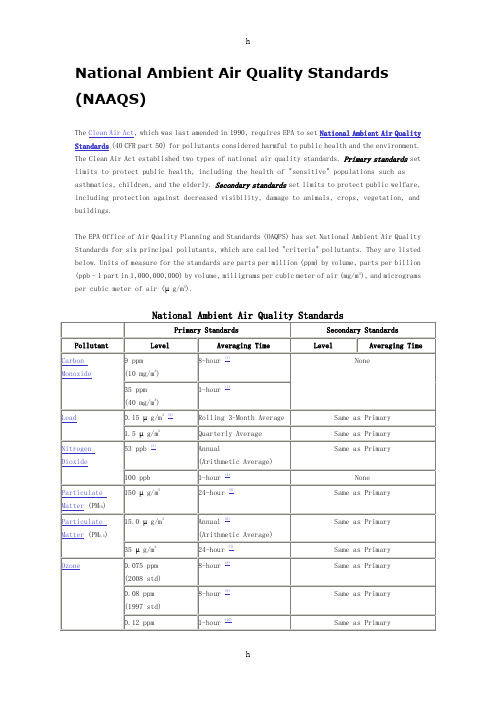
National Ambient Air Quality Standards (NAAQS)The Clean Air Act, which was last amended in 1990, requires EPA to set National Ambient Air Quality Standards(40 CFR part 50) for pollutants considered harmful to public health and the environment. The Clean Air Act established two types of national air quality standards. Primary standards set limits to protect public health, including the health of "sensitive" populations such as asthmatics, children, and the elderly. Secondary standards set limits to protect public welfare, including protection against decreased visibility, damage to animals, crops, vegetation, and buildings.The EPA Office of Air Quality Planning and Standards (OAQPS) has set National Ambient Air Quality Standards for six principal pollutants, which are called "criteria" pollutants. They are listed below. Units of measure for the standards are parts per million (ppm) by volume, parts per billion (ppb - 1 part in 1,000,000,000) by volume, milligrams per cubic meter of air (mg/m3), and micrograms per cubic meter of air (µg/m3).(1) Not to be exceeded more than once per year.(2) Final rule signed October 15, 2008.(3) The official level of the annual NO2 standard is 0.053 ppm, equal to 53 ppb, which is shown here for the purpose of clearer comparison to the 1-hour standard(4)To attain this standard, the 3-year average of the 98th percentile of the daily maximum 1-hour average at each monitor within an area must not exceed 100 ppb (effective January 22, 2010).(5) Not to be exceeded more than once per year on average over 3 years.(6) To attain this standard, the 3-year average of the weighted annual mean PM2.5 concentrations from single or multiple community-oriented monitors must not exceed 15.0 µg/m3.(7) To attain this standard, the 3-year average of the 98th percentile of 24-hour concentrations at each population-oriented monitor within an area must not exceed 35 µg/m3 (effective December 17, 2006).(8)To attain this standard, the 3-year average of the fourth-highest daily maximum 8-hour average ozone concentrations measured at each monitor within an area over each year must not exceed 0.075 ppm. (effective May 27, 2008)(9) (a) To attain this standard, the 3-year average of the fourth-highest daily maximum 8-hour average ozone concentrations measured at each monitor within an area over each year must not exceed0.08 ppm.(b) The 1997 standard—and the implementation rules for that standard—will remain in place for implementation purposes as EPA undertakes rulemaking to address the transition from the 1997 ozone standard to the 2008 ozone standard.(c) EPA is in the process of reconsidering these standards (set in March 2008).(10) (a) EPA revoked the 1-hour ozone standard in all areas, although some areas have continuing obligations under that standard ("anti-backsliding").(b) The standard is attained when the expected number of days per calendar year with maximum hourly average concentrations above 0.12 ppm is < 1.(11) (a) Final rule signed June 2, 2010. To attain this standard, the 3-year average of the 99th percentile of the daily maximum 1-hour average at each monitor within an area must not exceed 75 ppb.National Secondary Drinking Water RegulationsNational Secondary Drinking Water Regulations (NSDWRs or secondary standards) are non-enforceable guidelines regulating contaminants that may cause cosmetic effects (such as skin or tooth discoloration) or aesthetic effects (such as taste, odor, or color) in drinking water. EPA recommends secondary standards to water systems but does not require systems to comply. However, states may choose to adopt them as enforceable standards.List of National Secondary Drinking Water RegulationsContaminant Secondary StandardAluminum0.05 to 0.2 mg/LChloride250 mg/LColor15 (color units)Copper 1.0 mg/LCorrosivity noncorrosiveFluoride 2.0 mg/LFoaming Agents0.5 mg/LIron0.3 mg/LManganese0.05 mg/LOdor 3 threshold odor numberpH 6.5-8.5Silver0.10 mg/LSulfate250 mg/LTotal Dissolved Solids500 mg/L Zinc 5 mg/L MicroorganismsContaminant MCLG1(mg/L)2MCL orTT1(mg/L)2Potential Health Effects fromLong-Term Exposure Above the MCL(unless specified as short-term)Sources ofContaminant inDrinking WaterCryptosporidium zero TT 3Gastrointestinal illness (e.g.,diarrhea, vomiting, cramps)Human and animalfecal wasteGiardia lamblia zero TT3Gastrointestinal illness (e.g.,diarrhea, vomiting, cramps)Human and animalfecal wasteHeterotrophic plate count n/a TT3HPC has no health effects; it is ananalytic method used to measure thevariety of bacteria that are commonin water. The lower the concentrationof bacteria in drinking water, thebetter maintained the water systemis.HPC measures a rangeof bacteria that arenaturally present inthe environmentLegionella zero TT3Legionnaire's Disease, a type ofpneumoniaFound naturally inwater; multiplies inheating systemsTotal Coliforms(including fecal coliform and E. Coli)zero 5.0%4Not a health threat in itself; it isused to indicate whether otherpotentially harmful bacteria may bepresent5Coliforms arenaturally present inthe environment; aswell as feces; fecalcoliforms and E.coli only come fromhuman and animalfecal waste.Turbidity n/a TT3Turbidity is a measure of thecloudiness of water. It is used toindicate water quality andfiltration effectiveness (e.g.,whether disease-causing organismsare present). Higher turbiditylevels are often associated withhigher levels of disease-causing microorganisms such as viruses,Soil runoffparasites and some bacteria. These organisms can cause symptoms such as nausea, cramps, diarrhea, and associated headaches.Viruses (enteric)zero TT 3Gastrointestinal illness (e.g., diarrhea, vomiting, cramps)Human and animal fecal wasteDisinfection ByproductsContaminantMCLG 1(mg/L)2MCL or TT 1(mg/L)2Potential Health Effects fromLong-Term Exposure Above the MCL (unless specified as short-term)Sources of Contaminant inDrinking WaterBromatezero0.010Increased risk of cancerByproduct ofdrinking water disinfectionChlorite0.81.0Anemia; infants & youngchildren: nervous system effectsByproduct of drinking water disinfection Haloacetic acids(HAA5)n/a 60.0607Increased risk of cancer Byproduct ofdrinking water disinfectionTotalTrihalomethanes (TTHMs)--> n/a 6--> 0.0807Liver, kidney or central nervous system problems; increased risk of cancerByproduct of drinking water disinfectionDisinfectantsContaminantMCLG 1(mg/L)2MCL or TT 1(mg/L)2Potential Health Effects from Long-Term Exposure Above the MCL (unless specified as short-term)Sources of Contaminant inDrinking WaterDisinfectantsContaminantMCLG 1(mg/L)2MCL or TT 1(mg/L)2Potential Health Effects fromLong-Term Exposure Above the MCL (unless specified as short-term)Sources of Contaminant inDrinking WaterChloramines (as Cl 2)MRDLG=41MRDL=4.01Eye/nose irritation; stomach discomfort, anemiaWater additive used to control microbes Chlorine (asCl 2)MRDLG=41MRDL=4.01Eye/nose irritation; stomach discomfortWater additive used to control microbes Chlorine dioxide (as ClO 2)MRDLG=0.81MRDL=0.81Anemia; infants & young children: nervous system effectsWater additive used to control microbesInorganic ChemicalsContaminantMCLG 1(mg/L)2MCL or TT 1(mg/L)2Potential Health EffectsfromLong-Term Exposure Above the MCL (unless specified asshort-term) Sources of Contaminant inDrinking Water Antimony 0.006 0.006Increase in bloodcholesterol; decrease in blood sugarDischarge from petroleum refineries; fire retardants; ceramics; electronics; solderArsenic070.010 asof 01/23/06Skin damage orproblems with circulatory systems, and may have increased risk of getting cancerErosion of natural deposits; runoff from orchards, runoff from glass &electronicsproduction wastesAsbestos (fiber >10 micrometers)7 million fibersper liter7 MFLIncreased risk of developing benign intestinal polypsDecay of asbestos cement in water mains; erosion of natural depositsContaminant MCLG1(mg/L)2MCL or TT1(mg/L)2Potential Health Effects fromLong-Term Exposure Above theMCL (unless specified asshort-term)Sources of Contaminant inDrinking WaterBarium22Increase in blood pressure Discharge of drilling wastes; discharge from metal refineries; erosion of natural depositsBeryllium0.0040.004Intestinal lesions Discharge from metal refineries andcoal-burning factories; discharge from electrical, aerospace, and defense industriesCadmium0.0050.005Kidney damage Corrosion of galvanized pipes; erosion of natural deposits; discharge from metal refineries; runoff from waste batteries and paintsChromium (total)0.10.1Allergic dermatitisDischarge from steel andpulp mills; erosion ofnatural depositsCopper 1.3TT7; ActionLevel=1.3Short term exposure:Gastrointestinal distressLong term exposure: Liver orkidney damagePeople with Wilson's Diseaseshould consult their personaldoctor if the amount of copperin their water exceeds theaction levelCorrosion of householdplumbing systems; erosionof natural depositsContaminant MCLG1(mg/L)2MCL or TT1(mg/L)2Potential Health Effects fromLong-Term Exposure Above theMCL (unless specified asshort-term)Sources ofContaminant inDrinking WaterCyanide (as free cyanide)0.20.2Nerve damage or thyroidproblemsDischarge fromsteel/metalfactories; dischargefrom plastic andfertilizer factoriesFluoride 4.0 4.0Bone disease (pain andtenderness of the bones);Children may get mottled teethWater additive whichpromotes strongteeth; erosion ofnatural deposits;discharge fromfertilizer andaluminum factoriesLead zero TT7; ActionLevel=0.015Infants and children: Delays inphysical or mentaldevelopment; children couldshow slight deficits inattention span and learningabilitiesAdults: Kidney problems; highblood pressureCorrosion ofhousehold plumbingsystems; erosion ofnatural depositsMercury (inorganic)0.0020.002Kidney damageErosion of naturaldeposits; dischargefrom refineries andfactories; runofffrom landfills andcroplandsNitrate(measured as Nitrogen)1010Infants below the age of sixmonths who drink watercontaining nitrate in excess ofthe MCL could become seriouslyill and, if untreated, may die.Symptoms include shortness ofbreath and blue-baby syndrome.Runoff fromfertilizer use;leaching from septictanks, sewage;erosion of naturaldepositsContaminantMCLG 1(mg/L)2MCL or TT 1(mg/L)2Potential Health Effects fromLong-Term Exposure Above the MCL (unless specified as short-term) Sources of Contaminant in Drinking WaterNitrite(measured as Nitrogen)1 1Infants below the age of sixmonths who drink water containing nitrite in excess of the MCL could become seriously ill and, if untreated, may die. Symptoms include shortness of breath and blue-baby syndrome.Runoff from fertilizeruse; leaching from septic tanks, sewage; erosion of natural depositsSelenium0.050.05Hair or fingernail loss; numbness in fingers or toes; circulatory problemsDischarge frompetroleum refineries;erosion of natural deposits; discharge from mines Thallium0.00050.002Hair loss; changes in blood;kidney, intestine, or liver problemsLeaching fromore-processing sites; discharge fromelectronics, glass, and drug factories Organic ChemicalsContaminant MCLG1(mg/L)2MCL orTT1(mg/L)2Potential Health Effectsfrom Long-Term ExposureAbove the MCL (unlessspecified as short-term)Sources of Contaminant inDrinking WaterContaminant MCLG1(mg/L)2MCL orTT1(mg/L)2Potential Health Effectsfrom Long-Term ExposureAbove the MCL (unlessspecified as short-term)Sources of Contaminant inDrinking WaterAcrylamide zero TT8Nervous system or bloodproblems; increased risk ofcancerAdded to water duringsewage/wastewatertreatmentAlachlor zero0.002Eye, liver, kidney or spleenproblems; anemia; increasedrisk of cancer Runoff from herbicide used on row cropsAtrazine0.0030.003Cardiovascular system orreproductive problemsRunoff from herbicide usedon row cropsBenzene zero0.005Anemia; decrease in bloodplatelets; increased riskof cancerDischarge from factories;leaching from gas storagetanks and landfillsBenzo(a)pyrene (PAHs)zero0.0002Reproductive difficulties;increased risk of cancerLeaching from linings ofwater storage tanks anddistribution linesCarbofuran0.040.04Problems with blood,nervous system, orreproductive systemLeaching of soil fumigantused on rice and alfalfaContaminant MCLG1(mg/L)2MCL orTT1(mg/L)2Potential HealthEffects fromLong-Term ExposureAbove the MCL(unless specified asshort-term)Sources ofContaminant inDrinking WaterCarbon tetrachloride zero0.005Liver problems;increased risk ofcancerDischarge fromchemical plants andother industrialactivitiesChlordane zero0.002Liver or nervoussystem problems;increased risk ofcancerResidue of bannedtermiticideChlorobenzene0.10.1Liver or kidneyproblemsDischarge fromchemical andagriculturalchemical factories2,4-D0.070.07Kidney, liver, oradrenal glandproblemsRunoff from herbicideused on row cropsDalapon0.20.2Minor kidney changes Runoff from herbicide used on rights of way1,2-Dibromo-3-chloropropane (DBCP)zero0.0002Reproductivedifficulties;increased risk ofcancerRunoff/leaching fromsoil fumigant used onsoybeans, cotton,pineapples, andorchardso-Dichlorobenzene0.60.6Liver, kidney, orcirculatory systemproblemsDischarge fromindustrial chemicalfactoriesp-Dichlorobenzene0.0750.075Anemia; liver,kidney or spleendamage; changes inbloodDischarge fromindustrial chemicalfactoriesContaminant MCLG1(mg/L)2MCL orTT1(mg/L)2Potential HealthEffects fromLong-Term ExposureAbove the MCL(unless specified asshort-term)Sources ofContaminant inDrinking Water1,2-Dichloroethane zero0.005Increased risk ofcancerDischarge fromindustrial chemicalfactoriesContaminant MCLG1(mg/L)2MCL or TT1(mg/L)2Potential HealthEffects fromLong-Term ExposureAbove the MCL (unlessspecified asshort-term)Sources ofContaminant inDrinking Water1,1-Dichloroethylene0.0070.007Liver problems Discharge from industrial chemical factoriescis-1,2-Dichloroethylene0.070.07Liver problems Discharge from industrial chemical factoriestrans-1,2-Dichloroethylene0.10.1Liver problems Discharge from industrial chemical factoriesDichloromethane zero0.005Liver problems;increased risk ofcancerDischarge from drugand chemicalfactories1,2-Dichloropropane zero0.005Increased risk ofcancerDischarge fromindustrialchemical factoriesDi(2-ethylhexyl) adipate0.40.4Weight loss, liverproblems, orpossiblereproductivedifficulties.Discharge fromchemical factoriesDi(2-ethylhexyl) phthalate zero0.006Reproductivedifficulties; liverproblems; increasedrisk of cancerDischarge fromrubber and chemicalfactoriesDinoseb0.0070.007ReproductivedifficultiesRunoff fromherbicide used onsoybeans andvegetablesDioxin (2,3,7,8-TCDD)zero0.00000003Reproductive Emissions fromContaminant MCLG1(mg/L)2MCL or TT1(mg/L)2Potential HealthEffects fromLong-Term ExposureAbove the MCL (unlessspecified asshort-term)Sources ofContaminant inDrinking Waterdifficulties;increased risk ofcancerwaste incinerationand othercombustion;discharge fromchemical factoriesContaminant MCLG1(mg/L)2MCL or TT1(mg/L)2Potential Health Effectsfrom Long-Term ExposureAbove the MCL (unlessspecified as short-term)Sources of Contaminant inDrinking WaterDiquat0.020.02Cataracts Runoff from herbicide useEndothall0.10.1Stomach and intestinalproblemsRunoff from herbicide useEndrin0.0020.002Liver problems Residue of banned insecticideEpichlorohydrin zero TT8Increased cancer risk, andover a long period of time,stomach problemsDischarge from industrialchemical factories; animpurity of some watertreatment chemicalsEthylbenzene0.70.7Liver or kidneys problems Discharge from petroleum refineriesEthylene dibromide zero0.00005Problems with liver,stomach, reproductivesystem, or kidneys;increased risk of cancerDischarge from petroleumrefineriesGlyphosate0.70.7Kidney problems;reproductive difficultiesRunoff from herbicide useHeptachlor zero0.0004Liver damage; increasedrisk of cancerResidue of bannedtermiticideHeptachlor epoxide zero0.0002Liver damage; increasedrisk of cancerBreakdown of heptachlorContaminant MCLG1(mg/L)2MCL orTT1(mg/L)2Potential HealthEffects from Long-TermExposure Above the MCL(unless specified asshort-term)Sources ofContaminant inDrinking WaterHexachlorobenzene zero0.001Liver or kidneyproblems; reproductivedifficulties;increased risk ofcancerDischarge from metalrefineries andagriculturalchemical factoriesHexachlorocyclopentadiene0.050.05Kidney or stomachproblemsDischarge fromchemical factoriesLindane0.00020.0002Liver or kidneyproblemsRunoff/leaching frominsecticide used oncattle, lumber,gardensMethoxychlor0.040.04ReproductivedifficultiesRunoff/leaching frominsecticide used onfruits, vegetables,alfalfa, livestockOxamyl (Vydate)0.20.2Slight nervous systemeffectsRunoff/leaching frominsecticide used onapples, potatoes,and tomatoesPolychlorinated biphenyls (PCBs)zero0.0005Skin changes; thymusgland problems; immunedeficiencies;reproductive ornervous systemdifficulties;increased risk ofcancerRunoff fromlandfills; dischargeof waste chemicalsPentachlorophenol zero0.001Liver or kidneyproblems; increasedcancer riskDischarge from woodpreserving factoriesContaminant MCLG1(mg/L)2MCL orTT1(mg/L)2Potential HealthEffects from Long-TermExposure Above the MCL(unless specified asshort-term)Sources of Contaminantin Drinking WaterPicloram0.50.5Liver problems Herbicide runoff Simazine0.0040.004Problems with blood Herbicide runoffStyrene0.10.1Liver, kidney, orcirculatory systemproblemsDischarge from rubberand plastic factories;leaching from landfillsTetrachloroethylene zero0.005Liver problems;increased risk ofcancerDischarge fromfactories and drycleanersToluene11Nervous system, kidney,or liver problemsDischarge frompetroleum factoriesToxaphene zero0.003Kidney, liver, orthyroid problems;increased risk ofcancerRunoff/leaching frominsecticide used oncotton and cattle2,4,5-TP (Silvex)0.050.05Liver problems Residue of banned herbicide1,2,4-Trichlorobenzene0.070.07Changes in adrenalglandsDischarge from textilefinishing factories1,1,1-Trichloroethane0.200.2Liver, nervous system,or circulatory problemsDischarge from metaldegreasing sites andother factories1,1,2-Trichloroethane0.0030.005Liver, kidney, orimmune system problemsDischarge fromindustrial chemicalfactoriesContaminantMCLG 1(mg/L)2MCL orTT 1(mg/L)2Potential Health Effectsfrom Long-Term Exposure Above the MCL (unless specified as short-term)Sources of Contaminant in Drinking Water Trichloroethylene zero 0.005Liver problems; increased risk of cancerDischarge from metal degreasing sites and other factories Vinyl chloridezero0.002Increased risk of cancerLeaching from PVCpipes; discharge from plastic factories Xylenes (total)1010Nervous system damageDischarge frompetroleum factories; discharge from chemical factoriesRadionuclidesContaminantMCLG 1(mg/L)2MCL or TT 1(mg/L)2PotentialHealthEffects from Long-Term Exposure Above the MCL (unless specified as short-term)Sources of Contaminant in Drinking WaterAlpha particlesnone 7---------- zero15 picocuries per Liter (pCi/L)Increased risk of cancer Erosion of natural depositsof certain minerals that are radioactive and may emit aform of radiation known as alpha radiation Beta particles andphoton emittersnone 7----------zero4 millirems per yearIncreased risk of cancer Decay of natural and man-made deposits ofcertain minerals that areradioactive and may emit forms of radiation known as photons and beta radiationRadium 226 and Radium 228 (combined)none 7---------- zero5 pCi/LIncreased risk of cancer Erosion of natural depositsRadionuclidesContaminant MCLG1(mg/L)2MCL or TT1(mg/L)2Potential Health Effects fromLong-Term Exposure Above the MCL(unless specified as short-term)Sources ofContaminant inDrinking WaterUranium zero 30 ug/L as of12/08/03Increased risk of cancer, kidneytoxicityErosion of naturaldepositsTop of pageNotes1 Definitions: Maximum Contaminant Level Goal (MCLG) - The level of a contaminant in drinking water below which there is no known or expected risk to health. MCLGs allow for a margin of safety and are non-enforceable public health goals. Maximum Contaminant Level (MCL) - The highest level of a contaminant that is allowed in drinking water. MCLs are set as close to MCLGs as feasible using the best available treatment technology and taking cost into consideration. MCLs are enforceable standards. Maximum Residual Disinfectant Level Goal (MRDLG) - The level of a drinking water disinfectant below which there is no known or expected risk to health. MRDLGs do not reflect the benefits of the use of disinfectants to control microbial contaminants. Treatment Technique - A required process intended to reduce the level of a contaminant in drinking water. Maximum Residual Disinfectant Level (MRDL) - The highest level of a disinfectant allowed in drinking water. There is convincing evidence that addition of a disinfectant is necessary for control of microbial contaminants.2 Units are in milligrams per liter (mg/L) unless otherwise noted. Milligrams per liter are equivalent to parts per million.3 EPA's surface water treatment rules require systems using surface water or ground water under the direct influence of surface water to (1) disinfect their water, and (2) filter their water or meet criteria for avoiding filtration so that the following contaminants are controlled at the following levels:•Cryptosporidium: Unfiltered systems are required to include Cryptosporidium in their existing watershed control provisions.•Giardia lamblia: 99.9% removal/inactivation•Viruses: 99.99% removal/inactivation•Legionella: No limit, but EPA believes that if Giardia and viruses are removed/inactivated, according to the treatment techniques in the Surface Water Treatment Rule, Legionella will also be controlled.•Turbidity: For systems that use conventional or direct filtration, at not time can turbidity (cloudiness of water) go higher than 1 nephelolometric turbidity unit NTU), and samples for turbidity must be less than or equal to 0.3 NTU in at least 95 pervent of the samples in any month. Systems that use filtration other than the conventional or direct filtration must follow state limits, which must include turbidity at no timeexceeding 5 NTU.•HPC: No more than 500 bacterial colonies per milliliter.•Long Term 1 Enhanced Surface Water Treatment: Surface water systems or (GWUDI) systems serving fewer than 10,000 people must comply with the applicable Long Term 1 Enhanced Surface Water Treatment Rule provisions (e.g. turbidity standards, individual filter monitoring, Cryptosporidium removal requirements, updated watershed controlrequirements for unfiltered systems).•Long Term 2 Enhanced Surface Water Treatment Rule This rule applies to all surface water systems or ground water systems under the direct influence of surface water. The rule targets additional Cryptosporidium treatment requirements for higher risk systems and includes provisions to reduce risks from uncovered finished water storage facilities and to ensure that the systems maintain microbial protection as they take steps to reduce the formation of disinfection byproducts.•Filter Backwash Recycling; The Filter Backwash Recycling Rule requires systems that recycle to return specific recycle flows through all processes of the system's existing conventional or direct filtration system or at an alternate location approved by the state.4 No more than 5.0% samples total coliform-positive in a month. (For water systems that collect fewer than 40 routine samples per month, no more than one sample can be total coliform-positive per month.) Every sample that has total coliform must be analyzed for either fecal coliforms or E. coli if two consecutive TC-positive samples, and one is also positive for E.coli fecal coliforms, system has an acute MCL violation.5 Fecal coliform and E. coli are bacteria whose presence indicates that the water may be contaminated with human or animal wastes. Disease-causing microbes (pathogens) in these wastes can cause diarrhea, cramps, nausea, headaches, or other symptoms. These pathogens may pose a special health risk for infants, young children, and people with severely compromised immune systems.6 Although there is no collective MCLG for this contaminant group, there are individual MCLGs for some of the individual contaminants:•Trihalomethanes: bromodichloromethane (zero); bromoform (zero); dibromochloromethane(0.06 mg/L): chloroform (0.07mg/L).•Haloacetic acids: dichloroacetic acid (zero); trichloroacetic acid (0.02 mg/L);monochloroacetic acid (0.07 mg/L). Bromoacetic acid and dibromoacetic acid are regulated with this group but have no MCLGs.7 Lead and copper are regulated by a Treatment Technique that requires systems to control thecorrosiveness of their water. If more than 10% of tap water samples exceed the action level, water systems must take additional steps. For copper, the action level is 1.3 mg/L, and for lead is 0.015 mg/L.8 Each water system must certify, in writing, to the state (using third-party or manufacturer's certification) that when acrylamide and epichlorohydrin are used to treat water, the combination (or product) of dose and monomer level does not exceed the levels specified, as follows:•Acrylamide = 0.05% dosed at 1 mg/L (or equivalent)•Epichlorohydrin = 0.01% dosed at 20 mg/L (or equivalent)欢迎您的下载,资料仅供参考!。
室内空气污染物

全面通风送风量的计算
现假设: (1) x , L , y0 , y1 均为常数; (2) x 均匀散发到整个空间; (3) 送入室内的空气一进入室内立刻与室内空气充分混 如图所示的空间,若该空间中污染物的发生量 x kg s ,通风量为 L m 3 s ,空间容积为 为合,而且送风量等于排风量,室内、外空气温度相 3 同。 V m 。
SO2
CO2 O3
0.02-1
600-9000 0.04-0.4
<0.5
<1800 0.05
>1.35
>12000 0.08
污染物种类
• particles (Particles dispersed in air are also known as aerosols) • gases.
• The distinction between particles and gases is important when determining removal strategies and equipment.
Lecture for hvacr
室内空气污染物
室内空气品质
• 定义: • 美国ashrae:可接受的室内空气品质 (acceptable indoor air quality)对于空间内 的空气,绝大多数(>=80%)在室者未表 示不满,且已知污染物的浓度尚不足对人 的健康产生明显危害。 • 该定义既包含室内空气品质的主观评价, 也包含客观评价。
x 3 L m s 局部通风分为局部进风和局部排风,其基本 y2 y0
kx L y2 y0
m s
3
• 已知污染源的olf
静坐的人,1met 1Olf
美国国家空气质量标准
National Ambient Air Quality Standards (NAAQS)The Clean Air Act, which was last amended in 1990, requires EPA to set National Ambient Air Quality Standards (40 CFR part 50) for pollutants considered harmful to public health and the environment. The Clean Air Act established two types of national air quality standards. Primary standards set limits to protect public health, including the health of "sensitive" populations such as asthmatics, children, and the elderly. Secondary standards set limits to protect public welfare, including protection against decreased visibility, damage to animals, crops, vegetation, and buildings.The EPA Office of Air Quality Planning and Standards (OAQPS) has set National Ambient Air Quality Standards for six principal pollutants, which are called "criteria" pollutants. They are listed below. Units of measure for the standards are parts per million (ppm) by volume, parts per billion (ppb - 1 part in 1,000,000,000) by volume, milligrams per cubic meter of air (mg/m3), and micrograms per cubic meter of air (µg/m3).(1) Not to be exceeded more than once per year.(2) Final rule signed October 15, 2008.(3) The official level of the annual NO2 standard is 0.053 ppm, equal to 53 ppb, which is shown here for the purpose of clearer comparison to the 1-hour standard(4) To attain this standard, the 3-year average of the 98th percentile of the daily maximum 1-hour average at each monitor within an area must not exceed 100 ppb (effective January 22, 2010).(5) Not to be exceeded more than once per year on average over 3 years.(6) To attain this standard, the 3-year average of the weighted annual mean PM2.5 concentrations from single or multiple community-oriented monitors must not exceed 15.0 µg/m3.(7) To attain this standard, the 3-year average of the 98th percentile of 24-hour concentrations at each population-oriented monitor within an area must not exceed 35µg/m3 (effective December 17, 2006).(8) To attain this standard, the 3-year average of the fourth-highest daily maximum 8-hour average ozone concentrations measured at each monitor within an area over each year must not exceed 0.075 ppm. (effective May 27, 2008)(9) (a) To attain this standard, the 3-year average of the fourth-highest daily maximum8-hour average ozone concentrations measured at each monitor within an area over each year must not exceed 0.08 ppm.(b) The 1997 standard—and the implementation rules for that standard—will remain in place for implementation purposes as EPA undertakes rulemaking to address the transition from the 1997 ozone standard to the 2008 ozone standard.(c) EPA is in the process of reconsidering these standards (set in March 2008).(10) (a) EPA revoked the 1-hour ozone standard in all areas, although some areas have continuing obligations under that standard ("anti-backsliding").(b) The standard is attained when the expected number of days per calendar year with maximum hourly average concentrations above 0.12 ppm is < 1.(11) (a) Final rule signed June 2, 2010. To attain this standard, the 3-year average of the 99th percentile of the daily maximum 1-hour average at each monitor within an area must not exceed 75 ppb.。
世界四大权威四种认证
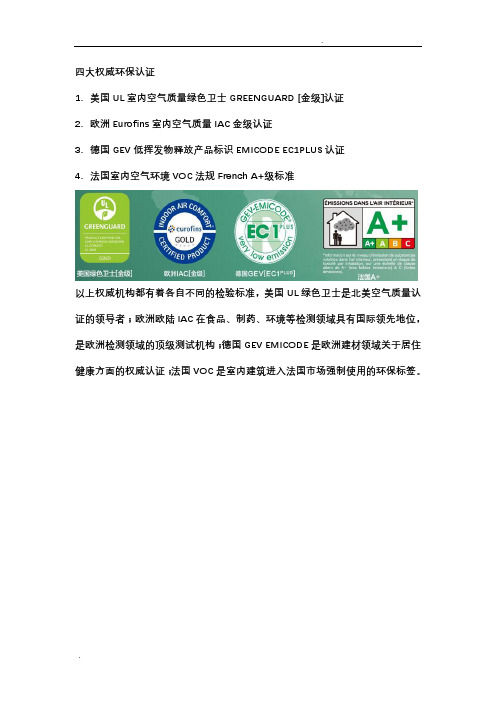
四大权威环保认证1.美国UL室内空气质量绿色卫士GREENGUARD [金级]认证2.欧洲Eurofins室内空气质量IAC金级认证3.德国GEV低挥发物释放产品标识EMICODE EC1PLUS认证4.法国室内空气环境VOC法规French A+级标准以上权威机构都有着各自不同的检验标准,美国UL绿色卫士是北美空气质量认证的领导者;欧洲欧陆IAC在食品、制药、环境等检测领域具有国际领先地位,是欧洲检测领域的顶级测试机构;德国GEV EMICODE是欧洲建材领域关于居住健康方面的权威认证;法国VOC是室内建筑进入法国市场强制使用的环保标签。
1.中国十环认证中国环境标志产品认证,也称为十环认证标志,是目前国内最权威、最高级别的环保产品认证。
十环认证由环保部指定中环联合()认证中心(环保部环境认证中心)为唯一认证机构,通过文件审核、现场检查、样品检测三个阶段的多准则审核,来确定产品是否可以达到国家环境保护标准的要求。
它代表了官方对产品的质量和环保性能的认可。
此外,十环认证比国家环保标准的要求更高。
该认证除了产品符合相关环保标准以外,还对产品的生产、使用、消费和处理过程有严格的要求。
即是说,十环认证还严格考量产品对生态环境、人体健康、资源节约等方面的影响。
中国环境标志产品认证对于建筑涂料中有害物质限量如下所示:2.法国A+认证简介:法国VOC标签是室内建筑进入法国市场强制使用的环保标签,检测的是“室内空气中排放物”。
它模拟出产品施工后,人们实际居住的室内环境,持续28天检测室内空气的质量;然后根据10种挥发性有机物的排放浓度,进行产品定级。
法国A+认证有四个等级,C级、B级、A级,和最高的A+级。
A+级规定TVOC<1000(ug/m3)、甲醛<10(ug/m3)、乙醛<200(ug/m3)。
室内空气排放标准A+认证对于建筑涂料中有害物质限量如下表所示:认证范围:地板覆盖物、油漆和清漆、窗户和门、墙和天花板的面板授权相关要求:检测标准:涉及ISO 16000的四个部分:ISO 16000-3:Indoor air -- Part 3: Determination of formaldehyde and other carbonyl compounds in indoor air and test chamber air -- Active sampling method;室内空气--第3部分:测定室内空气和实验舱空气中甲醛和其它羰基化合物--活性取样法。
房间甲醛标准
房间甲醛标准
甲醛是一种常见的有机挥发性化合物,在室内装修和家具制造中可能释放出来,对人体健康造成潜在威胁。
不同国家和地区对室内甲醛浓度的标准有所不同,以下是一些常见的室内甲醛标准:
1. 中国标准:中国国家标准GB/T 18883-2002《室内空气质量标准》规定了室内空气中甲醛的标准限值。
根据该标准,居住建筑室内甲醛浓度的限值为每立方米不超过0.1毫克。
2. 美国标准:美国环保署(EPA)建议室内甲醛浓度不超过每立方米0.1至0.05毫克。
此外,美国加利福尼亚州CARB(California Air Resources Board)还颁布了关于构建材料中甲醛排放的严格标准。
3. 欧盟标准:欧盟对于甲醛排放有相应的法规。
根据EN 717-1标准,新装修室内甲醛浓度应小于每立方米0.1毫克。
这些标准都是为了确保室内空气质量达到安全和健康的水平,保护居民免受高浓度甲醛的影响。
当然,不同国家和地区还可能根据特定环境和健康状况进行调整和更新标准,因此,在进行室内装修或购买家具时,最好参考当地的相关法规和标准,以确保室内空气质量符合安全要求。
GB 3095-1996 《环境空气质量标准(英文版)》

National Standard of the People’s Republic of China Ambient Air Quality Standard(GB3095-1996)National Standard of the People’s Republic of ChinaAmbient Air Quality Standard(GB3095-1996)1.Subject and ScopeThis Standard stipulates the designation of functional areas of ambient air quality, standard classification, pollutants, sampling time and concentration limits, sampling and analyzing methods as well as the definition of validity of data statistics.This Standard is applicable to the evaluation of countrywide ambient air quality.2.Reference StandardGB/T 15262 Air Quality Determination of sulfur dioxide — Formaldehyde absorbing-pararosaniline spectrophotometryGB 8970 Air Quality Determination of sulfur dioxide in ambient air—Tetrachloromercurate(TCM)-pararosaniline methodGB/T 5432 Ambient Air Determination of total suspended particles — Gravimetric methodGB6921 Air Quality Determination of the concentration of airborne particulate mattersGB/T15436 Ambient Air Determination of nitrogen oxides — Saltzman methodGB/T15435 Ambient Air Determination of nitrogen dioxides — Saltzman methodGB/T15437 Ambient Air Determination of ozone — Indigo disulphonate spectrophotometryGB/T15438 Ambient Air Determination of ozone — Ultraviolet photometric methodGB9801 Air Quality Determination of carbon monoxide — Non-dispersive infraredspectrometryGB8971 Air Quality Determination of Benzo[a]pyrene in flying dust — Acetylated paperchromatography fluoroscene spectrophotometric methodGB/T15439 Ambient Air Determination of Benzo[a]pyrene in ambient air — High performanceliquid chromatographyGB/T15264 Air Quality Determination of lead—Flame atomic absorption spectrophotometricmethodGB/T15434 Ambient Air Determination of the mass concentration of fluoride — Method byfilter sampling and fluorine ion-selective electrode analysisGB/T15433 Ambient Air Determination of the fluoride — Method by lime-paper sampling andfluorine ion-selective electrode analysis3. Definition3.1 Total suspended particles (TSP): The particles that can be suspended in the air with an aerodynamic equivalent diameter ≤ 100 micrometer.3.2 Breathable particles (PM10): The particles that can be suspended in the air with an aerodynamic equivalent diameter ≤ 10 micrometer.23.3 Nitrogen oxide (as NO2): The nitrogen oxide existing in the air in the form of nitrogen monoxide and nitrogen dioxide.3.4 Lead (Pb): The lead and its compounds existing in TSP.3.5 Benzo[a]pyrene (B[a]P): The benzo[a]pyrene existing in breathable particles.3.6 Fluoride (as F): Inorganic fluoride existing in gaseous and particulate states.3.7 Annual average: The arithmetic mean of daily average concentration in any year.3.8 Quarterly average: The arithmetic mean of daily average concentration in any quarter.3.9 Monthly average: The arithmetic mean of daily average concentration in any month.3.10 Daily average: The average concentration on any day.3.11 Hourly average: The average concentration in any hour.3.12 Average in plant growth season: The arithmetic mean of monthly average concentration in any plant growth season.3.13 Ambient air: Outside air which human beings, plants, animals, and buildings are exposed to.3.14 Normal state: The state at a temperature of 273K and a pressure of 101.325Kpa.4. Grouping and Standard Classification of Functional Area of Ambient Air Quality4.1 Grouping of functional area of ambient air qualityGroup I area includes natural protection zones, scenic spots and other areas for which special protections are necessary.Group II area includes the residential quarters designated in town planning, mixed areas of business, communication and living, cultural areas, normal industrial areas and rural areas.Group III area includes specialized industrial areas.4.2Standard classification of ambient air qualityThe standard of ambient air quality is classified as three classes.Class 1 standard is imposed for Group I area.Class 2 standard is imposed for Group II area.Class 3 standard is imposed for Group III area.5. Concentration LimitThis Standard stipulates the concentration limits of various pollutants that are not allowed to be exceeded. For the details, refer to the following table:www.bzfxw.com4Table 1 - Concentration Limit for Various PollutantsConcentration limitPollutant Sampling timeClass 1 standard Class 2 standard Class 3 standardUnit of concentration Sulfurdioxide SO 2 Annual average Daily average Hourly average 0.02 0.05 0.15 0.06 0.15 0.50 0.100.250.70 Totalsuspended particles TSPAnnual average Daily average0.08 0.12 0.20 0.30 0.30 0.50Breathable particles PM 10 Annual average Daily average 0.04 0.05 0.10 0.15 0.15 0.25 Nitrogen oxide NO xAnnual average Daily average Hourly average 0.05 0.10 0.15 0.05 0.10 0.15 0.10 0.15 0.30 Nitrogendioxide NO 2 Annual average Daily averageHourly average0.04 0.08 0.12 0.04 0.08 0.12 0.08 0.12 0.24 Carbon monoxide CODaily average Hourly average 4.00 10.00 4.00 10.006.00 20.00Ozone O 0 Hourly average 0.12 0.160.20mg/m 3 (normal state) Lead pb Quarterly averageAnnual average1.50 1.00 Benzo[a] Pyrene B[a]P Daily average 0.01Fluoride F Daily average Hourly average 7 20μm/m 3 (normal state)Fluoride FMonthly average in plant growth season 1.8 1.23.0 2.0μm/(dm 2/day)Note: is applicable to urban area; is applicable to pastoral area, agricultural-pastoral area in which priority is given to pastoral, silkworm breeding area; is applicable for agricultural area and forest zone. 6. Monitoring 6.1 SamplingThe requirements of sampling point, sampling environment, sampling attitude and frequency for monitoring the ambient air are executed in accordance with “Technical Specifications of Environment Monitoring” (Section: Atmosphere)www.bzfxw.com6.2 Analyzing MethodFor the analyzing methods for various pollutants, refer to Table 2.Table 2 - Analyzing methods for various pollutantsPollutant Analyzing method SourceSulfur dioxide(1) Formaldehydeabsorbing-pararosaniline spectrophotometry(2) Tetrachloromercurate (TCM)-pararosaniline method(3) Ulraviolet photometric methodGB/T15262-94 GB8970-88Total suspended particles Gravimetric method GB/T15432-95 Breathable particles Gravimetric method GB6921-86Nitrogen oxide(as NO 2)(1) Saltzman method (2) Chemiluminescene GB/T15436-95 Nitrogen dioxide (1) Saltzman method (2) ChemiluminesceneGB/T15435-95Ozone (1) Indigo disulphonate spectrophotometry (2) Ultraviolet photometric method (3) ChemiluminesceneGB/T15437-95GB/T15438-95 Carbon monoxide Non-dispersive infrared spectrometry GB9801-88 Benzo[a]pyrene (1) Acetylated paper chromatography fluorescene spectrophotometry (2) High-performance liquid chromatographyGB9871-88GB/T15439-95 Lead Flame atomic absorption spectrophotometric methodGB/T15264-94Fluoride (as F) (1) Method by filter sampling and fluorine ion-selective electrode analysis (2) Method by lime-paper sampling and fluorine ion-selective electrode analysis ° GB/T15434-95GB/T15433-95Note: ISO/CD10498, ISO7996, ISO10313 are executed respectively for , and for the time being. Corresponding national standards will be implemented after their issuance; is used for daily average and hourly average; ° is used for monthly average and average in plant growth season. 7. Definition of Validity of Data StatisticsFor definition of validity of data statistics, refer to Table 3.www.bzfxw.com6Table 3 - Definition of Validity of Data Statistics for Various PollutantsPollutantSamplint time Definition of validity of dataSO 2, NOx, NO 2Annual averageAt least 144 evenly-distributed daily averages are available each year.At least 12 evenly-distributed daily averages are available each month.TSP, PM 10, pbAnnual average At least 60 evenly-distributed dailyaverages are available each year.At least 5 evenly-distributed daily averages are available each month.SO 2, NOx, NO 2 , CO Daily average At least 18 hours for sampling areavailable each day.TSP, PM 10, B(a)P, pb Daily average At least 12 hours for sampling are availabeeach day.SO 2, NOx, NO 2, CO, O 3 Hourly average At least 45 minutes for sampling areavailable each hour.pbQuarterly average At least 15 evenly-distributed dailyaverages are available each quarter.At least 5 evenly-distributed daily averages are available each month.Monthly average At least 15 days for sampling are availableeach month.Average in plant growth season At least 70% of the monthly averages are available during each growth season. Daily average At least 12 hours for samling are availableeach day.FHourly average At least 45 minutes for sampling areavailable each hour. 8. Implementation of Standard8.1 The environemntal protection authorities at various levels are responsible for the supervision andimplementation of this Standard.8.2 This Standard stipulates the hourly, daily, monthly, quarterly and annual averages of concentration limits, however, the environemntal protection authorities at various levels shall supervise the implementation of this Standard based on different purposes.8.3 The functional areas of ambient air quality are designated by the environemntal protection authorities of cities above the prefecture-level (including prefecture-level cities), and submitted to the people’s government of the same level for approval and implementation.。
空气质量管理CleanAirInitiative(1)
执行
-- 1977: Nonattainment designations, PSD, Auto I/M
-- 自发的项目 -- SIP credits -- 区域性解决办法
-- 1990: More nonattainment, Market Based program for SO2, Mobile source controls, Fuels, MACT,CAIR
0.053 ppm/100 ug/m3 (annual)
2o 标准
None
Same as primary Same as primary
50 ug/m3 (annual) 150 ug/m3 (24 hr)
15 ug/m3 (annual) 65 ug/m3 (24 hr)
0.08 ppm (8 hr)
遵照并执行
空气质量管理CleanAirInitiative(1)
联邦-区域-州的作用
联邦
区域
► 国家标准,规定和强制 ► 政策和项目结合 ► 技术指导 ► 减轻空气污染进展报告 ► Ultimate authority & accountability
► 进行评估和鉴定 ► 帮助制定多州战略和贸易项目 ► 区域为执行国家项目进行的计划/合作
Same as primary None Same as primary
0.03 ppm (annual) 0.14 ppm (24 hr)
0.5 ppm (3 hr)
空气质量管理CleanAirInitiative(1)
空气质量管理循环
建立 目标
70年代: .08 ppm O3 & TSP 80年代: .12 ppm O3 & PM-10 现在: .08 ppm O3 & PM-2.5
美国室内空气质量标准(英文版)

INTRODUCTIONThe average person sends approximately 90% of their time indoors. Studies haveindicated that indoor air is often dirtier and/or contains higher levels of contaminants than outdoor air. Because of this and increased awareness regarding poor indoor air quality (IAQ), it is not surprising that the number of reported employee complaints of discomfort and illness in non-industrial workplaces is increasing.WHEN DID POOR INDOOR AIR QUALITY BECOME A PROBLEM?Beginning in the mid-1970s, IAQ complaints increased for two reasons. The main reason was the impact of the energy crisis. To reduce heating and cooling costs, buildings were made “airtight” with insulation and sealed windows. In addition, the amount of outside air introduced into buildings was reduced. The second reason is that more chemical-containing products,office supplies, equipment, and pesticides have been introduced into the office environment increasing employee exposure. Thesechanges created IAQ health problems known as Sick Building Syndrome (SBS) or Building-Related Illnesses (BRI).WHAT IS SICK BUILDINGSYNDROME?A workplace is characterized with SBS when a substantial number of building occupants experience health and comfort problems that can be related to working indoors. Additionally,Richard J. Codey Acting GovernorINDOOR AIR QUALITYPublic Employees Occupational Safety andHealth ProgramNovember, 2004the reported symptoms do not fit the pattern of any particular illness, are difficult to trace to any specific source, and relief from thesesymptoms occurs upon leaving the building.WHAT ARE THE SYMPTOMS OF SICKBUILDING SYNDROME?Employee symptoms of SBS may include headaches; eye, nose, and throat irritation; dry or itchy skin; fatigue; dizziness; nausea; and loss of concentration.WHAT ARE BUILDING-RELATEDILLNESSES?A workplace is characterized with BRI when a relatively small number of employees experience health problems. Symptomsassociated with BRI are generally different from those associated with SBS and are often accompanied by physical signs that are identified by a physician and/or laboratoryfindings. Relief from the illness may not occur upon leaving the building. BRI are caused by microbial contamination and/or specificchemical exposures that can result in allergic and/or infectious responses. Microbialcontamiantion occurs when viruses, bacteria,or molds accumulate in areas such as heating, ventilation, and air conditioning(HVAC) systems, water-damaged ceiling tiles and carpets, hot water heaters, andhumidifiers. Chemical exposures can be generated from specific sources within the workplace, such as formaldehyde emitted from newly installed carpets.WHAT ARE THE SYMPTOMS OFBUILDING-RELATED ILLNESSES?Employee symptoms of BRI may include eye, nose, throat, and upper respiratory irritation; skin irritation or rashes; chills; fever; cough; chest tightness; congestion; sneezing; runny nose; muscle aches; and pneumonia. Examples of BRI include asthma; hypersensitivity pneumonitis; multiple chemical sensitivity; and Legionnaires’ Disease.WHAT ARE THE SPECIFIC CAUSESOF SBS AND BRI?The IAQ problems that cause SBS and/or BRI may include:Lack of fresh air;If insufficient fresh air is introduced intooccupied spaces, the air becomes stagnant and odors and contaminants accumulate.Lack of fresh air in occupied areas is thenumber one cause of SBS.Poorly maintained or operated ventilation systems;Mechanial ventilation systems must beproperly maintained and operated based on the original design or prescribed procedures.If these systems are neglected, their ability to provide adequate IAQ decreases. Oneproblem associated with poorly maintainedsystems is missing, overloaded, or inefficient filters. This can cause higher levels of dust, pollen, and cigarette smoke to enteroccupied spaces. Another problem isclogged condensate drain pans and drainlines in HVAC systems, which allow water to accumulate. The accumulation of water can lead to microbial contamination. Poorlymaintained ventilation systems cancontribute to both SBS and BRI.Disruption of air circulation throughout the occupied spaces;The quality of the air depends on the effectiveness of air distribution. If the air circulation is disrupted, blocked, or otherwise does not reach occupied areas, it can become stagnant. File cabinets, bookshelves, stored boxes, dropped ceiling tiles, added office walls, cubicles, and partitions can block or divert the supply of air to occupied spaces.Poorly regulated temperature and relative humidity levels;If the temperature and/or relative humidity levels are too high or too low, employees may experience discomfort, loss of concentration, eye and throat irritation, dry skin, sinus headaches, nosebleeds, and the inability to wear contact lenses. If relative humidity levels are too high, microbial contamination can build up and can cause BRI.Indoor and outdoor sources of contamination;Chemical emissions can contribute to BRI and SBS. Chemical contaminants in an office environment either originate from indoor sources or are introduced from outdoor sources. Common sources include emissions from office machinery or photocopiers; cigarette smoke; insulation; pesticides; wood products; synthetic plastics; newly installed carpets; glues and adhesives; new furnishings; cleaning fluids; paints; solvents; boiler emissions; vehicle exhaust; roof renovations; and contaminated air from exhaust stacks. Contaminants found in indoor environments can also include radon; ozone; formaldehyde; volatile organic compounds; ammonia; carbon monoxide; particulates; nitrogen and sulfure oxides; and asbestos.2WHAT IS CONSIDEREDACCEPTABLE IAQ?The American Society of Heating, Refrigerating and Air-Conditioning Engineers, Inc. (ASHRAE) defines acceptable IAQ as:“air in which there are no knowncontaminants at harmful concentrations asdetermined by cognizant authorities and with which a substantial majority (80% or more) of the people exposed do not expressdissatisfaction.”WHAT CAN BE DONE IF THE AIRQUALITY IS UNACCEPTABLE?In order to understand and resolve IAQ problems and concerns, standard investigative procedures should be followed. Investigating IAQ complaints, however, can be very complicated due to employee concerns, unknown sources of contamination, and the complexities of buildings and their ventilation systems. The New Jersey Department of Health and Senior Services, Public Employees Occupational Safety and Health (PEOSH) Program recommends the following general investigative procedures:•Conduct employee interviews to obtainpertinent information regarding whatsymptoms are being experienced, howmany employees are affected, when theyare affected, where they work, what theydo, etc. - this information may identifypossible IAQ problems;•Review building operations andmaintenance procedures to determinewhen and what type of chemicals are being used during cleaning, floor waxing andstripping, painting, gluing, pesticidespraying, roofing operations, and renovation and construction activities, etc. - alsodetermine when deliveries occur, whichmay generate vehicle exhaust, or iffurniture, drapery, or office equipment hasbeen recently installed;•Conduct a walk-through inspection toevaluate possible sources that maycontribute to IAQ complaints;•Inspect the HVAC system, window airconditioners, office dehumidifiers, etc., inorder to determine if the systems areworking properly and are in good condition;•Review the building blueprints of theductwork and ventilation system todetermine if the system is adequatelydesigned;•Conduct air sampling, if necessary, todetermine if specific contaminants arepresent or if adequate fresh air is beingsupplied.HOW CAN IAQ PROBLEMS BE CORRECTED AND/OR PREVENTED? ENSURE ADEQUATE FRESH AIR SUPPLYThis has been shown to be the single most effective method for correcting and preventing IAQ problems and complaints. To ensure that adequate fresh air is supplied to occupied spaces, the following is recommended:• A preventive maintenance schedule mustbe developed and followed in accordancewith the manufacturer’s recommendationsor with accepted practice to ensure that theventilation systems are properly checked,maintained, and documented.•The preventive maintenance scheduleshould include the inspection andmaintenance of ventilation equipment and/or system, making sure that:−outdoor air supply dampers are opened as designed and remain unobstructed;3−fan belts are operating properly, in good condition, and replaced when necessary;−equipment parts are lubricated;−motors are properly functioning and in good operating condition;−diffusers are open and unobstructed for adequate air mixing;−the system is properly balanced;−filters are properly installed and replaced at specified intervals;−components that are damaged orinoperable are replaced or repaired as appropriate; and −condensate pans are properly draining and in good condition.•To achieve acceptable IAQ, outdoor airshould be adequately distributed to all office areas at a minimum rate of 20 cubic feet per minute (cfm) per person OR theconcentration of all known contaminants of concern be restricted to some specified acceptable levels as identified in ASHRAE’s “Ventiliation for Acceptable Indoor Air Quality” Standard.•To determine if the ventilation system iseffectively providing adequate fresh air,carbon dioxide (CO 2) levels should be measured; ASHRAE sets the standard(ASHRAE 62-1989) of 1000 ppm of CO 2 as the maximum recommended level for acceptable IAQ; CO 2, a byproduct of human respiration, is an indicator of the lack of fresh outdoor air and is not considered harmful at this level.•If possible, gauges should be installed toprovide information on air volumes delivered by supply and return fans.Maintenance staff should be trained to read the gauges and respond appropriately.• A sufficient supply of outside air should beprovided to all occupied spaces. Aninsufficient supply can cause the building to be at negative pressure, allowing untreated air and/or contaminants to infiltrate from outside. This can be determined byobserving the direction of air movement at windows and doors. In order to prevent this problem, the air supply and exhaust system must be properly balanced.•If the office layout is changed (e.g., byerecting partitions or new walls), ensure that adequate air flow and distribution is maintained.•Ventilation system filters should have amoderate efficiency rating (60% or more),as measured by the ASHRAE atmospheric dust spot test, and be of an extended surface type. To determine if the filters have the appropriate efficiency rating,check with the manufacturer. Prefilters (e.g., roll type) should be used before air passes through higher efficiency filters.•Avoid overcrowding of employees, andmake sure that the proper amount of outdoor air is provided based on the number of occupants.ELIMINATE OR CONTROL ALL KNOWN AND POTENTIAL SOURCES OF CONTAMINANTS,BOTH CHEMICAL AND MICROBIAL To Control Chemical Contamination:•Hazardous chemicals should be removed orsubstituted by less hazardous or non-hazardous chemicals, where possible.•Properly store all chemicals to minimizeexposure hazards.4•Use local exhaust ventilation to capture and remove contaminants generated by specific processes where appropriate. Ensure that local exhaust does not recirculate the contaminated air, but directly exhausts the contaminant outdoors. Check with the manufacturer of your office machines for guidance on ventilation requirements for their equipment.•Check to be sure that HVAC fresh air intakes or other building vents or openings are not located in close proximity to potential sources of contamination (e.g., places where motor vehicle emissions collect, downwind of exhausts, cooling towers). If necessary, raise stacks or relocate intakes or exhausts.•Isolate areas of renovation such as painting, carpet installation, etc., from occupied nonconstruction areas, through use of physical barriers and isolation of involved ventilation systems. If possible, perform this type of work in the evening or on weekends. Supplying the maximum amount of fresh air to these areas can assist in the dispersion of contaminant levels.•Use a licensed pesticide applicator for pesticide applications and follow their recommendations regarding appropriate ventilation controls.•Eliminate or reduce cigarette smoke. Smoking restrictions or designated smoking areas should be considered. The air from designated smoking areas must not be recirculated to non-smoking areas of the building.To Control Microbial Contamination:•Promptly detect and permanently repair all areas where water collection or leakage has occurred.•Maintain relative humidity at less than 60% in all occupied spaces and low air-velocity plenums. During the summer, cooling coils should be run at a low enough temperature to properly dehumidify conditioned air.•Check for, correct, and prevent further accumulation of stagnant water by maintaining proper drainage of drain pans under the cooling coils.•Due to dust or dirt accumulation ormoisture-related problems downstream ofheat exchange components (as in ductworkor plenum), additional filtration downstream may be necessary before air is introducedinto occupied areas.•Heat exchange components and drain pans should be accessible so maintenance personnel can easily inspect and clean them. Access panels or doors should be installed where needed.•Non-porous surfaces where moisture collection has promoted microbial growth(e.g., drain pans, cooling coils) should be properly cleaned and disinfected. Careshould be taken to ensure that these chemical cleaners are removed before ventilation systems are reactivated.•Porous building materials contaminated with microbial growth, such as carpets and ceiling tiles, must be replaced or disinfected to effectively eliminate contamination. Note that the American Conference of Governmental Industrial Hygienists (ACGIH) recommends that contaminated porous materials should be discarded.5RESOURCESAgencies and organizations that provide information on indoor air quality:New Jersey State Department of Health and Senior ServicesPEOSH Program, 7th FloorPO Box 360Trenton, NJ 08625-0360(609) 984-1863The PEOSH Program has an Indoor Air Quality Standard (N.J.A.C. 100-13) for public employees in New Jersey. The following publications, including a copy of the standard and additional information may be obtained from the above address or the PEOSH web site at www.nj/gov/health/eoh/peoshweb:*PEOSH “Indoor Air Quality Model Program”;*The American Industrial Hygiene Association’s Consultants’ List;*PEOSH Information Bulletin, “Mold in the Workplace, Prevention and Control”;*PEOSH Information Bulletin, “Renovation and Construction in Schools, Controlling Health and Safety Hazards”.U.S. Environmental Protection AgencyIndoor Air Quality Information ClearinghousePO Box 37133Washington, D.C. 20013-7133(800) 438-4318The United States Environmental Protection Agency (USEPA) has various publications on indoor air quality in the home, at schools, and in offices. The publications can be obtained from the address above or from the USEPA IAQ Information Clearinghouse web site at /iaq/iaqxline.html.American Conference of Governmental Industrial HygienistsKemper Woods Center1330 Kemper Meadow DriveCincinnati, OH 45240(513) 742-2020The American Conference of Governmental Industrial Hygienists (ACGIH) has a publication that addresses indoor bioaerosols issues, “Bioaerosols-Assessment and Control” Publication #3180. This publication can be obtained from the above address.American Society of Heating, Refrigerating and Air-Conditioning Engineers, Inc.1791 Tullie Circle, NEAtlanta, GA 30329(404) 636-8400The American Society of Heating, Refrigerating and Air-Conditioning Engineers (ASHRAE) has two publications that are especially useful:*ASHRAE 62-2001 “Ventilation for Acceptable Indoor Air Quality” Standard, and*ASHRAE 55-1992 “Thermal Environmental Conditions for Human Occupancy” Standard.The publications can be obtained from the address above or from the ASHRAE web site at / store.ORIG PRINTED 11/94, REV 7/96, REV 10/046PEOSH PROGRAM READER RESPONSE CARDINDOOR AIR QUALITYDear Reader:Please take a few minutes to help us evaluate this publication. Please check the following:Check the category that best describes your position: manageremployeeeducatorsafety professional occupational health professional other (specify)researcherhealth care worker____________________________________Check the category that best describes your workplace:academiamunicipal government labor organization state government municipal utilities authorityother (specify)county government____________________________________Describe how thoroughly you read this publication: cover-to-coversections of interest only (specify)________________________ other (specify)________________________How will you use this information (check all that apply): change the work environment provide information not usedchange a procedure copy and distribute other (specify)assist in researchin training__________________change training curriculum__________________Which section did you find most useful?Which section did you find the least useful and why?Other occupational health topics on which you would like to see the PEOSH Program develop an information bulletin:Other comments and suggestions:C u t h e r e , f o l d i n t h i r d s , t a p e .November 2004NO POSTAGENECESSARYIF MAILEDIN THEUNITED STATESBUSINESS R EPL Y M AILFIRST CLASS PERMIT NO. 206TRENTON, NJPOSTAGE WILL BE PAID BY ADDRESSEESTATE OF NEW JERSEYDEPT OF HEALTH & SENIOR SERVICESPEOSH PROGRAMPO BOX 360TRENTON, NEW JERSEY 08625-9985。