英语之写作--图表作文的描述性词句整理
雅思小作文饼图常用词汇、万能句型、范文整理
雅思小作文饼图常用词汇、万能句型、范文整理一、饼图常用词汇1.占比词汇-account for:占据-constitute:构成-make up:组成-represent:代表-comprise:包括-occupy:占有-consist of:由……组成2.描述数据词汇-significant:显著的-considerable:相当大的-minor:较小的-negligible:可以忽略的-substantial:大量的-slight:轻微的-moderate:适度的3.比较词汇-similar:相似的-different:不同的-compare with:与……相比1-in contrast to:与……形成对比-while:然而-whereas:然而-on the other hand:另一方面4.其他常用词汇-proportion:比例-segment:部分-percentage:百分比-distribution:分布-category:类别-sector:扇形二、饼图万能句型1.开头句型-The pie chart illustrates the proportion of categories in a specific field.-The pie chart provides information about the distribution of various segments.-The pie chart depicts the percentage of different categories in a given context.2.数据描述句型-Category A accounts for a significant proportion of the total, reaching XX%.-XX%of the total is occupied by CategoryB.emiring it the largest segment.2-Category C constitutes a considerable part, comprising XX%of the pie chart.-The proportion of Category D is relatively minor, only accounting for XX%.3.比较句型-In comparison with Category A, Category B has a higher percentage of XX%.-While Category A occupies XX%,Category B represents a larger proportion of XX%.-The distribution of Category C is similar to that of Category D, both comprising XX%.-In contrast to Category A, the percentage of Category B is significantly lower, at XX%.4.总结句型-Overall, the pie chart reveals a clear distribution of categories in the given field.-In summary, the majority of the pie chart is occupied by Category A, followed by Category B.-It can be concluded that Category C and Category D play minor roles in the overall distribution.三、实战演练题目:The pie chart below shows the main reasons for traffic accidents in a particular area. Summarise the3information by selecting and reporting the main features, and make comparisons where relevant.答案:The pie chart illustrates the main reasons for traffic accidents in a specific area. Upon analysis, several key points can be identified.First and foremost, the largest proportion of traffic accidents is caused by driver error, accounting for 45%of the total. This is followed by poor weather conditions, which constitute 25%of the accidents. Vehicle defects and road conditions each occupy 10%of the pie chart, while the remaining 10%is attributed to other factors.In comparison, driver error is the most significant factor, nearly doubling the percentage of poor weather conditions. Meanwhile, vehicle defects and road conditions share the same proportion, both comprising a minor part of the total.Overall, the pie chart reveals that driver error is the primary cause of traffic accidents in the given area, with poor weather conditions being the second most common factor. Other factors, such as vehicle defects and road conditions, play relatively minor roles in the overall distribution.4。
高考英语:满分作文经典模板之图表描述段
高考英语:满分作文经典模板之图表描述段
高考英语:满分作文经典模板之图表描述段
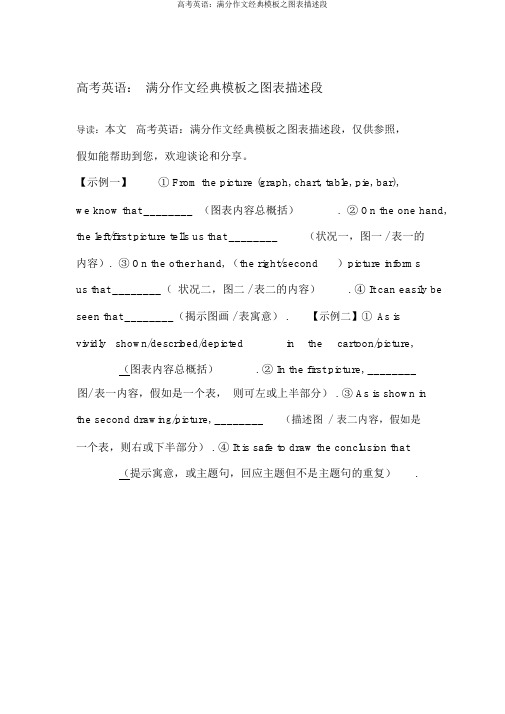
导读:本文高考英语:满分作文经典模板之图表描述段,仅供参照,
假如能帮助到您,欢迎谈论和分享。
【示例一】① From the picture (graph, chart, table, pie, bar),
we know that ________ (图表内容总概括). ② On the one hand, the left/first picture tells us that ________(状况一,图一 / 表一的
内容). ③ On the other hand, (the right/second)picture informs
us that ________(状况二,图二 / 表二的内容). ④ It can easily be seen that ________(揭示图画 / 表寓意) .【示例二】① As is
vividly shown/described/depicted in the cartoon/picture,(图表内容总概括). ② In the first picture, ________
图/ 表一内容,假如是一个表,则可左或上半部分) . ③ As is shown in the second drawing/picture, ________(描述图/表二内容,假如是
一个表,则右或下半部分) . ④ It is safe to draw the conclusion that (提示寓意,或主题句,回应主题但不是主题句的重复).。
大学英语写作“图表描写”常用句型

大学英语写作“图表描写”常用句型第一篇:大学英语写作“图表描写”常用句型大学英语写作“图表描写”常用句型大学英语写作“图表描写”常用句型描写图表不是要考生把图表中的数据全部写出来。
由于数据只起说明问题的材料作用,因此要对其有所挑选。
一个不漏地描述数据,不仅会让读者感到你的表达冗长、枯燥,而且会感觉你的表述不得要领,偏离重点。
因此,只要把最能说明问题的数据描述出来就可以了。
要做到对数据的描写有针对性,就必须用一句话把图表中所反映的问题或现象或趋势归纳出来,尽量放在文章开头表达清楚,这样做有一针见血之功能,也便于下面引用数据来阐述。
1.According to(As can be seen from / As shown in / It is clear / apparent from)the chart(graph / table / diagram / figure / statistics), ……2.The chart(graph / table / diagram)reveals(shows / suggests)that ……3.From the statistics(information)given in the table(graph / chart), we can estimate(see / conclude)t hat ……4.The number(percentage / figure)of …… nearly(almost)doubled, as compared withthat of last year.5.The figure(number / percentage)increased(dropped / decreased)more than(almost / about)six times(twice)compared with…6.The percentage(number)is twice(4 times / half)as much as that(those)of 1990.7.The rate(number)was X percent, less(more)than a half(third / quarter)of the 1998total.8.By comparison with 1990, it shot up(jumped / increased / rose / decreased / dropped /fell)by X percent(from X to Y percent / to X percent).9.By 1998, less than(more than / almost / about / over / as many as / nearly)three-quarters of(X percent of / one out of five / one in four / one half of)housewives(graduates / young couples / the number of students).10.A has almost(nearly / about / over)a quarter / half / twice / one third)as manystudents as(as much money as)B.11.During the period 1970—1999(From 1910 to 1974 / Since 1980 / Since the early 1980s)there was(has been)sudden jump(sharp rise / dramatic increase / a marked fluctuation / steady decrease / slight decline / gradual reduction / fall)in the number of people who… / personal income / college population.第二篇:考研英语写作漫画图表常用句型九.考研英语写作漫画图表常用句型列举几个常用于描述漫画的句式:1.The cartoon/picture briefs/depicts/shows...例句:The cartoon briefs the history of commercial fishing in the 20th century.2. In the picture,...例句:In the picture, an American girl looks so pleased in the richly decorated Chinese national costumes.3.Looking at the picture,...例句:Looking at the picture, many people cannot help laughing....4....。
图表作文的一些常用描述词语「雅思」
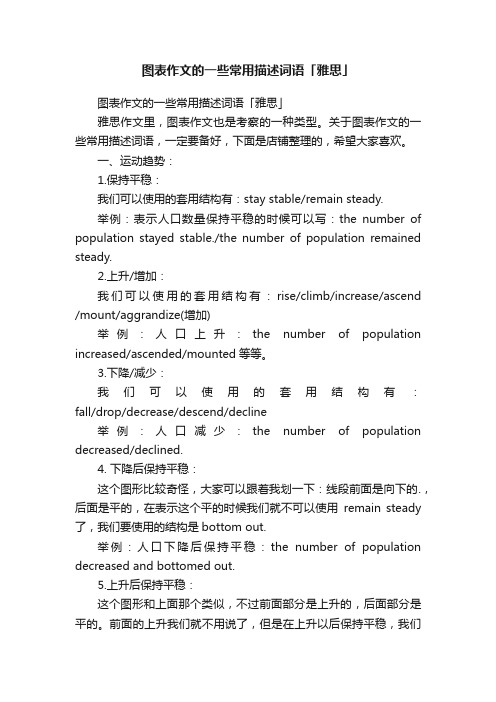
图表作文的一些常用描述词语「雅思」图表作文的一些常用描述词语「雅思」雅思作文里,图表作文也是考察的一种类型。
关于图表作文的一些常用描述词语,一定要备好,下面是店铺整理的,希望大家喜欢。
一、运动趋势:1.保持平稳:我们可以使用的套用结构有:stay stable/remain steady.举例:表示人口数量保持平稳的时候可以写:the number of population stayed stable./the number of population remained steady.2.上升/增加:我们可以使用的套用结构有:rise/climb/increase/ascend /mount/aggrandize(增加)举例:人口上升:the number of population increased/ascended/mounted等等。
3.下降/减少:我们可以使用的套用结构有:fall/drop/decrease/descend/decline举例:人口减少:the number of population decreased/declined.4. 下降后保持平稳:这个图形比较奇怪,大家可以跟着我划一下:线段前面是向下的.,后面是平的,在表示这个平的时候我们就不可以使用remain steady 了,我们要使用的结构是bottom out.举例:人口下降后保持平稳:the number of population decreased and bottomed out.5.上升后保持平稳:这个图形和上面那个类似,不过前面部分是上升的,后面部分是平的。
前面的上升我们就不用说了,但是在上升以后保持平稳,我们需要使用level off.举例:人口上升后保持平稳:number of population mounted and leveled off.6.复苏:前面下降了以后,然后就上升了,这两条线段的连接点就叫复苏。
图表英语作文句子表达
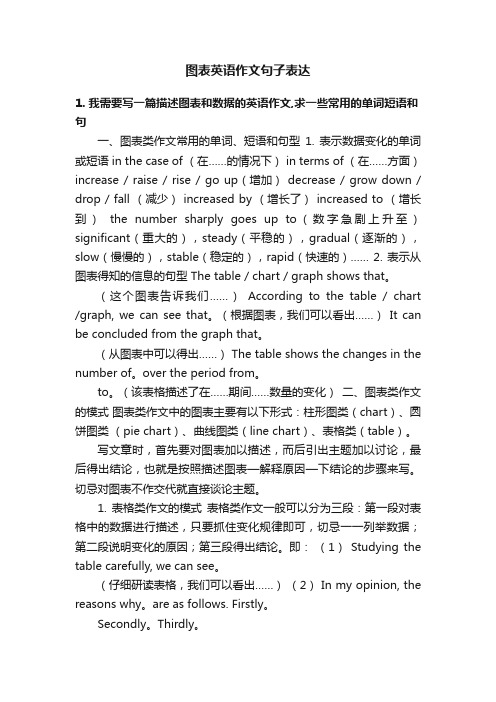
图表英语作文句子表达1. 我需要写一篇描述图表和数据的英语作文,求一些常用的单词短语和句一、图表类作文常用的单词、短语和句型1. 表示数据变化的单词或短语 in the case of (在……的情况下) in terms of (在……方面)increase / raise / rise / go up(增加) decrease / grow down / drop / fall (减少) increased by (增长了) increased to (增长到)the number sharply goes up to(数字急剧上升至)significant(重大的),steady(平稳的),gradual(逐渐的),slow(慢慢的),stable(稳定的),rapid(快速的)…… 2. 表示从图表得知的信息的句型 The table / chart / graph shows that。
(这个图表告诉我们……)According to the table / chart /graph, we can see that。
(根据图表,我们可以看出……)It can be concluded from the graph that。
(从图表中可以得出……) The table shows the changes in the number of。
over the period from。
to。
(该表格描述了在……期间……数量的变化)二、图表类作文的模式图表类作文中的图表主要有以下形式:柱形图类(chart)、圆饼图类(pie chart)、曲线图类(line chart)、表格类(table)。
写文章时,首先要对图表加以描述,而后引出主题加以讨论,最后得出结论,也就是按照描述图表—解释原因—下结论的步骤来写。
切忌对图表不作交代就直接谈论主题。
1. 表格类作文的模式表格类作文一般可以分为三段:第一段对表格中的数据进行描述,只要抓住变化规律即可,切忌一一列举数据;第二段说明变化的原因;第三段得出结论。
雅思小作文描述图表地道短语句型

雅思小作文
see an upward trend
• 呈现上升的趋势 • The housing market saw an upward trend in 2003.
witness a downward trend
• 呈现出下降的趋势 • The prices of consumer goods witnessed a downward trend.
… is projected to …
• 预计将会… • The figure is projected to reach 26.18% by 2050.
… is forecast to …
• 预计将会… • The figure is forecast to reach 26.18% by 2050.
maintain the same level
• 维持在某一水平上 • The number of cases of the disease maintained the same level in
2009.
remain stable
• 维持在某一水平上 • The number of cases of the disease remained relatively stable in
soar to…
• 飞速上升至… • The rate of heart disease soared to 70 per 1, 000 people.
peak at…
• 在某位置到达最高点 • The figures show that the unemployment rate peaked at 9.8% in
fall continuously from … to …
英语作文 图标数据类基础写作

几种现象或观点对比 (一)相同对比 1. 男女生喜欢喜欢新潮衣服的数量都在增加/减少。 The number of the boys liking fashion clothes enjoys/suffers the same increase as it does for girls./ which holds true with regard to girls. 2. 喜欢周董的男生比例和喜欢周董的女生比例相同。 The percentage of the boys admiring Mr Zhou is the same as that of the girls. 3.调查显示 50% 的美国人在学习汉语,仅有10%的英 国人也在学习汉语。 According to the survey, 50% of Americans are leaning Chinese, compared with only 10% of the British.
重点注意: 1. 并不是图表中所有的数字都有用; 上周,我们以“谁是你的偶像”为题,在2600名学生 中 进行了一次调查(survey)。以下是调查数据: 偶像(idol) 女生 男生 伟人 18% 18% 父母 25% 11% 影视明星 50% 14% 体育明星 6% 48% 没有偶像 1% 9%
(二)不同对比 1. 大约百分之三十的人反对,同时百分之三十的赞同。 About 30% of the people are against it, which is the opposite to the people who are for it. 2. 80%中国人认为应该养成存钱的习惯,而超过90% 的美国人认为应该学会花钱。 80% of Chinese hold the belief that we should from the habit of paying money away, while more than 90% of Americans are against it./ disapprove of it.
英语饼图作文万能模板
图表类作文常用的句型第一段:描述图表;第二段:分析原因/解释现象;第三段:总结。
一、第一段①句常用句型(大致描述)提供信息:The table provides information about…该表提供了有关……的信息。
展示趋势:The table clearly shows / demonstrates / depicts that …该表清楚地表明/证明/描述…由表可知:We can see from the above chart that…从上面的图表我们可以看出…It can be seen (from the chart) that…从图表中可以看出…As is shown from the above chart,…如上图所示,…It is manifest from the graph that…从图中可以看出…According to the table, …根据表格,…[图表]替换词:table(表格); chart(图表); pie chart(饼图); curve chart(曲线图); bar chart (柱状图); line chart(折线图).[表明/描述]替换词:show(表明); demonstrate(证明); depict(描述); portray(描绘); manifest(表明).[清晰地/明显地]替换词:clearly(清楚地); apparently(显然地); manifestly(明白地); obviously (明显地); explicitly(明确地).二、第一段②③句常用句型(细致描述)动态模板:The bar chart above demonstrates a change of _____ from the year to _____ respectively. According to the data given, we can easily notice that the number of _____ has a steady and slight increase from _____ in _____ to _____ in _____. Meanwhile, we find that thenumber _____ ascends sharply from _____ in _____ to _____ in _____.上述柱状图分别展示了_____年到_____年间_____的变化情况。
- 1、下载文档前请自行甄别文档内容的完整性,平台不提供额外的编辑、内容补充、找答案等附加服务。
- 2、"仅部分预览"的文档,不可在线预览部分如存在完整性等问题,可反馈申请退款(可完整预览的文档不适用该条件!)。
- 3、如文档侵犯您的权益,请联系客服反馈,我们会尽快为您处理(人工客服工作时间:9:00-18:30)。
英语之写作--图表作文的描述性词句整理一、图表作文写作常识1、图形种类及概述法:泛指一份数据图表:a data graph/chart/diagram/illustration/table饼图:pie chart直方图或柱形图:bar chart / histogram趋势曲线图:line chart / curve diagram表格图:table流程图或过程图:flow chart / sequence diagram程序图:processing/procedures diagram2、常用的描述用法The table/chart diagram/graph shows (that)According to the table/chart diagram/graphAs (is) shown in the table/chart diagram/graphAs can be seen from the table/chart/diagram/graph/figures,figures/statistics shows (that)……It can be seen from the figures/statisticsWe can see from the figures/statisticsIt is clear from the figures/statisticsIt is apparent from the figures/statisticstable/chart/diagram/graph figures (that)……table/chart/diagram/graph shows/describes/illustrates how……3、图表中的数据(Data)具体表达法数据(Data)在某一个时间段固定不变:fixed in time在一系列的时间段中转变:changes over time持续变化的data在不同情况下:增加:increase / raise / rise / go up ……减少:decrease / grow down / drop / fall ……波动:fluctuate / rebound / undulate / wave ……稳定:remain stable / stabilize / level off ……最常用的两种表达法:动词+副词形式(Verb+Adverb form)形容词+名词形式(Adjective+Noun form)二、相关常用词组1、主章开头图表类型:table、chart、diagramgraph、column chart、pie graph描述:show、describe、illustrate、can be seen from、clear、apparent、reveal、represent 内容:figure、statistic、number、percentage、proportion2、表示数据变化的单词或者词组rapid/rapidly 迅速的,飞快的,险峻的dramatic/dramatically 戏剧性的,生动的significant/significantly 有意义的,重大的,重要的sharp/sharply 锐利的,明显的,急剧的steep/steeply 急剧升降的steady/steadily 稳固的,坚定不移的gradual/gradually 渐进的,逐渐的slow/slowly 缓慢的,不活跃的slight/slightly 轻微的、略微地stable/stably 稳定的3、其它在描述中的常用到的词significant changes 图中一些较大变化noticeable trend 明显趋势during the same period 在同一时期grow/grew 增长distribute 分布,区别unequally 不相等地in the case of adv.在……的情况下in terms of / in respect of / regarding 在……方面in contrast 相反,大不相同government policy 政府政策market forces 市场规率measure n.尺寸,方法,措施v.估量,调节forecast n.先见,预见v.预测三、考研英语图表写作套句精选1.the table shows the changes in the number of……over the period from……to……该表格描述了在……年之……年间……数量的变化。
2.the bar chart illustrates that……该柱状图展示了……3.the graph provides some interesting data regarding……该图为我们提供了有关……有趣数据。
4.the diagram shows (that)……该图向我们展示了……5.the pie graph depicts (that)……该圆形图揭示了……6.this is a cure graph which describes the trend of……这个曲线图描述了……的趋势。
7.the figures/statistics show (that)……数据(字)表明……8.the tree diagram reveals how……该树型图向我们揭示了如何……9.the data/statistics show (that)……该数据(字)可以这样理解……10.the data/statistics/figures lead us to the conclusion that……这些数据资料令我们得出结论……11.as is shown/demonstrated/exhibited in the diagram/graph/chart/table……如图所示……12.according to the chart/figures……根据这些表(数字)……13.as is shown in the table……如表格所示……14.as can be seen from the diagram,great changes have taken place in……从图中可以看出,……发生了巨大变化。
15.from the table/chart/diagram/figure,we can see clearly that……or it is clear/apparent from the chart that……从图表我们可以很清楚(明显)看到……16.this is a graph which illustrates……这个图表向我们展示了……17.this table shows the changing proportion of a & b from……to……该表格描述了……年到……年间a与b的比例关系。
18.the graph,presented in a pie chart, shows the general trend in……该图以圆形图形式描述了……总的趋势。
19.this is a column chart showing……这是个柱型图,描述了……20.as can be seen from the graph,the two curves show the flutuation of……如图所示,两条曲线描述了……的波动情况。
21.over the period from……to……the……remained level.在……至……期间,……基本不变。
22.in the year between……and……在……年到……期间……23.in the 3 years spanning from 1995 through 1998……1995年至1998三年里……24.from then on/from this time onwards……从那时起……25.the number of……remained steady/stable from (month/year) to (month/year)。
……月(年)至……月(年)……的数量基本不变。
26.the number sharply went up to……数字急剧上升至……27.the percentage of……stayed the same between……and…………至……期间……的比率维持不变。
28.the figures peaked at……in(month/year)……的数目在……月(年)达到顶点,为……29.the percentage remained steady at……比率维持在……30.the percentage of……is sightly larger/smaller than that of…………的比例比……的比例略高(低)。
31.there is not a great deal of difference between……and…………与……的区别不大。
32.the graphs show a threefold increase in the number of……该图表表明……的数目增长了三倍。
33……decreased year by year while……increased steadily.……逐年减少,而……逐步上升。
34.the situation reached a peak(a high point at) of[%].……的情况(局势)到达顶(高)点,为……百分点。
35.the figures/situation bottomed out in……数字(情况)在……达到底部。
36.the figures reached the bottom/a low point/hit a trough.数字(情况)达到底部(低谷)。
37.a is ……times as much/many as b.a是b的……倍。
38.a increased by……a增长了……39.a increased to……a增长到……40.high/low/great/small/ percentage.比低高(低)41.there is an upward trend in the number of…………数字呈上升趋势。
42.a considerable increase/decrease occurred from……to…………到……发生急剧上升。