英语图表作文写作方法及范文分析
(完整)高考英语写作图表说明文模板范文
高考英语指导写作专题:图表说明文一,图表说明1,分类:数字表、函数关系图、曲线图(graph);表格(table);几何图形(figure);图形表、饼状图(pie chart);条状图、柱状图(bar chart);平面图、示意图、外形图(diagram)。
2,一般可分三个层次来写:按照题目要求描述图表反映的总情况,即概括大意。
对数字进行仔细的比较,抓住特点进行分析、归纳并找出产生变化的原因。
读图表后的想法、结论、评论或针对反映出的问题采取的解决措施。
二.表达方式:1,常用的描述句型The table/chart/diagram/graph shows that ...According to the table/chart/diagram/graph...As is shown in the table/chart/diagram/graph...As can be seen from the table/chart/diagram/graph/figures...We can see from the figures/statistics...It is clear/ apparent from the figures/statistics...2.图表中数据(data)的具体表达法数据(data)在某一个时间段固定不变:fixed in time在一系列的时间段中转变:changes over time增加:increase/raise/rise/...减少:decrease/grow down/drop/fall/decline稳定:remain stable3.描写变化的形容词及副词rapid/rapidly,dramatic/dramatically,significant/significantly,sharp/sharplysteep/steeply,steady/steadily,gradual/gradually,slow/slowly,slight/slightly三、写作模板As (is) shown/indicated by the figure/in the table/graph/pie chart/chart,_____ has been increased/decreased significantly/steadily from _____ to_____. From the sharp decline/rise in the chart,it goes without saying that_____.There are at least two reasons accounting for / contributing to ____. On the one hand, _____ On the other hand, _____. _____is due to the fact that_____. In addition,_____is responsible for_____. Maybe there are other reasons to show. But it is generally believed that the above mentioned reasons are commonlyconvincing/persuasive.As far as I am concerned,I hold the view that_____. I am sure my opinion is both sound and well-grounded.四,作文范例1,最近你校对中学生的消费情况进行了调查。
英语图表作文写作方法
英语图表作文写作方法一、图表作文写作模式图表作文是一种以图表的形式出现,提示的信息隐含在图表之中。
考生必须先仔细研读图表,使图表中的数据、曲线、图形等成为与短文标题相关并能为我所用的有意义的信息。
读图时务必要把握表层信息和深层含义这两方面的内容,主要考的是考生对图表深层次信息(原因、根源、可能导致的后果等)的挖掘和阐述。
1. 图表的类型1)泛指一份数据图表:a data graph/chart/diagram/illustration/table2)饼图:pie chart3)直方图或柱形图:bar chart / histogram4)趋势曲线图:line chart / curve diagram5)表格图:table6)流程图或过程图:flow chart / sequence diagram7)程序图:processing/procedures diagram8)统计表格:table2. 图表作文的一般要求性A.通常采用下列统一的标准提纲:1) 现状——图表揭示的表面变化2) 原因分析/导致问题——引起变化的深层次社会根源/该变化带来的种种问题3) 启示/建议——从图表所体现的变化趋势中得到的启示/提出个人建议B.解析图表步骤:在图表作文审题的时候,关键是拿起笔来圈定上面的重要信息、重要规律、重要数据、重要分配,描述图表并不意味着要把整个图表的一切信息包含在你的文章中,要传达的信息一定是最重要的信息。
C. 图表解析段落的内容结构:1)开头,可用笼统的一句话来交代,根据图表所示某个方面在某个时间段内发生了某种变化。
2)中间,可用两到三句话具体分析图表中显示的变化,描述单方面趋势(分支观点),数据分析(论证)。
抓住主要的显著的变化进行描述,相近的类别归为一类进行描述。
独特的类别要交代,以免漏掉重要信息;不是每个数据都要写,重要数据一定要提到;不要在所有数据间来回对照对比;3)结论,可用一句话简单再概括图表体现的变化趋势;不要涉及个人看法。
英语图表图画作文写作方法及范文分析

Pie Chart(饼图)
• 这种图表多数用来表示各种事物在总数百 这种曲线图用来表示一种事物的上升趋势 或下降趋势。
Bar Graph(条形棒图)
• 一般用来比较几种事物在同一时期上升或 者下降的情况。
Table(表格图)
• 这种图表用于表示多种事物间的相互关系。
100% 80% 60% 40% 20% 0%
68% 54%
78% 42% 26%
1
NEWS
2
MOVIES
3
SPORTS
4
SPECIALS
5
DOCUMENTARY
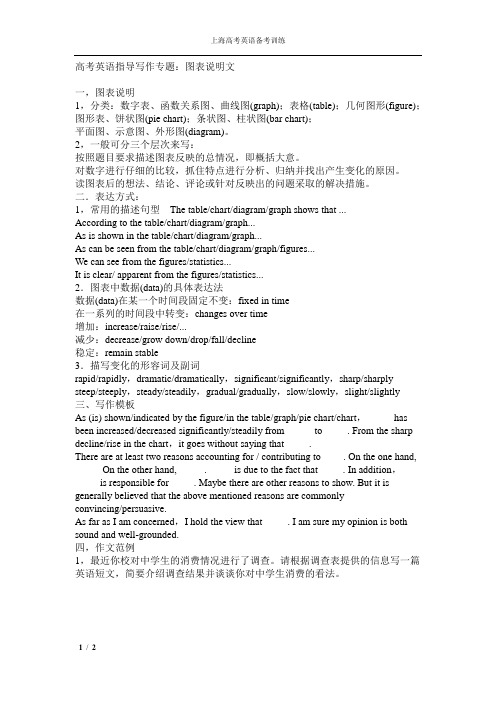
• Enthusiasm for Sports. You must write no less than 120 words and explain WHY many TV viewers like to watch sports.
as much as that of 1990.
something of a plateau 6. It has reached approached 50 percent risen to an average of 50 percent in the recent 5 years. in the past few years. since 1992.
图表和图画作文
怎样分析和描述图表
(Writing a Composition According to Tables and Graphs)
Table of Contents
• • • •
• • • •
图表作文和一般作文的区别 看懂图表要领(1) 看懂图表要领(2) 图一、图二分析
易犯错误&解决方法 常用数字表达法 Basic Writing Structure etc. More Exercises
雅思英语图表作文范文(必备3篇)

雅思英语图表作文范文第1篇A类雅思各类图表作文要点及范文一.曲线图解题关键1曲线图和柱状图都是动态图,解题的切入点在于描述趋势。
2在第二段的开头部分对整个曲线进行一个阶段式的总分类,使写作层次清晰,同时也方便考官阅卷。
接下来再分类描述每个阶段的specifictrend,同时导入数据作为分类的依据。
3趋势说明。
即,对曲线的连续变化进行说明,如上升、下降、波动、持平。
以时间为比较基础的应抓住“变化”:上升、下降、或是波动。
题中对两个或两个以上的变量进行描述时应在此基础上进行比较,如变量多于两个应进行分类或有侧重的比较。
4极点说明。
即对图表中最高的、最低的点单独进行说明。
不以时间为比较基础的应注意对极点的描述。
5交点说明。
即对图表当中多根曲线的交点进行对比说明。
6不要不做任何说明就机械地导入数据,这不符合雅思的考试目的。
曲线图常用词汇动词—九大运动趋势一:表示向上:increase,rise,improve,grow,ascend,mount,aggrandize,goup,climb, take off, jump,shoot up暴涨,soar,rocket, skyrocket雅思英语图表作文范文第2篇It is said that countries are becoming similar to each other because of the global spread of the same products, which are now available for purchase almost anywhere. I strongly believe that this modern development is largely detrimental to culture and traditions worldwide.A country’s history, language and ethos are all inextricably bound up in its manufactured artefacts. If the relentless advance of international brands into every corner of the world continues, these bland packages might one day completely oust the traditional objects of a nation, which would be a loss of richness and diversity in the world, as well as the sad disappearance of t he manifestations of a place’s character. What would a Japanese tea ceremony be without its specially crafted teapot, or a Fijian kava ritual without its bowl made from a certain type of tree bark?Let us not forget either that traditional products, whether these be medicines, cosmetics, toy, clothes, utensils or food, provide employment for local people. The spread of multinational products can often bring in its wake a loss of jobs, as people urn to buying the new brand,perhaps thinking it more glamorous than the one they are used to. This eventually puts old-school craftspeople out of work.Finally, tourism numbers may also be affected, as travelers become disillusioned with finding every place just the same as the one they visited previously. To see the same products in shops the world over is boring, and does not impel visitors to open their wallets in the same way that trinkets or souvenirs unique to the particular area too.Some may argue that all people are entitled to have access to the same products, but I say that local objects suit local conditions best, and that faceless uniformity worldwide is an unwelcome and dreary prospect.Heres my full answer:The line graphs show the average monthly amount that parents in Britain spent on their children’s s porting activities and the number of British children who took part in three different sports from 2008 to is clear that parents spent more money each year on their children’s participation in sports over the six-year period. In terms of the number of children taking part, football was significantly more popular than athletics and 2008, British parents spent an average of around £20 per month on their children’s sporting activities. Parents’ spending on children’s sports increased gradually over the followi ng six years, and by 2014 the average monthly amount had risen to just over £ at participation numbers, in 2008 approximately 8 million British children played football, while only 2 million children were enrolled in swimming clubs and less than 1 million practised athletics. The figures for football participation remained relatively stable over the following 6 years. By contrast, participation in swimming almost doubled, to nearly 4 million children, and there was a near fivefold increase in the number of children doing athletics.剑桥雅思6test1大作文范文,剑桥雅思6test1大作文task2高分范文+真题答案实感。
英语作文图表作文(五篇范文)

英语作文图表作文(五篇范文)第一篇:英语作文图表作文图表分析作文1As is clearly shown in the table/ figure/ graph / chart, 图表总体描述 between 年代 and 年代.Especially, 突出的数据变化.There are three reasons for 具体表示急剧上升、下降或特殊现象的词.To begin with, 原因一.In addition / Moreover, 原因二.For example, 具体例证.Last but no least, 原因三.In short,总结上文.As far as I am concerned, / For my part, / As for me,作者自己的观点.On the one hand, 理由一.On the other hand, 理由二.In brief,总结上文.图表分析作文2The table / figure / graph / chart shows that 图表总述from 年代to年代.It is self-evident that突出的数据变化.Three possible reasons contribute to 具体表示急剧上升、下降或特殊现象的词或代词代替上文内容.One reason is that原因一.Another reason is that 原因二.For instance,举例证.What’s more原因三.As a result, 重述上文之趋势.However, in my opinion 作者观点.For one thing,理由一.For another, 理由二.T o sum up,总结上文.图表分析作文3It can be seen from the table / figure / graph / chart that图表总述between年代and年代.Especially,突出的数据变化.Why are there such great changes during 图表涉及的年头数years? There are mainly two reasons explaining具体表示急剧上升、下降或特殊现象的词或代词代替上文内容.First,原因一.In the old days,比较法说明过去的情况.But now,说明现在的情况.Second,原因二.As a result,总结上文.In my viewpoint,作者自己的观点.On the one hand,论点一.On the other hand,论点二.图表分析作文4As the table / figure / graph / chart shows,图表总述in the past years年代.Obviously,突出的数据变化.Why are there suchsharp contrasts during 图表涉及的年头 years?Two main factors contribute to具体表示急剧上升、下降或特殊现象的词或代词代替上文内容.First of all,原因一.In the past,比较法说明过去的情况.But now 说明现在的情况.Moreover,原因二.Therefore,总结上文.As I see it,作者自己的观点.For one thing,论点一.For another,论点二.图表作文补充句型• As is shown in the graph…如图所示…•The graph shows that…图表显示…•As can be seen from the table,…从表格中可以看出…•From the chart, we know that…从这张表中,我们可知…• All these data clearly prove the fact that… 所有这些数据明显证明这一事实,即…• The increase of ….In the ci ty has reached to 20%.….在这个城市的增长已达到20%.• In 1985, the number remained the same.1985年,这个数字保持不变.• There was a gradual decline in 1989.1989年,出现了逐渐下降的情况.第二篇:英语图表作文图表描述专题训练(一)这类作文时,注意以下几点:第一,审题时,除了要把握好图表的表层信息外,还要分析图标的深层含义,如原因、根源、可能的发展趋势等。
英语图表图画作文写作方法及范文分析

语言表达
• 抓住了所要评论的问题,接着就是先把它 用语言表述出来。在描写中,对数字的运 用要有针对性,不要把图表中的数字全描 写出来。
图一:第一段表达
• Each year thousands upon thousands of graduates flood the job market, waving their college diplomas and certificates, expecting better jobs in their majors, only to be frustrated and disappointed. According to the charts, only 58% percent of college graduates in 1992 could find jobs in their specialties, compared with 89% percent in 1981 when China had its first college graduates after the Cultural Revolution. Why do college graduates find it increasingly difficult to get a rewarding job?
例2
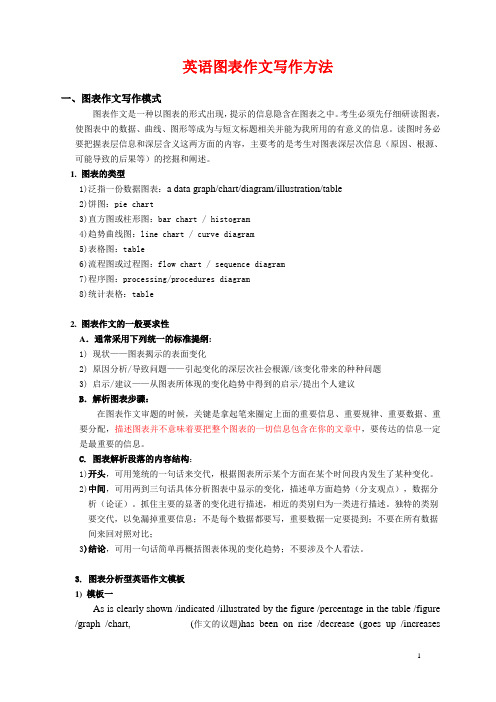
• Rising Divorce Rates in China
Sample
In recent years the divorce rate in China has increased drastically. According to a 1992 Census Bureau report on marriage and divorce in some big cities, during the past five years, the divorce rate has increased as much as it had in the entire previous twenty years. In 1967 there were only 0.5 divorced persons for every 1000 married people, and in 1987 the rate was 7 per thousand, but in 1992 the rate jumped to 15 divorced per 1000 married.
高考英语写作之图表作文(格式与范例)
高考英语书面表达练习——图表作文(格式与范例)作文一假如你是李华,在最近的研究性学习当中,受《21世纪中学生英语报》(The 21st Century)之邀,你对你所在的班60名同学(男女各半)进行了上网目的的调查。
现将调查结果(如下表所示)用英语给报社的编辑写一封信,报道此事,以引起舆论的关注,并提出你的观点和建议。
注意:1、报道应包括图表所示全部内容,可适度发挥。
2、文章的开头与结尾已给出,不计入总词数。
3、词数: 1504、参考词汇:调查: make a surveyDear editor,I have recently made a survey among 30 boys and 30 girls in my CLASs about their purpose of getting on the Internet. ______________________________________________作文二下列表格为某市1996年与2006年人们度假方式的情况比较,请按表格内容写一篇150词左右的短文,并对度假方式变化原因加以简要评析。
年度1996 2006 原因境外旅游11% 22% 收入增加海边度假38% 31% 海水污染爬山野营11% 34% 回归自然The way people spend their holidays changed a lot from 1996 to 2006.[思路点拨]题材:书信;说明+议论时态:一般现在时人称:第三人称要点提示:(1)上网的目的;(2)读新闻;(3)发送邮件;(4)聊天;(5)学习;(6)玩游戏;(7)评语篇章结构:文章可分两段[文采修饰]连接词的选用:but, both…, and, moreover, otherwise高级词汇的选用:keep in touch with, as for…, use… as …, benefit from, pay attention to, altogether, in one’s opinion.复杂句型的选用:what…most 引导的主语从句;as 引导的让步状语从句;倒装语序等。
2023年英语四级图表作文的类型及参考范文
您目前旳位置: 首页 > 英语四级 > 英语四级作文 > 英语四级作文综合辅导 > 正文英语四级图表作文旳类型及参照范文图表作文也是四(六)级考试中常见, 并且被认为是一种较难旳作文形式。
图表作文就是把非文字信息(一般为多种图表表达旳数字信息等)转换成文字信息旳一种作文。
它规定我们用文字来描述非文字性旳图表或对图表显示旳关系作解释阐明。
下面我们先来看一看图表作文旳类型。
第一节图表作文旳类型图表作文可分为两大类: 表作文和图作文。
表作文表格(Table)可以使大量数据系统化, 便于阅读、比较。
表格常由标题(Title)、表头(Boxhead)(表格旳第一行)、侧目(Stub)(表格左边旳第一列)和主体(Body)部分(表格旳其他部分)等部分构成。
如下表:用表格体现旳信息详细精确, 并且表格中旳各项均按一定规律排列。
阅读表格时要注意找出表格中各个项目旳互相关系, 表格中各个项目旳变化规律。
例如, 上面旳表格中旳数字阐明, 和1978年相比, 1983年大学入学旳人数在增长, 而小学旳入学人数在减少。
弄清晰这些变化规律也就读懂了表格旳内容。
图作文图作文又可分为三种: 圆形图作文、曲线图作文和条状图作文。
(1) 圆形图作文圆形图(Pie chart)也称为饼状图或圆面分割图。
圆形图由于比较形象和直观, 各部分空间大小差异轻易辨别, 因此常用来表达总量和各分量之间旳比例关系。
整个圆表达总量, 楔形块表达分量。
有时圆形图尚有数值表, 两者结合可把各分量表达得更精确、清晰。
例如:Thi.i..pi.char.o.th.averag.weekl.expenditur.o..famil.i.Grea.Britain.A.ca.b.se.fr o.th.chart.th.mai.expenditur.o.a.averag.Britis.famil.i.spen.o.food.whic.account. fo.25.o.it.tota.expenditure.Th.nex.tw.significan.expendin.item.ar.transpor.an.ho using.whic.ar.15.an.12.respectively.I.w.tak.int.accoun.clothin.an.footwear.whic. make.u.10%.th.fou.essential.o.life.tha.is.food.transport.housing.an.clothin.an.f ootwear.amoun.t.62.o.th.tota.expenditure.(2) 曲线图作文曲线图(Line graph)也称为线性图或坐标图。
高考英语图画型作文写作技巧及范文
高考英语图画型作文写作技巧及范文导语:图画型作文更能考察学生的分析问题的才能,因此深受命题者的青睐。
考生应注意认真审题,一旦审题有所偏颇,不容易得到高分。
此类作文首先要描绘图画,然后对图画进展适当的阐释(解释、说明和分析),介绍图画背后所反映的问题,最后联络实际发表自己的观点,给出自己的建议、原因等等,一般写三段。
以下是为大家精心的英语图画型作文写作技巧及范文,欢迎大家参考!1、As can be seen from the chart, …;From thechart/picture /table we can see(The chart shows) that ..;As is vividly shown in the picture( 假设两个的话用pictures,也可以用drawing,同样的假设两个的话用drawings,假设是图表那么用table ,两个图表那么用 table s) above, 图画的内容。
The picture( 假设两个的话用pictures,也可以用drawing,同样的假设两个的话用drawings,假设是图表那么用table ,两个图表那么用 table s) tells ( 注意,假设是前面的图画是复数,那么用tell) us that 这个图片的大致反映的意思。
2、 Recent years people in 地名(比方中国、北京、美国等等) have witnessed the fact that 描绘图片里的现象,And it is very mon/usual to see that in recent years.1、The implied meaning of the picture(注意,同上进展单复数的处理) should be taken into aount seriously. First/To begin with, 提醒涵义/原因/结果1,Second/What’s more, 提醒涵义/原因/结果2。
英语图表作文写作方法及范文分析PPT课件
看懂图表要领(2)
• 要善于从众多的数字中抓住主要问题。给 出的图表和数字并不是要求简单的描写, 而是要求通过图表上的数字抓住所反映的 社会问题进行评论。因此从数字中看出主 要问题或现象至关重要。
• 1)借助于题目和指示里的要求来抓主要问 题。
• 2)看一下图表中的哪些数字前后变化最大。
Tips
majors • 3:Graduates who hold jobs in their majors
图一分析
• 一、借助于题目Job Problems for College Graduates,可以看出是关于大学毕业生找工作的 问题。因此尽管表中有许多数字,但只要顺着有 关工作职业的数字,就能发现图表所要反映的问 题。
图二:第一段表达
• Modern sports are becoming more spectatororiented (观赏者为导向的) than participantoriented(参与者为导向的). Just think of millions and millions of people who spend countless hours before TV sets watching sports of all sorts: Olympic Games, World Series Games and the World Cup Soccer Game. According to a survey, among various televised events, sports have the greatest number of viewers. When an important football match is televised live, the streets of a big city are often left
- 1、下载文档前请自行甄别文档内容的完整性,平台不提供额外的编辑、内容补充、找答案等附加服务。
- 2、"仅部分预览"的文档,不可在线预览部分如存在完整性等问题,可反馈申请退款(可完整预览的文档不适用该条件!)。
- 3、如文档侵犯您的权益,请联系客服反馈,我们会尽快为您处理(人工客服工作时间:9:00-18:30)。
例2
• Rising Divorce Rates in China
16 14 12 10 8 6 4 2 0 15
(per thousand)
7 3 0.5 1967 1977 1987 1992 Changes in the divorce rate in some big cities in China
图二Enthusiasm for Sports
Percentage of TV Viewers of Various Programmes
100% 80% 60% 40% 20% 0%
68% 54%
78% 42% 26%
1
NEWS
2
MOVIES
3
SPORTS
4
SPECIALS
5
DOCUMENTARY
看懂图表要领(2)
• 要善于从众多的数字中抓住主要问题。给 出的图表和数字并不是要求简单的描写, 而是要求通过图表上的数字抓住所反映的 社会问题进行评论。因此从数字中看出主 要问题或现象至关重要。 • 1)借助于题目和指示里的要求来抓主要问 题。 • 2)看一下图表中的哪些数字前后变化最大。
图一(Job Problems for College Graduates)
• Enthusiasm for Sports. You must write no less than 120 words and explain WHY many TV viewers like to watch sports.
图二:第一段表达
Tips
• 图二第一段范文中对图表上四个数据连提 都不提,就是对看体育节目人数这个作文 要讨论的主题也只是用the great number of 等笼统地加以概况。我们要讨论的是为什 么有许多人观看体育节目,而不是要介绍 各类节目的收视率,所以具体准确的数字 就没有必要写出来了。
4% 7%
12%
58%
30%
89%
1981 1 2 3 1
1992 2 3
• • • •
上图1、2 、3分别表示: 1:Graduates who continue to study 2:Graduates who take jobs irrelevant to their majors 3:Graduates who hold jobs in their majors
Sample
In recent years the divorce rate in China has increased drastically. According to a 1992 Census Bureau report on marriage and divorce in some big cities, during the past five years, the divorce rate has increased as much as it had in the entire previous twenty years. In 1967 there were only 0.5 divorced persons for every 1000 married people, and in 1987 the rate was 7 per thousand, but in 1992 the rate jumped to 15 divorced per 1000 married.
Pie Chart(饼图)
• 这种图表多数用来表示各种事物在总数百 分之一百种所占的各自比例。
Line Graph(线图)
• 这种曲线图用来表示一种事物的上升趋势 或下降趋势。
Bar Graph(条形棒图)
• 一般用来比较几种事物在同一时期上升或 者下降的情况。
Table(表格图)
• 这种图表用于表示多种事物间的相互关系。
语言表达
• 抓住了所要评论的问题,接着就是先把它 用语言表述出来。在描写中,对数字的运 用要有针对性,不要把图表中的数字全描 写出来。
图一:个数字中仅仅列举了1981和 1992年有关找专业对口的工作的毕业生人 数的两个数字,因为这是文章要重点讨论 的,其余四个数字就不必列出了。
易犯错误&解决方法
• 盲目地把图表中所有数据都描写出来,不 管是否和主题有关。 • 解决方法:可以在描写和引用数字前,先 把这些数据要反映的问题用一句话写出来。 这样就把数据看成是一种用来说明问题的 具体数据材料 (statistical evidence) 。选用 的数据必须和论述有关。
例1
• 图一第一段第一句: • Each year thousands upon thousands of graduates flood the job market, waving their college diplomas and certificates, expecting better jobs in their majors, only to be frustrated and disappointed.
怎样分析和描述图表
(Writing a Composition According to Tables and Graphs)
Table of Contents
• • • •
• • • •
图表作文和一般作文的区别 看懂图表要领(1) 看懂图表要领(2) 图一、图二分析
易犯错误&解决方法 常用数字表达法 Basic Writing Structure etc. More Exercises
图一分析
• 一、借助于题目Job Problems for College Graduates,可以看出是关于大学毕业生找工作的 问题。因此尽管表中有许多数字,但只要顺着有 关工作职业的数字,就能发现图表所要反映的问 题。 • 二、看图表哪些数字变化最大:图表中有三组六 个数字,分别表示毕业生继续读书、找专业对口 的工作和找专业不对口的工作。但以后两组数据 在十年里的变化最大。因此它们就是文章要讨论 的主要问题。
图表作文和一般作文
• 一般作文:在指示中把作文要讨论的问题 或者现象直接用文字告诉你。 • 图表作文:把问题或者现象用图表反映出 来。要求:把图表看懂,并用文字叙述出 来,才能对这个问题或现象展开讨论。
看懂图表要领(1)
• 看懂图表,弄请它所反映的问题或现象。 • 第一,熟悉图表的各种类型,了解它们的 特点和作用。常见图表有四种: