Tableau测试操作手册
Tableau超详细教程-案例实践项目

实践项目一使用Tableau创建基本视图一、实践内容、目标及要求(一)实践内容掌握Tableau创建、设计、保存视图和仪表板的基本方法和主要操作步骤。
(二)实践目标1、建立Tableau工作薄;2、转换字段类型;3、创建工作表;4、熟悉工作表视图的功能区和视图区;5、熟悉标记卡;6、熟悉筛选器;7、熟悉页面;8、创建显示各省售电量当期值的柱形图;9、创建显示各省售电量当期值的符号地图10、创建显示各省售电量当期值和同期值的双柱形图;11、创建仪表板。
二、实践准备(一)实践环境说明在Tableau官网下载Tableau Desktop10.5.1或Tableau Public10.5.1,并安装到个人电脑。
个人电脑上已安装Office2000以上版本。
(二)实践项目说明使用数据为“实践项目1-2014年各省市售电量明细表.xlsx”。
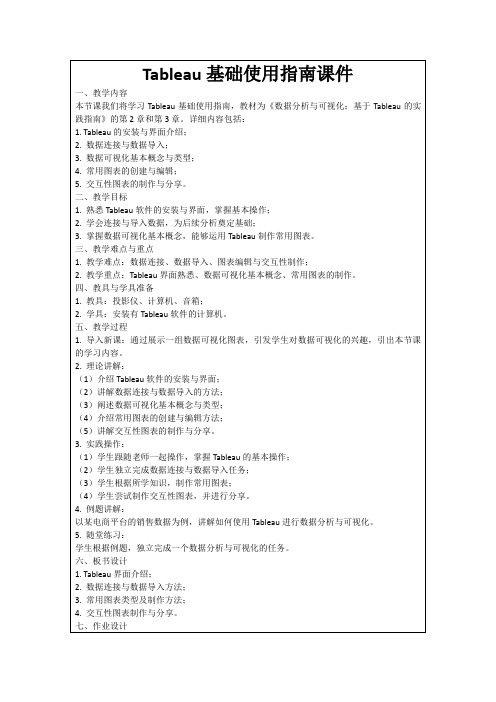
指标为售电量,统计周期为2014年01月~2014年06月,数据存储为Excel文件,结构见上图。
共有9列变量,用电类别是对售电量市场的进一步细分,包括大工业、居民、非居民、商业等9类;当期值为统计周期对应时间的售电量;同期值为上一年相同月份的售电量;月度计划值为当月的计划值。
三、实践基本步骤1、数据准备打开Tableau,“文件”—“新建”,“连接到数据”,“连接到Microsoft Excel”,选择文件“实践项目1-2014年各省市售电量明细表.xlsx”。
结果如下:2、转换字段类型(1)新建一张工作表度量窗口显示的数据角色为度量,往往是数值字段,将其拖放到功能区时,Tableau默认会进行聚合运算,同时,视图区将产生相应的轴。
维度窗口显示的数据角色为维度,往往是一些分类、时间方面的定性字段,将其拖放到功能区时,Tableau不会对其进行计算,而是对视图区进行分区,维度的内容显示为各区的标题。
比如想展示各省售电量当期值,这时“省市”字段就是维度,“当期值”为度量,“当期值”将依据各省市分别进行“总计”聚合运算。
Tableau Forensic TX1 Imager 快速参考指南说明书

BEFORE USING THE UNITFree firmware updates are provided for Tableau Forensic products on a regular basis. As a best practice before using the unit, we recommend confirming it is running current firmware. Follow the steps below to confirm the unit is running current firmware:1. On a Windows PC, visit the Tableau Download Center and download theTableau Firmware Update (TFU) installer file –/tableau/download-center2. With TX1 off, remove the TX1’s SD card from the back of the unit by firmlypushing the SD card inward until it clicks, then release.3. Connect the SD card to the Windows PC and run the TFU utility.TFU automatically determines if the firmware on the SD card is current or if an update is available. If an update is available, i t can be applied on command. PRODUCT INTRODUCTIONTX1 operates as a standalone device or with the TX1-S1 Drive Bay for forensic triage and collection of digital media. The Drive Bay offers cable-less SATA/SAS destination drive connections and drive cooling.1. Source Drive(s) – Connect one or more drives to the TX1’s source (left) side:SATA/SAS (x2), USB 3.0, PCIe*, FireWire, or IDE** .* TX1 needs to be powered off and a Tableau PCIe Adapter is required to connect PCIe media.** The Tableau IDE-PCIe Adapter [TDA7-5] is required to connect IDE drives.2. Destination Drive(s) – Connect one or more drives to the TX1’s destination(right) side: SATA/SAS (x2) or USB 3.0 . If using a Drive Bay*, insert one or more 2.5” or 3.5” SATA/SAS drives.* With TX1 powered off, align TX1 into place on top of the TX1-S1 and then slide TX1 to lock it in place. See product labels or User Guide for additional instructions.3. Ethernet – Connect a network cable to the TX1’s Ethernet port to mountnetwork shares. Network shares can be mounted as sources or destinations.4. Power – Connect the power supply to the TX1’s DC In .5. Power OnUSB 3.0 Accessory Ports (Optional) – Connect a USB storage device to save log files or a USB keyboard for easier data entry via the two front USB 3.0ports on TX1 .SD Card Slot – SD card contains the TX1’s firmware . To update firmware, insert this SD card into a Windows PC and run Tableau Firmware Update (TFU). Status LED – Located in lower right corner of the TX1’s top panel .White: TX1 starting up, Blue: active job, Green: job successful, Off: idle, Red: error/contact GETTING STARTEDHome Tab – Starts any TX1 principal operation: Duplicate, Logical, Verify, Hash, Browse, and Restore. At any time, click on “TX1” in the top menu bar to navigate back to the Home tab.Jobs Tab – Provides a jobs summary list including current jobs’ details/status, jobs in queue and recently completed jobs. To access, click on “Jobs” in the upper right corner below the displayed time.Side Navigation Menu – Located in the upper left corner , access Logs, Settings (system, network, and operation defaults), User Management, Lock system, and About (device and firmware information)Clock – After initial start-up or following a factory setting reset, verify theTX1’s date, time, and time zone are properly set:> System Settings.For a comprehensive overview of the TX1’s features and functions, see the Tableau TX1 User Guide: /tableau/hardware/forensic-imagers-duplicators CABLE RECOMMENDATIONSFor SATA/SAS Drive Use a Tableau SATA/SAS Signal & Power cable[TC4-8-R3] or Drive Bay [TX1-S1]For USB Drive Use cable supplied with USB drive enclosure ordirectly connectFor PCIe Drive*Use a Tableau PCIe cable [TC-PCIE-8]For FireWire Drive Use cable supplied with FireWire drive enclosureFor IDE Drive**Use a Tableau IDE power cable [TC2-8-R2] andTableau PCIe cable [TC-PCIE-8]Ethernet Use a Tableau CAT6a cable [TC-CAT6A] or equivalentCAT6a cableFor Power (DC In)Use a Tableau Power Supply [TP6]* TX1 needs to be powered off and a Tableau PCIe Adapter is required to connect PCIe media (sold separately).** Tableau Imager IDE Expansion Module [TDA7-5] is required for IDE drives (sold separately). SUPPORTFor Tableau Forensic product support: /support/contact/guidance ABOUT OPENTEXTOpenText, The Information Company, enables organizations to gain insight through market leading information management solutions, on-premises or in the cloud. For more information about OpenText (NASDAQ: OTEX, TSX: OTEX) visit: . CONNECT WITH US:• OpenText CEO Mark Barrenechea’s blog• Twitter|LinkedInCopyright © 2021 Open Text. All Rights Reserved. Trademarks owned by Open Text.For more information, visit: https:///about/copyright-information • 09.21 | 18895.EN。
Tableau基础使用指南

在完成数据故事的创建和配置后,可以选择“发布”功能将数据故事发布到指定的平台或服务器上。发布前需要设置 好访问权限和分享范围,确保数据安全。
互动与反馈
通过在线分享平台,观众可以实时查看和互动数据故事,提供反馈和建议。作者可以根据反馈进行持续 优化和改进,提升数据故事的质量和影响力。
07
Tableau高级功能探索
5. 用户可以根据需要对导入的数 据进行清洗、转换和整合等操作 ,以满足后续分析的需求。
03
数据视图与操作
数据视图类型介绍
数据网格视图
以表格形式展示数据,方便用户查看和编 辑数据。
数据透视表视图
提供数据的汇总和分析功能,支持拖拽字 段进行交叉表分析和数据透视。
数据透视图视图
将数据以图形化方式展示,支持多种图表 类型,帮助用户更直观地理解数据。
动作
Tableau中的动作功能可以实现不同组件之间的交 互。例如,当用户在一个图表中选择某个数据点 时,其他相关图表可以自动更新以显示与该数据 点相关的信息。
参数
通过设置参数,可以实现仪表板的动态变化。用 户可以通过调整参数值来改变仪表板的显示内容 和效果。
仪表板交互
通过设置仪表板交互选项,可以实现多个仪表板 之间的联动和交互。例如,当用户在一个仪表板 中进行操作时,其他相关仪表板可以自动更新以 反映这些变化。
简洁明了
尽量保持仪表板的简洁和明了,避免过多的图表和组件堆积,以免让 用户感到混乱。
一致性
保持仪表板整体风格的一致性,包括颜色、字体、图标等元素的统一 。
可读性
确保图表和组件的可读性,选择合适的字体大小、颜色和图表类型, 以便用户能够快速准确地获取信息。
组件添加与属性设置方法
手把手教你Tableau高级数据分析功能(附数据集)

手把手教你Tableau高级数据分析功能(附数据集)手把手教你Tableau高级数据分析功能(附数据集)原文标题:A Step-by-Step Guide to learn Advanced Tableau –for Data Science and Business Intelligence Professionals作者:Pavleen Kaur翻译:李清扬校对:卢苗苗本文共4000字,建议阅读8分钟。
本文借助高级图表创建计算深入研究数据以提取对数据的分析,并了解R如何与Tableau相互集成和使用。
简介“查看数据。
显示图表。
讲故事。
吸引观众。
”Tableau是当今数据科学和商业智能专业人员使用的最流行的数据可视化工具之一。
它使您能够以交互和多彩的方式创建具有洞察力和影响力的可视化效果图。
它的用途不仅仅是创建传统的图表和图表。
您可以使用它来挖掘可操作的数据解析,这要归功于它提供的大量功能和自定义。
以其易用性和简单的功能而闻名,制作如下所示的富有洞察力的仪表盘只需点击几下鼠标:在本文中,我们将看到一些超越拖放功能的高级图表。
我们将创建计算以深入研究数据以提取对数据的分析。
我们还将看看R如何与Tableau相互集成和使用。
本文假定您掌握丰富的使用Tableau的知识,例如基本图表形成,计算,参数等。
如果您不这样做,我会建议先参考以下文章,然后再返回此处:Tableau for Beginners - 简化数据可视化https:///blog/2017/07/data-visualisa tion-made-easy/中级Tableau指南- 适用于数据科学和商业智能专业人员https:///blog/2018/01/tableau-for-i ntermediate-data-science/ 目录1. 高级图形- 可视化超越“显示我”运动图凹凸图甜甜圈图表瀑布图帕累托图2. 在Tableau中引入R编程1. 高级图形- 可视化超越'Show Me' 几乎所有的Tableau用户都知道各种基本图形,例如介绍仪表板中显示的那些图形。
Tableau基础使用指南课件
三、交互性图表的制作与分享
交互性图表能提高数据分析的趣味性和实用性,是Tableau的特色功能之一。
1.交互性制作:在Tableau中,可以通过参数、筛选器和仪表板等功能制作交互性图表。例如,创建一个下拉菜单,实现不同类别数据的筛选;或者使用地图工具,展示不同区域的数据分布。
3.数据导入:连接数据源后,需要将所需的数据表导入Tableau工作区。此时,要注意选择正确的数据表,并了解如何处理重复数据、缺失值等问题。
二、常用图表的创建与编辑
Tableau提供了丰富的图表类型,熟练掌握常用图表的创建与编辑是提高数据分析能力的关键。
1.图表类型:Tableau内置了多种图表类型,如柱状图、折线图、饼图、散点图等。了解每种图表的适用场景和特点,有助于选择合适的图表进行数据展示。
一、数据连接与数据导入
数据连接与数据导入是Tableau进行数据分析的基础,也是本节课的重点和难点。
1.支持的数据源:Tableau支持多种数据源,包括Excel、CSV、数据库(如MySQL、SQL Server等)和云端数据等。
2.连接方法:在Tableau中,可以通过“新建数据源”功能连接到不同类型的数据源。对于数据库,需要输入相应的数据库连接信息;对于Excel和CSV,可以直接选择文件路径。
5.随堂练习:
学生根据例题,独立完成一个数据分析与可视化的任务。
六、板书设计
1. Tableau界面介绍;
2.数据连接与数据导入方法;
3.常用图表类型及制作方法;
手把手教你Tableau高级数据分析功能(附数据集)

手把手教你Tableau高级数据分析功能(附数据集)原文标题:A Step-by-Step Guide to learn Advanced Tableau –for Data Science and Business Intelligence Professionals作者:Pavleen Kaur翻译:李清扬校对:卢苗苗本文共4000字,建议阅读8分钟。
本文借助高级图表创建计算深入研究数据以提取对数据的分析,并了解R如何与Tableau相互集成和使用。
简介“查看数据。
显示图表。
讲故事。
吸引观众。
”Tableau是当今数据科学和商业智能专业人员使用的最流行的数据可视化工具之一。
它使您能够以交互和多彩的方式创建具有洞察力和影响力的可视化效果图。
它的用途不仅仅是创建传统的图表和图表。
您可以使用它来挖掘可操作的数据解析,这要归功于它提供的大量功能和自定义。
以其易用性和简单的功能而闻名,制作如下所示的富有洞察力的仪表盘只需点击几下鼠标:在本文中,我们将看到一些超越拖放功能的高级图表。
我们将创建计算以深入研究数据以提取对数据的分析。
我们还将看看R如何与Tableau相互集成和使用。
本文假定您掌握丰富的使用Tableau的知识,例如基本图表形成,计算,参数等。
如果您不这样做,我会建议先参考以下文章,然后再返回此处:Tableau for Beginners - 简化数据可视化中级Tableau指南- 适用于数据科学和商业智能专业人员-science/ 目录1. 高级图形- 可视化超越“显示我”运动图凹凸图甜甜圈图表瀑布图帕累托图2. 在Tableau中引入R编程1. 高级图形- 可视化超越'Show Me' 几乎所有的Tableau用户都知道各种基本图形,例如介绍仪表板中显示的那些图形。
这些图表可以使用Tableau的“Show Me”功能轻松完成。
但由于这是一篇面向高级用户的文章,因此我们将超越“Show Me”并探索需要额外计算的图表。
Tableau教程:数据可视化分析指南说明书

About the T utorialTableau is a Business Intelligence tool for visually analyzing the data. Users can create and distribute an interactive and shareable dashboard, which depict the trends, variations, and density of the data in the form of graphs and charts.Tableau can connect to files, relational and Big Data sources to acquire and process data. The software allows data blending and real-time collaboration, which makes it very unique. It is used by businesses, academic researchers, and many government organizations for visual data analysis. It is also positioned as a leader Business Intelligence and Analytics Platform in Gartner Magic Quadrant.AudienceThis tutorial is designed for all those readers who want to create, read, write, and modify Business Intelligence Reports using Tableau. In addition, it will also be quite useful for those readers who would like to become a Data Analyst or a Data Scientist. PrerequisitesBefore proceeding with this tutorial, you should have a basic understanding of Computer Programming terminologies and Data analysis. You should also have some knowledge on various types of graphs and charts. Familiarity with SQL will be an added advantage. Disclaimer & CopyrightCopyright 2016 by Tutorials Point (I) Pvt. Ltd.All the content and graphics published in this e-book are the property of Tutorials Point (I) Pvt. Ltd. The user of this e-book is prohibited to reuse, retain, copy, distribute or republish any contents or a part of contents of this e-book in any manner without written consent of the publisher.We strive to update the contents of our website and tutorials as timely and as precisely as possible, however, the contents may contain inaccuracies or errors. Tutorials Point (I) Pvt. Ltd. provides no guarantee regarding the accuracy, timeliness or completeness of our website or its contents including this tutorial. If you discover any errors on our website or inthistutorial,******************************************.T able of ContentsAbout the Tutorial (i)Audience (i)Prerequisites (i)Disclaimer & Copyright (i)Table of Contents (ii)TABLEAU ─ BASICS (1)1.Tableau ─ Overview (2)Tableau Features (2)2.Tableau ─ Environment Setup (3)3.Tableau ─ Get Started (7)Connect to a Data Source (7)4.Tableau ─ Navigation (10)Menu Commands (10)File Menu (11)Data Menu (12)Worksheet Menu (13)Dashboard Menu (13)Story Menu (14)Analysis Menu (15)Map Menu (16)Format Menu (17)Server Menu (18)5.Tableau ─ Des ign Flow (20)6.Tableau ─ File Types (22)7.Tableau ─ Data Types (24)8.T ableau ─ Show Me (25)Show Me with Two Fields (26)Show Me with Multiple Fields (27)9.Tableau ─ Data Terminology (28)TABLEAU ─ DATA SOURC ES (30)10.Tableau ─ Data Sources (31)11.Tableau ─ Custom Data View (33)Drill Down View (33)Swapping Dimensions (34)Creating an Extract (36)Applying Extract Filters (37)Adding New Data to Extract (38)Extract History (39)13.Tableau ─ Fields Operations (40)Adding Fields to Worksheet (40)Combining Two Fields (41)Searching Fields (41)Reordering Fields (42)14.Tableau ─ Editing Metadata (44)Checking the Metadata (44)Changing the Data Type (45)Renaming and Hiding (46)Column Alias (47)15.Tableau ─ Data Joining (48)Creating a Join (48)Editing a Join Type (49)Editing Join Fields (50)16.Tableau ─ Data Blending (51)Preparing Data for Blending (51)Adding Secondary Data Source (52)Blending the Data (53)TABLEAU - WORKSHEETS (54)17.Tabl eau ─ Add Worksheets (55)18.Tableau ─ Rename Worksheet (57)Renaming the Worksheet (57)19.Ta bleau ─ Save & Delete Worksheet (59)20.Tableau ─ Reorder Worksheet (61)21.Tableau ─ Paged Workbook (63)TABLEAU ─ CALCULATIO NS (66)22.Tableau ─ Operators (67)Types of Operator (67)23.Tablea u ─ Functions (71)24.Tableau ─ Numeric Calculations (74)25.Tableau ─ String Calculations (80)27.Tableau ─ Table Calculations (86)28.Tableau ─ LOD Expressions (87)TABLEAU ─ SORT & FIL TERS (92)29.Tableau ─ Basic Sorting (93)Computed Sorting (93)Manual Sorting (93)30.Tableau ─ Basic Filters (94)Filter Dimensions (94)Filter Measures (96)Filter Dates (99)31.Tableau ─ Quick Filters (103)Clearing the Filter (105)32.Tableau ─ Context Filters (107)Creating Context Filter (107)33.Tableau ─ Condition Filters (112)Creating a Condition Filter (112)34.Tableau ─ Top Filters (115)Creating a Top Filter (115)35.Tableau ─ Filter Operations (118)Creating Filters (118)Clearing Filters (121)TABLEAU – CHARTS (122)36.Tableau ─ Bar Chart (123)Simple Bar Chart (123)Bar Chart with Color Range (124)Stacked Bar Chart (125)37.Tableau ─ Line Chart (126)Simple Line Chart (126)Multiple Measure Line Chart (127)Line Chart with Label (128)38.Tableau ─ Pie Chart (129)Simple Pie Chart (129)Drill-Down Pie Chart (130)Simple Crosstab (132)Crosstab - Color Encoded (133)Crosstab with Row Percentage (133)40.Tableau ─ Scatter Plot (136)Simple Scatter Plot (136)Scatter Plot - Color Encoded (137)Drill-Down Scatter Plot (138)41.Tableau - Bubble Chart (140)Simple Bubble Chart (140)Bubble Chart with Measure Values (141)Bubble Chart with Measure Colors (141)42.Tableau ─ Bullet Graph (143)Creating Bubble Chart (143)43.Tableau ─ Box Plot (145)Creating a Box Plot (145)44.Tabl eau ─ Tree Map (147)Creating a Tree Map (147)45.Tableau ─ Bump Chart (149)Creating a Bump Chart (149)46.Ta bleau ─ Gantt Chart (153)Creating a Gantt Chart (153)47.Tableau ─ Histogram (157)Creating a Histogram (157)48.Tableau ─ Motion Charts (159)Creating a Motion Chart (159)49.Tableau - Waterfall Charts (162)Creating a Waterfall Chart (162)TABLEAU – ADVANCED (167)50.Tableau ─ Dashboard (168)Creating a Dashboard (168)51.Tableau ─ Formatting (174)Formatting the Axes (175)Change the Font (176)Change the Shade and Alignment (177)Format Borders (178)Creating a Forecast (179)53.Tableau ─ Trend Lines (183)Creating a Trend Line (183)Tableau ─ BasicsAs a leading data visualization tool, Tableau has many desirable and unique features. Its powerful data discovery and exploration application allows you to answer important questions in seconds. You can use Tableau's drag and drop interface to visualize any data, explore different views, and even combine multiple databases easily. It does not require any complex scripting. Anyone who understands the business problems can address it with a visualization of the relevant data. After analysis, sharing with others is as easy as publishing to Tableau Server.T ableau FeaturesTableau provides solutions for all kinds of industries, departments, and data environments. Following are some unique features which enable Tableau to handle diverse scenarios.∙Speed of Analysis: As it does not require high level of programming expertise, any user with access to data can start using it to derive value from the data.∙Self-Reliant: Tableau does not need a complex software setup. The desktop version which is used by most users is easily installed and contains all the features needed to start and complete data analysis.∙Visual Discovery: The user explores and analyzes the data by using visual tools like colors, trend lines, charts, and graphs. There is very little script to be written as nearly everything is done by drag and drop.∙Blend Diverse Data Sets: Tableau allows you to blend different relational, semi-structured and raw data sources in real time, without expensive up-front integration costs. The users don’t need to know the details of how data is stored.∙Architecture Agnostic: Tableau works in all kinds of devices where data flows.Hence, the user need not worry about specific hardware or software requirements to use Tableau.∙Real-Time Collaboration: Tableau can filter, sort, and discuss data on the fly and embed a live dashboard in portals like SharePoint site or Salesforce. You can save your view of data and allow colleagues to subscribe to your interactive dashboards so they see the very latest data just by refreshing their web browser.∙Centralized Data: Tableau server provides a centralized location to manage all of the organization’s published data sources. You can delete, change permissions, add tags, and manage sched ules in one convenient location. It’s easy to schedule extract refreshes and manage them in the data server. Administrators can centrally define a schedule for extracts on the server for both incremental and full refreshes.In this chapter, you will learn about the environment setup of Tableau.Download Tableau DesktopThe Free Personal Edition of Tableau Desktop can be downloaded from Tableau Desktop. You need to register with your details to be able to download.After downloading, the installation is a very straightforward process in which you need to accept the license agreement and provide the target folder for installation. The following steps and screenshots describe the entire setup process.Start the Installation WizardDouble-click the TableauDesktop-64bit-9-2-2.exe. It will present a screen to allow the installation program to run. Click “Run”.Accept the License AgreementRead the license agreement and if you agree, choose the "I have read and accept the terms of this license agreement" option. Then, click "Install".Start TrialOn completion of the installation, the screen prompts you with the option to Start the trial now or later. You may choose to start it now. Also, if you have purchased Tableau then you may enter the License key.Provide Your DetailsProvide your name and organization details. Then, click "Next".Registration CompleteThe registration completion screen appears. Click "Continue".Verify the InstallationYou can verify the installation by going to the Windows start menu. Click the Tableau icon. The following screen appears.You are now ready to learn Tableau.TableauIn this chapter, you will learn some basic operations in Tableau to get acquainted with its interface. There are three basic steps involved in creating any Tableau data analysis report. These three steps are:∙ Connect to a data source : It involves locating the data and using an appropriatetype of connection to read the data.∙ Choose dimensions and measures : This involves selecting the required columns from the source data for analysis.∙Apply visualization technique : This involves applying required visualization methods, such as a specific chart or graph type to the data being analyzed. For convenience, let’s use the sample data set that comes with Tableau installation named sample – superstore.xls. Locate the installation folder of Tableau and go to My Tableau Repository . Under it, you will find the above file at Datasources\9.2\en_US-US . Connect to a Data SourceOn opening Tableau, you will get the start page showing various data sources. Under the header “Connect ”, you have options to choose a file or server or saved data source. Under Files, choose excel. Then navigate to the file “Sample – Superstore.xls ” as mentioned above. The excel file has three sheets named Orders, People and Returns. Choose Orders .Choose the Dimensions and MeasuresNext, choose the data to be analyzed by deciding on the dimensions and measures. Dimensions are the descriptive data while measures are numeric data. When put together, they help visualize the performance of the dimensional data with respect to the data which 3.are measures. Choose Category and Region as the dimensions and Sales as the measure. Drag and drop them as shown in the following screenshot. The result shows the total sales in each category for each region.Apply Visualization TechniqueIn the previous step, you can see that the data is available only as numbers. You have to read and calculate each of the values to judge the performance. However, you can see them as graphs or charts with different colors to make a quicker judgment.We drag and drop the sum (sales) column from the Marks tab to the Columns shelf. The table showing the numeric values of sales now turns into a bar chart automatically.You can apply a technique of adding another dimension to the existing data. This will add more colors to the existing bar chart as shown in the following screenshot.End of ebook previewIf you liked what you saw…Buy it from our store @ https://。
用Tableau进行数据可视化入门指南

用Tableau进行数据可视化入门指南数据可视化是数据分析中非常重要的一环,它能够通过图表、图形等方式将复杂的数据信息转化为直观、易于理解的形式,帮助我们更好地理解数据、发现规律和趋势,以及支持决策制定。
在数据可视化领域,Tableau是一款功能强大、易于上手的工具。
本文将为大家介绍如何利用Tableau进行数据可视化的入门指南。
一、Tableau的基础知识1.1 Tableau的介绍Tableau是一款由Tableau软件公司开发的可视化分析工具,它能够把数据快速转化为直观易懂的图表和图形。
Tableau的特点在于其直观的可视化界面和强大的数据分析功能,能够满足不同数据可视化需求的用户。
1.2 Tableau的安装与配置首先,我们需要下载并安装Tableau软件。
在安装完成后,需要进行一些简单的配置工作,例如设置数据源、调整工作表大小和布局等。
当然,在使用Tableau之前,最好熟悉一下基本的操作界面和常用工具栏。
二、数据准备与导入2.1 数据准备与整理在进行数据可视化之前,需要准备好相应的数据集。
这些数据可以来自于Excel表格、数据库、网站等。
在导入数据之前,需要对数据进行整理和清洗,以确保数据的准确性和完整性。
2.2 数据导入Tableau支持多种数据源的导入,例如CSV文件、Excel文件、数据库等。
可以通过选择数据源文件,或者直接从剪贴板复制数据,快速导入数据到Tableau。
三、创建可视化图表3.1 基本图表Tableau提供了多种常见的图表类型,如柱状图、折线图、散点图等。
可以根据数据的特点选择合适的图表类型,并通过拖拽字段到相应的区域来创建图表。
除此之外,还可以对图表进行格式化、添加标签和注释等。
3.2 高级图表除了基本图表外,Tableau还提供了一些高级的图表类型和功能,如地图、热力图、Treemap等。
这些图表类型可以更直观地展示数据的空间分布、相对大小以及关联关系等,进一步深入分析数据。
- 1、下载文档前请自行甄别文档内容的完整性,平台不提供额外的编辑、内容补充、找答案等附加服务。
- 2、"仅部分预览"的文档,不可在线预览部分如存在完整性等问题,可反馈申请退款(可完整预览的文档不适用该条件!)。
- 3、如文档侵犯您的权益,请联系客服反馈,我们会尽快为您处理(人工客服工作时间:9:00-18:30)。
一、登录
打开浏览器输入网址,然后进入到如下界面
在用户名栏输入oa名,密码为123
登录完成后会进入到如下界面
二、操作
应用之间的切换
鼠标左键单击页面左上角的退出按钮或者tableau图标,如下
,然后点击进入下一个应用
1.drilldown_dashboard_xx应用(xx代表2000w,10000w)
步骤1:任意选择日期区间,日期跨度保持1月以上
滑动红色方框中的游标
步骤2:从三级部门下钻
鼠标左键单击红色方框中的“+”号步骤3:从四级部门下钻
鼠标左键单击红色方框中的“+”号
步骤4:上卷到二级部门
鼠标左键单击红色方框中的“-”号
2.filter_dashboard_xx应用(xx代表2000w,10000w)
步骤1:从三级部门下拉菜单中任选一个三级部门
鼠标左键单击红色方框内任意位置弹出如下下拉选项
鼠标左键单击事业部中任意一个;
步骤2:然后在四级部门下拉菜单中任选一个四级部门;
步骤3:在五级部门下拉菜单中任选一个五级部门。
步骤4:点击下图中红色方框中的按钮
,该按钮居于页面中间偏上位置
3.map_dashboard_xx应用(xx代表2000w,10000w)
步骤1:任意选择日期区间,日期跨度保持1月以上
滑动红色方框中的游标
步骤2:在地图上鼠标左键单击代表自己所在城市的点,以上海为例点击如下图所示点即可。