雨流计数法matlab程度源代码
基于MATLAB的潮流计算源程序代码(优.选)
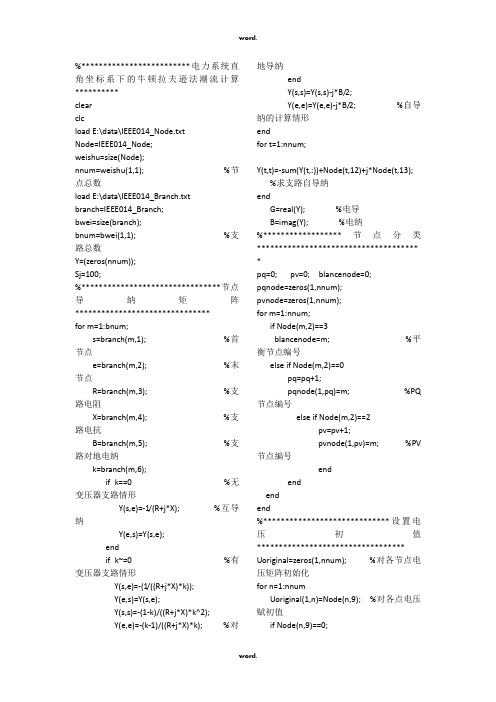
%*************************电力系统直角坐标系下的牛顿拉夫逊法潮流计算**********clearclcload E:\data\IEEE014_Node.txtNode=IEEE014_Node;weishu=size(Node);nnum=weishu(1,1); %节点总数load E:\data\IEEE014_Branch.txtbranch=IEEE014_Branch;bwei=size(branch);bnum=bwei(1,1); %支路总数Y=(zeros(nnum));Sj=100;%********************************节点导纳矩阵*******************************for m=1:bnum;s=branch(m,1); %首节点e=branch(m,2); %末节点R=branch(m,3); %支路电阻X=branch(m,4); %支路电抗B=branch(m,5); %支路对地电纳k=branch(m,6);if k==0 %无变压器支路情形Y(s,e)=-1/(R+j*X); %互导纳Y(e,s)=Y(s,e);endif k~=0 %有变压器支路情形Y(s,e)=-(1/((R+j*X)*k));Y(e,s)=Y(s,e);Y(s,s)=-(1-k)/((R+j*X)*k^2);Y(e,e)=-(k-1)/((R+j*X)*k); %对地导纳endY(s,s)=Y(s,s)-j*B/2;Y(e,e)=Y(e,e)-j*B/2; %自导纳的计算情形endfor t=1:nnum;Y(t,t)=-sum(Y(t,:))+Node(t,12)+j*Node(t,13);%求支路自导纳endG=real(Y); %电导B=imag(Y); %电纳%******************节点分类************************************* *pq=0; pv=0; blancenode=0;pqnode=zeros(1,nnum);pvnode=zeros(1,nnum);for m=1:nnum;if Node(m,2)==3blancenode=m; %平衡节点编号else if Node(m,2)==0pq=pq+1;pqnode(1,pq)=m; %PQ 节点编号else if Node(m,2)==2pv=pv+1;pvnode(1,pv)=m; %PV 节点编号endendendend%*****************************设置电压初值********************************** Uoriginal=zeros(1,nnum); %对各节点电压矩阵初始化for n=1:nnumUoriginal(1,n)=Node(n,9); %对各点电压赋初值if Node(n,9)==0;Uoriginal(1,n)=1; %该节点为非PV节点时,将电压值赋为1endendPresion=input('请输入误差精度要求:Presion=');disp('该电力系统节点数:');disp(nnum);xiumax=0.1;counter=0;while xiumax>Presion%****************************计算不平衡量***********************************e=real(Uoriginal); %取初始电压的实部f=imag(Uoriginal); %取初始电压的虚部deta=zeros(2*pq+2*pv,1); %构造储存功率变化量的列矩阵n=1;for m=1:pq;Pi=0;Qi=0;for t=1:nnum;Pi=Pi+e(1,pqnode(1,m))*(G(pqnode(1,m),t)*e (1,t)-B(pqnode(1,m),t)*f(1,t))+f(1,pqnode(1,m ))*(G(pqnode(1,m),t)*f(1,t)+B(pqnode(1,m),t) *e(1,t));%计算该PQ节点的负荷有功Qi=Qi+f(1,pqnode(1,m))*(G(pqnode(1,m),t)*e (1,t)-B(pqnode(1,m),t)*f(1,t))-e(1,pqnode(1,m ))*(G(pqnode(1,m),t)*f(1,t)+B(pqnode(1,m),t) *e(1,t));%计算该PQ节点的负荷无功endS1(1,pqnode(1,m))=Pi+j*Qi;P=(Node(pqnode(1,m),7)-Node(pqnode(1,m), 5))/Sj-Pi;%计算该PQ节点的实际有功功率deta(n,1)=P;%在该列向量中储存有功功率n=n+1;Q=(Node(pqnode(1,m),8)-Node(pqnode(1,m),6))/Sj-Qi;%计算该PQ节点的实际无功功率deta(n,1)=Q;%在该列向量中储存无功功率n=n+1;endfor m=1:pv;Pv=0; Qv=0;for t=1:nnum;Pv=Pv+e(1,pvnode(1,m))*(G(pvnode(1,m),t)* e(1,t)-B(pvnode(1,m),t)*f(1,t))+f(1,pvnode(1, m))*(G(pvnode(1,m),t)*f(1,t)+B(pvnode(1,m), t)*e(1,t));%计算该PV节点的负荷有功Ui=e(1,pvnode(1,m))^2+f(1,pvnode(1,m))^2; %计算该节点的负荷电压值Qv=Qv+f(1,pqnode(1,m))*(G(pqnode(1,m),t)* e(1,t)-B(pqnode(1,m),t)*f(1,t))-e(1,pqnode(1, m))*(G(pqnode(1,m),t)*f(1,t)+B(pqnode(1,m), t)*e(1,t));endS1(1,pvnode(1,m))=Pv+j*Qv;P=(Node(pvnode(1,m),7)-Node(pvnode(1,m), 5))/Sj-Pv; %计算该节点的实际有功功率deta(n,1)=P; %储存该有功功率n=n+1;U=Node(pvnode(1,m),3)^2-Ui; %计算电压变化量deta(n,1)=U; %储存该电压变化量n=n+1;enddeta;cerate=zeros(pq+pv,1);for k=1:pqcerate(k,1)=pqnode(1,k);endfor v=1:pvcerate(pq+v,1)=pvnode(1,v);end%******************************雅克比矩阵****************************** Jacob=ones(2*nnum-2);L=0;J=0;H=0;N=0; R=0;S=0;n=1;k=1;form=1:pq; %m表示雅克比矩阵中pq节点的行数for u=1:pq+pv; %u 表示雅克比矩阵中pq节点的列数t=cerate(u,1); %t为中间变量,用来标记雅克比矩阵中指定元素的个数if pqnode(1,m)~=t %非对角元素的情况H=G(pqnode(1,m),t)*f(1,pqnode(1,m))-B(pqn ode(1,m),t)*e(1,pqnode(1,m));N=G(pqnode(1,m),t)*e(1,pqnode(1,m))+B(pq node(1,m),t)*f(1,pqnode(1,m));L=H;J=-N;elseifpqnode(1,m)==t %对角线元素时的情况I=0;for g=1:nnumI=Y(t,g)*Uoriginal(1,g)+I; %计算节点的注入电流endaii=real(I);bii=imag(I);H=-B(t,t)*e(1,pqnode(1,m))+G(t,t)*f(1,pqnode (1,m))+bii;N=G(t,t)*e(1,pqnode(1,m))+B(t,t)*f(1,pqnode (1,m))+aii;L=-B(t,t)*e(1,pqnode(1,m))+G(t,t)*f(1,pqnode (1,m))-bii; J=-G(t,t)*e(1,pqnode(1,m))-B(t,t)*f(1,pqnode( 1,m))+aii;endendJacob(n,k)=H;k=k+1;Jacob(n,k)=N;k=k-1;n=n+1;Jacob(n,k)=J;k=k+1;Jacob(n,k)=L;n=n-1; k=k+1; %按照雅克比矩阵的排列规则排列pq节点的雅克比元素endk=1; n=2*m+1; %将光标定位于下一个待排列PQ节点元素的第一个位置endn=2*pq+1; k=1; %定位于PV节点的第一个位置处for m=1:pv;for u=1:pq+pv;t=cerate(u,1); %t为中间变量,用来标记雅克比矩阵中指定元素的位置if pvnode(1,m)~=t %非对角线元素情况H=G(pvnode(1,m),t)*f(1,pvnode(1,m))-B(pvno de(1,m),t)*e(1,pvnode(1,m));N=G(pvnode(1,m),t)*e(1,pvnode(1,m))+B(pvn ode(1,m),t)*f(1,pvnode(1,m));R=0; S=0;endifpvnode(1,m)==t %对角线元素情况I=0;for g=1:nnumI=Y(t,g)*Uoriginal(1,g)+I; %计算PV节点的注入电流endaii=real(I);bii=imag(I);H=-B(t,t)*e(1,pvnode(1,m))+G(t,t)*f(1,pvnode (1,m))+bii;N=G(t,t)*e(1,pvnode(1,m))+B(t,t)*f(1,pvnode( 1,m))+aii;R=2*f(1,pvnode(1,m));S=2*e(1,pvnode(1,m));endJacob(n,k)=H; k=k+1;Jacob(n,k)=N; k=k-1;n=n+1;Jacob(n,k)=R; k=k+1;Jacob(n,k)=S;n=n-1;k=k+1; %按照雅克比矩阵的排列规则排列PV节点的雅克比元素endk=1;n=n+2; %定位于下一个待排列PV节点的雅克比元素第一个位置end%*************************电压变化量化的计算与存储************************************ Detau=inv(Jacob)*deta; %构建电压的变化量的列向量f=zeros(1,nnum); %给电压实部赋初值0e=zeros(1,nnum); %给电压虚部赋初值0for p=1:(pq+pv);f(1,cerate(p,1))=j*Detau(2*p-1,1);%将电压变量的奇数行赋值给fe(1,cerate(p,1))=Detau(2*p,1); %将电压变量的偶数行赋值给eendt=e+f;xiumax=abs(Detau(1,1)); %将电压变化量的第一个元素赋值给最大允许误差for n=2:2*nnum-2;if abs(Detau(n,1))>xiumaxxiumax=abs(Detau(n,1)); %找出最大的电压误差endendUoriginal=Uoriginal+t; %迭代修正后的电压值counter=1+counter; %统计迭代次数enddisp('迭代次数counter:');disp(counter);%**************************平衡节点功率及显示**********************************m=blancenode;t=0;for n=1:nnum;t=t+(G(m,n)-j*B(m,n))*(real(Uoriginal(1,n))-j*i mag(Uoriginal(1,n)));endS1(1,m)=Uoriginal(1,m)*t;%**************************直角坐标下各节点电压及显示****************************U=zeros(1,nnum);for n=1:nnumUi(n,1)=Node(n,1);U(1,n)=real(Uoriginal(1,n))+i*imag(Uoriginal(1 ,n)); %将电压值由极坐标转化为直角坐标形式Ui(n,2)=U(1,n);Ui(n,3)=S1(1,n);enddisp('各节点电压直角坐标形式及节点注入功率:');disp(' 节点号节点电压值节点注入功率');disp(Ui);disp('修正电压的最大误差:')disp(xiumax);%**************************功率损耗************************************* **for m=1:bnum %支路功率及损耗startnode=branch(m,1);endnode=branch(m,2); %终止节点y=sum(Y,2);Sij=Uoriginal(1,startnode)*((conj(Uoriginal(1,s tartnode))*conj(y(startnode,1)))+(conj(Uorigi nal(1,startnode))-conj(Uoriginal(1,endnode))) *conj(-Y(startnode,endnode)));Sji=Uoriginal(1,endnode)*((conj(Uoriginal(1,e ndnode))*conj(y(endnode,1)))+(conj(Uoriginal (1,endnode))-conj(Uoriginal(1,startnode)))*co nj(-Y(endnode,startnode)));S(m,1)=startnode; %始节点S(m,2)=endnode; %末节点S(m,3)=Sij; %始节点流入的功率S(m,4)=Sji; %末节点流入的功率S(m,5)=Sij+Sji; %线路损耗enddisp('支路功率及损耗:');disp('节点号(I) 节点号(J) 支路功率(I-J)支路功率(J-I)线路损耗(delta_S)')disp(S); 最新文件---------------- 仅供参考--------------------已改成word文本--------------------- 方便更改。
matlab流体仿真代码
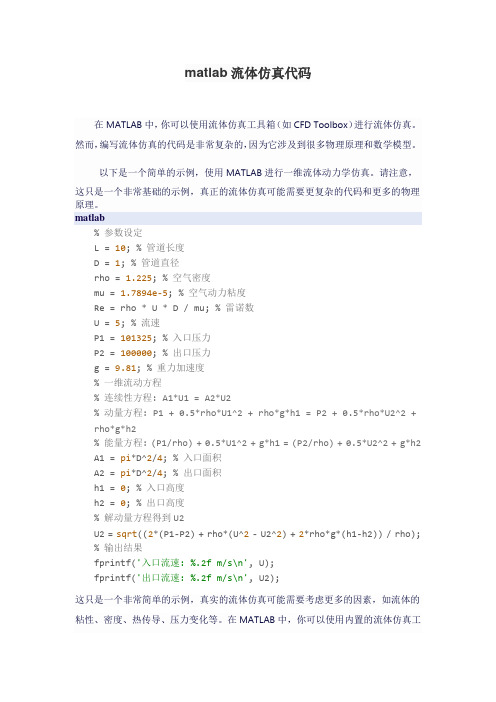
matlab流体仿真代码在MATLAB中,你可以使用流体仿真工具箱(如CFD Toolbox)进行流体仿真。
然而,编写流体仿真的代码是非常复杂的,因为它涉及到很多物理原理和数学模型。
以下是一个简单的示例,使用MATLAB进行一维流体动力学仿真。
请注意,这只是一个非常基础的示例,真正的流体仿真可能需要更复杂的代码和更多的物理原理。
matlab% 参数设定L = 10; % 管道长度D = 1; % 管道直径rho = 1.225; % 空气密度mu = 1.7894e-5; % 空气动力粘度Re = rho * U * D / mu; % 雷诺数U = 5; % 流速P1 = 101325; % 入口压力P2 = 100000; % 出口压力g = 9.81; % 重力加速度% 一维流动方程% 连续性方程: A1*U1 = A2*U2% 动量方程: P1 + 0.5*rho*U1^2 + rho*g*h1 = P2 + 0.5*rho*U2^2 + rho*g*h2% 能量方程: (P1/rho) + 0.5*U1^2 + g*h1 = (P2/rho) + 0.5*U2^2 + g*h2 A1 = pi*D^2/4; % 入口面积A2 = pi*D^2/4; % 出口面积h1 = 0; % 入口高度h2 = 0; % 出口高度% 解动量方程得到U2U2 = sqrt((2*(P1-P2) + rho*(U^2- U2^2) + 2*rho*g*(h1-h2)) / rho);% 输出结果fprintf('入口流速: %.2f m/s\n', U);fprintf('出口流速: %.2f m/s\n', U2);这只是一个非常简单的示例,真实的流体仿真可能需要考虑更多的因素,如流体的粘性、密度、热传导、压力变化等。
在MATLAB中,你可以使用内置的流体仿真工具箱,如CFD Toolbox,或者第三方工具箱,如ANSYS Fluent的MATLAB接口,来进行更复杂的流体仿真。
matlab雨流计数法简单讲解

在工程中,特别是机械结构、航空航天等领域,在对应力、载荷进行疲劳分析时,雨流计数法是一种常用的方法。
这种方法可以有效地对载荷数据进行处理,得到疲劳载荷的循环次数,从而进行疲劳寿命的预测。
1. 什么是雨流计数法?雨流计数法是一种用来对载荷数据进行疲劳分析的方法。
它可以将连续的载荷数据序列转换为一系列载荷循环,然后对这些循环进行统计分析。
通过这种方法,我们可以得到载荷循环的幅值和次数,从而可以进一步进行疲劳寿命的预测和分析。
2. 雨流计数法的基本原理雨流计数法的基本原理是将载荷数据序列分解成一系列循环载荷,然后对这些循环进行统计。
在实际应用中,通常使用峰谷识别法来检测载荷数据中的峰值和谷值,然后根据这些峰值和谷值来进行载荷循环的划分。
可以根据载荷循环的幅值和次数进行统计分析,得到疲劳载荷的循环次数。
3. 雨流计数法的优点和局限性雨流计数法的优点在于可以较为准确地对载荷数据进行处理,得到疲劳载荷的循环次数,从而进行疲劳寿命的预测。
但是,这种方法也存在一定的局限性,例如在处理复杂载荷时,可能会出现较大的误差,需要进行一定的修正和优化。
4. 我对雨流计数法的个人观点和理解在我看来,雨流计数法是一种简单而有效的方法,在工程实践中具有广泛的应用前景。
通过对载荷数据进行分解和统计,我们可以更好地理解载荷对结构疲劳寿命的影响,从而有针对性地进行疲劳设计和分析。
但是,在实际应用中,我们也需要注意方法的局限性,结合具体情况进行合理的选择和修正。
总结回顾:通过本文的讲解,我们了解了雨流计数法的基本原理和应用。
这种方法可以帮助我们对载荷数据进行处理,得到疲劳载荷的循环次数,从而进行疲劳寿命的预测和分析。
在工程实践中,雨流计数法具有重要的意义,但同时也需要注意其局限性,进行合理的修正和优化。
希望通过本文的讲解,读者对雨流计数法有了更深入的了解。
在此,我为您撰写了一篇有关“matlab雨流计数法简单讲解”的文章,希望能够对您有所帮助。
流体力学简单计算MATLAB程式

用matlab进行编程计算第一问:z=30;p1=50*9.8*10^4;p2=2*9.8*10^4;jdc=0.00015;gama=9800;d=0.257;L=50000 ;mu=6*10^(-6);hf=z+(p1-p2)/(0.86*gama)xdc=2*jdc/d;beta=4.15;m=1;Q=(hf*d^(5-m)/(beta*mu^m*L))^(1/(2-m));v=4*Q/(pi*d^2);Re=v*d/mu;Re1=59.7/xdc^(8*xdc/7);Re2=(665-765*log(xdc))/xdc;i=hf/L;if Re<3000Q=Q;elseif 3000<Re<Re1m=0.25;beta=0.0246;Q=(hf*d^(5-m)/(beta*mu^m*L))^(1/(2-m));v=4*Q/(pi*d^2);Re=v*d/mu;elseif Re1<Re<Re2m=0.123;A=10^(0.127*log(jdc/d)-0.627);beta=0.0802*A;Q=(hf*d^(5-m)/(beta*mu^m*L))^(1/(2-m));v=4*Q/(pi*d^2);Re=v*d/mu;elsem=0;langda=1/(2*log(3.7*d/jdc))^2;beta=0.0816*langda;Q=(hf*d^(5-m)/(beta*mu^m*L))^(1/(2-m));v=4*Q/(pi*d^2);Re=v*d/mu;endiQRevhf =588.1395i =0.0118Q =0.0915Re =7.5526e+004v =1.7632利用IF 语句对四种流态一一进行试算,最终的结果水力损失为588.1395m ,水力坡降0.0118第二问:将其中10km换成直径305mm的管子z=30;p1=50*9.8*10^4;p2=2*9.8*10^4;jdc=0.00015;gama=9800;mu=6*10^(-6);d= [0.257 0.305];L=[40000 10000];x=zeros(4,1);Q1=0.0915;hf=z+(p1-p2)/(0.86*gama);xdc=2*jdc./d;beta=4.15;m=1;Q=(hf/(beta*mu^m*(L(1)/d(1)^(5-m)+L(2)/d(2)^(5-m))))^(1/(2-m));v(1)=4*Q/(pi*d(1)^2);v(2)=4*Q/(pi*d(2)^2);Re(1)=v(1)*d(1)/mu;Re(2)=v(2)*d(2)/mu;Re1(1)=59.7/xdc(1)^(8/7);Re1(2)=59.7/xdc(2)^(8/7);Re2(1)=(665-765*log(xdc(1)))/xdc(1);Re2(2)=(665-765*log(xdc(2)))/xdc(2);if Re(1)<3000 & Re(2)<3000Q=Q;elseif 3000<Re(1)<Re1 & 3000<Re(2)<Re1m=0.25;beta=0.0246;Q=(hf/(beta*mu^m*(L(1)/d(1)^(5-m)+L(2)/d(2)^(5-m))))^(1/(2-m));v(1)=4*Q/(pi*d(1)^2);v(2)=4*Q/(pi*d(2)^2);Re(1)=v(1)*d(1)/mu;Re(2)=v(2) *d(2)/mu;elseif Re1<Re(1)<Re2 & Re1<Re(2)<Re2m=0.123;A=10^(0.127*log(jdc/d)-0.627);beta=0.0802*A;Q=(hf/(beta*mu^m*(L(1)/d(1)^(5-m)+L(2)/d(2)^(5-m))))^(1/(2-m));v(1)=4*Q/(pi*d(1)^2);v(2)=4*Q/(pi*d(2)^2);Re(1)=v(1)*d(1)/mu;Re(2)=v(2)*d(2)/mu;elsem=0;langda=1/(2*log(3.7*d/jdc))^2;beta=0.0816*langda;Q=(hf/(beta*mu^m*(L(1)/d(1)^(5-m)+L(2)/d(2)^(5-m))))^(1/(2-m));v(1)=4*Q/(pi*d(1)^2);v(2)=4*Q/(pi*d(2)^2);Re(1)=v(1)*d(1)/mu;Re(2)=v(2)*d(2)/mu;endQ Revq=Q-Q1baifenbi=q/Q1Q =0.0978Re =1.0e+004 *8.0795 6.8080v =1.8863 1.3393q =0.0063baifenbi =0.0694先假设流态均为层流,再进行试算,最终可得输量可提高6.94个百分点。
完整word版,matlab代码大全,推荐文档
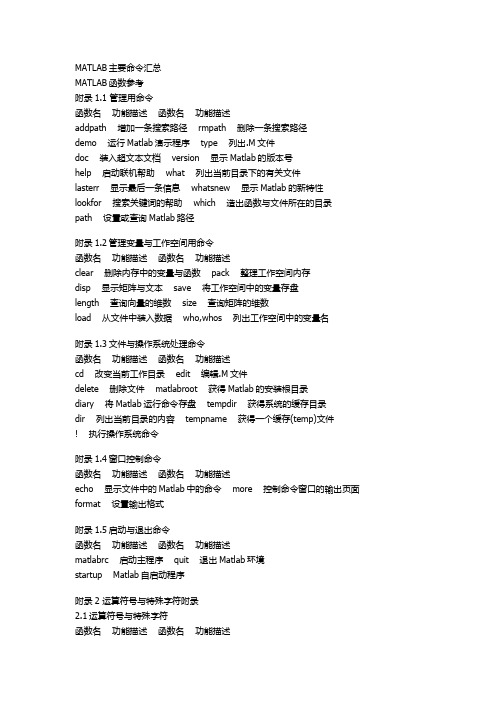
MATLAB主要命令汇总MATLAB函数参考附录1.1 管理用命令函数名功能描述函数名功能描述addpath 增加一条搜索路径 rmpath 删除一条搜索路径demo 运行Matlab演示程序 type 列出.M文件doc 装入超文本文档 version 显示Matlab的版本号help 启动联机帮助 what 列出当前目录下的有关文件lasterr 显示最后一条信息 whatsnew 显示Matlab的新特性lookfor 搜索关键词的帮助 which 造出函数与文件所在的目录path 设置或查询Matlab路径附录1.2管理变量与工作空间用命令函数名功能描述函数名功能描述clear 删除内存中的变量与函数 pack 整理工作空间内存disp 显示矩阵与文本 save 将工作空间中的变量存盘length 查询向量的维数 size 查询矩阵的维数load 从文件中装入数据 who,whos 列出工作空间中的变量名附录1.3文件与操作系统处理命令函数名功能描述函数名功能描述cd 改变当前工作目录 edit 编辑.M文件delete 删除文件 matlabroot 获得Matlab的安装根目录diary 将Matlab运行命令存盘 tempdir 获得系统的缓存目录dir 列出当前目录的内容 tempname 获得一个缓存(temp)文件! 执行操作系统命令附录1.4窗口控制命令函数名功能描述函数名功能描述echo 显示文件中的Matlab中的命令 more 控制命令窗口的输出页面format 设置输出格式附录1.5启动与退出命令函数名功能描述函数名功能描述matlabrc 启动主程序 quit 退出Matlab环境startup Matlab自启动程序附录2 运算符号与特殊字符附录2.1运算符号与特殊字符函数名功能描述函数名功能描述+ 加 ... 续行标志- 减 , 分行符(该行结果不显示)* 矩阵乘 ; 分行符(该行结果显示).* 向量乘 % 注释标志^ 矩阵乘方 ! 操作系统命令提示符.^ 向量乘方矩阵转置kron 矩阵kron积 . 向量转置\ 矩阵左除 = 赋值运算/ 矩阵右除 == 关系运算之相等.\ 向量左除 ~= 关系运算之不等./ 向量右除 < 关系运算之小于: 向量生成或子阵提取 <= 关系运算之小于等于() 下标运算或参数定义 > 关系运算之大于[] 矩阵生成 >= 关系运算之大于等于{} & 逻辑运算之与. 结构字段获取符 | 逻辑运算之或. 点乘运算,常与其他运算符联合使用(如.\) ~ 逻辑运算之非xor 逻辑运算之异成附录2.2逻辑函数函数名功能描述函数名功能描述all 测试向量中所用元素是否为真 is*(一类函数) 检测向量状态.其中*表示一个确定的函数(isinf)any 测试向量中是否有真元素 *isa 检测对象是否为某一个类的对象exist 检验变量或文件是否定义 logical 将数字量转化为逻辑量find 查找非零元素的下标附录3 语言结构与调试附录3.1编程语言函数名功能描述函数名功能描述builtin 执行Matlab内建的函数 global 定义全局变量eval 执行Matlab语句构成的字符串 nargchk 函数输入输出参数个数检验feval 执行字符串指定的文件 script Matlab语句及文件信息function Matlab函数定义关键词附录3.2控制流程函数名功能描述函数名功能描述break 中断循环执行的语句 if 条件转移语句case 与switch结合实现多路转移 otherwise 多路转移中的缺省执行部分else 与if一起使用的转移语句 return 返回调用函数elseif 与if一起使用的转移语句 switch 与case结合实现多路转移end 结束控制语句块 warning 显示警告信息error 显示错误信息 while 循环语句for 循环语句附录3.3交互输入函数名功能描述函数名功能描述input 请求输入 menu 菜单生成keyboard 启动键盘管理 pause 暂停执行附录3.4面向对象编程函数名功能描述函数名功能描述class 生成对象 isa 判断对象是否属于某一类double 转换成双精度型 superiorto 建立类的层次关系inferiorto 建立类的层次关系 unit8 转换成8字节的无符号整数inline 建立一个内嵌对象附录3.5调试函数名功能描述函数名功能描述dbclear 清除调试断点 dbstatus 列出所有断点情况dbcont 调试继续执行 dbstep 单步执行dbdown 改变局部工作空间内存 dbstop 设置调试断点dbmex 启动对Mex文件的调试 sbtype 列出带命令行标号的.M文件dbquit 退出调试模式 dbup 改变局部工作空间内容dbstack 列出函数调用关系附录4 基本矩阵与矩阵处理附录4.1基本矩阵函数名功能描述函数名功能描述eye 产生单位阵 rand 产生随机分布矩阵linspace 构造线性分布的向量 randn 产生正态分布矩阵logspace 构造等对数分布的向量 zeros 产生零矩阵ones 产生元素全部为1的矩阵 : 产生向量附录4.2特殊向量与常量函数名功能描述函数名功能描述ans 缺省的计算结果变量 non 非数值常量常由0/0或Inf/Inf获得computer 运行Matlab的机器类型 nargin 函数中参数输入个数eps 精度容许误差(无穷小) nargout 函数中输出变量个数flops 浮点运算计数 pi 圆周率i 复数单元 realmax 最大浮点数值inf 无穷大 realmin 最小浮点数值inputname 输入参数名 varargin 函数中输入的可选参数j 复数单元 varargout 函数中输出的可选参数附录4.3时间与日期函数名功能描述函数名功能描述calender 日历 eomday 计算月末clock 时钟 etime 所用时间函数cputime 所用的CPU时间 now 当前日期与时间date 日期 tic 启动秒表计时器datenum 日期(数字串格式) toc 读取秒表计时器datestr 日期(字符串格式) weekday 星期函数datevoc 日期(年月日分立格式)附录4.4矩阵处理函数名功能描述函数名功能描述cat 向量连接 reshape 改变矩阵行列个数diag 建立对角矩阵或获取对角向量 rot90 将矩阵旋转90度fliplr 按左右方向翻转矩阵元素 tril 取矩阵的下三角部分flipud 按上下方向翻转矩阵元素 triu 取矩阵的上三角部分repmat 复制并排列矩阵函数附录5 特殊矩阵函数名功能描述函数名功能描述compan 生成伴随矩阵 invhilb 生成逆hilbert矩阵gallery 生成一些小的测试矩阵 magic 生成magic矩阵hadamard 生成hadamard矩阵 pascal 生成pascal矩阵hankel 生成hankel矩阵 toeplitz 生成toeplitz矩阵hilb 生成hilbert矩阵 wilkinson 生成wilkinson特征值测试矩阵附录6 数学函数附录6.1三角函数函数名功能描述函数名功能描述sin/asin 正弦/反正弦函数 sec/asec 正割/反正割函数sinh/asinh 双曲正弦/反双曲正弦函数 sech/asech 双曲正割/反双曲正割函数cos/acos 余弦/反余弦函数 csc/acsc 余割/反余割函数cosh/acosh 双曲余弦/反双曲余弦函数 csch/acsch 双曲余割/反双曲余割函数tan/atan 正切/反正切函数 cot/acot 余切/反余切函数tanh/atanh 双曲正切/反双曲正切函数 coth/acoth 双曲余切/反双曲余切函数atan2 四个象限内反正切函数附录6.2指数函数函数名功能描述函数名功能描述exp 指数函数 log10 常用对数函数log 自然对数函数 sqrt 平方根函数附录6.3复数函数函数名功能描述函数名功能描述abs 绝对值函数 imag 求虚部函数angle 角相位函数 real 求实部函数conj 共轭复数函数附录6.4数值处理函数名功能描述函数名功能描述fix 沿零方向取整 round 舍入取整floor 沿-∞方向取整 rem 求除法的余数ceil 沿+∞方向取整 sign 符号函数附录6.5其他特殊数学函数函数名功能描述函数名功能描述airy airy函数 erfcx 比例互补误差函数besselh bessel函数(hankel函数) erfinv 逆误差函数bessili 改进的第一类bessel函数 expint 指数积分函数besselk 改进的第二类bessel函数 gamma gamma函数besselj 第一类bessel函数 gammainc 非完全gamma函数bessely 第二类bessel函数 gammaln gamma对数函数beta beta函数 gcd 最大公约数betainc 非完全的beta函数 lcm 最小公倍数betaln beta对数函数 log2 分割浮点数elipj Jacobi椭圆函数 legendre legendre伴随函数ellipke 完全椭圆积分 pow2 基2标量浮点数erf 误差函数 rat 有理逼近erfc 互补误差函数 rats 有理输出附录7 坐标转换函数名功能描述函数名功能描述cart2pol 笛卡儿坐标到极坐标转换 pol2cart 极坐标到笛卡儿坐标转换cart2sph 笛卡儿坐标到球面坐标转换 sph2cart 球面坐标到笛卡儿坐标转换附录8 矩阵函数附录8.1矩阵分析函数名功能描述函数名功能描述cond 求矩阵的条件数 rcond LINPACK倒数条件估计det 求矩阵的行列式 rref 矩阵的行阶梯型实现norm 求矩阵的范数 rrefmovie 消元法解方程演示null 右零空间 subspace 子空间orth 正交空间 trace 矩阵的迹rank 求矩阵的秩附录8.2线性方程函数名功能描述函数名功能描述/,\ 线性方程求解 nnls 非零最小二乘chol Cholesky分解 pinv 求伪逆矩阵inv 矩阵求逆 qr 矩阵的QR分解lscov 最小二乘方差 qrdelete QR分解中删除一行lu 矩阵的LU三角分解 qrinsert QR分解中插入一行附录8.3特征值与奇异值函数名功能描述函数名功能描述banlance 改进特征值精度的均衡变换 qz QZ算法求矩阵特征值cdf2rdf 复块对角阵到实块对角阵转换 rdf2cdf 实块对角阵到复块对角阵转换eig 求矩阵的特征值和特征向量 schur Schur分解hess 求Hessenberg矩阵 svd 奇异值分解poly 求矩阵的特征多项式附录8.4矩阵函数函数名功能描述函数名功能描述expm 矩阵指数函数 logm 矩阵对数函数funm 矩阵任意函数 sqrtm 矩阵平方根附录9 数据分析与Fourier变换函数附录9.1基本运算函数名功能描述函数名功能描述cumprod 向量累积 prod 对向量中各元素求积cumsum 向量累加 sort 对向量中各元素排序max 求向量中最大元素 sortrows 对矩阵中各行排序min 求向量中最小元素 std 求向量中各元素标准差mean 求向量中各元素均值 sum 对向量中各元素求和median 求向量中中间元素 trapz 梯形法求数值积分附录9.2微分计算函数名功能描述函数名功能描述del2 离散Laplace变换 gradient 梯度计算diff 差分于近视微分附录9.3滤波与卷积函数名功能描述函数名功能描述Conv 卷给与多项式乘法 filter 一维数字滤波conv2 二维卷积 filter2 二维数字滤波Deconv 因式分解与多项式乘法附录9.4方差处理函数名功能描述函数名功能描述corrcoef 相关系数计算 cov 协方差计算附录9.5Fourier变换函数名功能描述函数名功能描述abs 绝对值函数 fftshift fft与fft2输出重排angle 相角函数 ifft 离散Fourier逆变换cplxpair 依共轭复数对重新排序 ifft2 二维离散Fourier逆变换fft 离散Fourier变换 unwrap 相角矫正fft2 二维离散Fourier变换附录10 多项式处理函数附录10.1多项式处理函数名功能描述函数名功能描述conv 卷机与多项式乘法 polyfit 数据的多项式拟合deconv 因式分解与多项式乘法 polyval 多项式求值poly 求矩阵的特征多项式 polyvalm 多项式矩阵求值polyder 多项式求导 residue 部分分式展开polyeig 多项式特征值 roots 求多项式的根附录10.2数据插值函数名功能描述函数名功能描述griddata 数据网络的插值生成 interpft 一维插值(FFT方法)interp1 一维插值(查表) interpn 多维插值(查表)interp2 二维插值(查表) meshgrid 构造三维图形用x,y阵列interp3 三维插值(查表) spline 三次样条插值附录11 非线性数值方法函数名功能描述函数名功能描述dblquad 双重积分 odeget 获得微分方程求解的可选参数fmin 单变量最优化函数 odeset 设置微分方程求解的可选参数fmins 多变量最优化函数 quad 低阶数值积分方法ode45,ode23,ode113,ode15s,ode23s 微分方程数值解法 quad8 高阶数值积分方法odefile 对文件定义的微分方程求解附录12 稀疏矩阵函数附录12.1基本稀疏矩阵函数名功能描述函数名功能描述spdiags 稀疏对角矩阵 sprandn 稀疏正态分布随机矩阵speye 稀疏单位矩阵 sprandsym 稀疏对称随机矩阵sprand 稀疏均匀分布随机矩阵附录12.2稀疏矩阵转换函数名功能描述函数名功能描述find 查找非零元素下标 sparse 常规矩阵转换为稀疏矩阵full 稀疏矩阵转换为常规矩阵 spconvert 由外部格式引入稀疏矩阵附录12.3处理非零元素函数名功能描述函数名功能描述issparse 判断元素是否为稀疏矩阵 nzmax 允许的非零元素空间mmz 稀疏矩阵的非零元素个数 spalloc 为非零元素定位存储空间nonzeros 稀疏矩阵的非零元素 spfun 为非零元素定义处理函数附录12.4稀疏矩阵可视化函数名功能描述函数名功能描述gplot 绘制图论图形 spy 绘制稀疏矩阵结构附录12.5排序算法函数名功能描述函数名功能描述colmmd 列最小度排序 randperm 产生随机置换向量colperm 由非零元素的个数排序各列 symmd 对称最小度排序dmperm Dulmage-Mendelsohn分解 symrcm 反向Cuthill-McKee排序附录12.6范数、条件数函数名功能描述函数名功能描述condest 估算||*||1范数 normest 估算||*||2范数sprank 计算结构秩附录12.7特征值与奇异值函数名功能描述函数名功能描述eigs 求稀疏矩阵特征值和特征向量 svds 稀疏矩阵奇异值分解附录12.8其他函数名功能描述函数名功能描述spaugment 最小二乘算法形成 symbact 符号因子分解spparms 设置稀疏矩阵参数附录13 图形绘制附录13.1基本二维图形函数名功能描述函数名功能描述fill 填充二维多边形 polar 极坐标图形绘制loglog 全对数二维坐标绘制 semilogx x轴半对数坐标图形绘制plot 线性坐标图形绘制 semilogy y轴半对数坐标图形绘制附录13.2基本三维图形函数名功能描述函数名功能描述fill3 三维多边形填充 plot3 三维线或点型图绘制mesh 三维网格图形绘制 surf 三维表面图形绘制附录13.3三维颜色控制函数名功能描述函数名功能描述brighten 图形亮度调整 hidden 网格图的网格线开关设置caxis 坐标轴伪彩色设置 shading 设置渲染模式colormap 调色板设置附录13.4三维光照模型函数名功能描述函数名功能描述diffuse 图象漫射处理 surf1 带光照的三维表面绘制lighting 光照模式设置 surfnorm 曲面法线specular 设置镜面反射附录13.5标准调色板设置函数名功能描述函数名功能描述bone 带有蓝色调的灰色的调色板 hot 以黑红黄白为基色的调色板cool 以天蓝粉色为基色的调色板 hsv 色度饱和度亮度调色板copper 线性铜色调的调色板 pink 粉色色调的调色板flag 以红白蓝黑为基色的调色板 prism 光谱颜色表gray 线性灰度调色板附录13.6三维视点控制函数名功能描述函数名功能描述rotate3d 设置三维旋转开关 viewmtx 求视转换矩阵view 设置视点附录13.7坐标轴控制函数名功能描述函数名功能描述axis 坐标轴标度设置 hold 设置当前图形保护模式axes 坐标轴位置设置 subplot 将图形窗口分成几个区域box 坐标轴盒状显示 zoom 二维图形缩放grid 坐标网格线开关设置附录13.8图形注解函数名功能描述函数名功能描述colorbar 颜色条设置 xlabel 给图形的x轴加文字说明gtext 在鼠标位置加文字说明 ylabel 给图形的y轴加文字说明text 在图形上加文字说明 zlabel 给图形的z轴加文字说明title 给图形加标题附录13.9拷贝与打印函数名功能描述函数名功能描述print 打印图形或将图形存盘 orient 设置纸的方向orintopt 设置打印机为默认值附录14 特殊图形附录14.1特殊二维图形函数名功能描述函数名功能描述area 区域填充 feather 羽状条形图绘制bar 条形图绘制 fplot 给定函数绘制barh 水平条形图绘制 hist 直方图绘制bar3 3维条形图绘制 pareto pareto图绘制bar3h 3维水平条形图绘制 pie 饼状图绘制comet 彗星状轨迹绘制 stem 离散序列图形绘制errorbar 误差条形图绘制 stairs 梯形图绘制附录14.2等高线及其他二维图形函数名功能描述函数名功能描述contour 等高线绘制 pcolor 伪色绘制contourf 等高线填充绘制 quiver 有向图(箭头)绘制contour3 三维等高线绘制 voronoil voronoi图绘制clabel 等高线高程标志附录14.3特殊三维图形函数名功能描述函数名功能描述comet3 三维彗星状轨迹绘制 slice 切片图meshc 带等高线的三维网格绘制 surfc 带等高线的三维表面绘制meshz 带零平面的三维网格绘制 trisurf 表面图形的三角绘制stem2 杆图绘制 trimesh 网格图形的三角绘制quiver3 三维箭头(有向图)绘制 waterfall 瀑布型图形的绘制附录14.4图象显示与文件I/O函数名功能描述函数名功能描述brighten 图形色调亮化 image 图像显示colorbar 颜色条设置 imfinfo 图形文件信息colormap 调色板设置 imread 从文件读取图形contrast 灰度对比度设置 imwrite 保存图像附录14.5动画处理函数名功能描述函数名功能描述capture 屏幕抓取 movie 播放动画帧getframe 获取动画帧附录14.6实体模型函数名功能描述函数名功能描述cylinder 圆柱体生成 sphere 球体生成附录15 图形处理附录15.1图形窗口生成与控制函数名功能描述函数名功能描述clf 清除当前图形窗口 gcf 获取当前图形的窗口句柄close 关闭图形窗口 refresh 图形窗口刷新figure 生成图形窗口 shg 显示图形窗口附录15.2坐标轴建立与控制函数名功能描述函数名功能描述axes 坐标轴标度设置 gca 获得当前坐标轴句柄axis 坐标轴位置设置 hold 设置当前图形保护模式box 坐标轴盒状显示 ishold 返回hold的状态caxis 为彩色坐标轴刻度 subplot 将图形窗口分为几个区域cla 清除当前坐标轴附录15.3处理图形对象函数名功能描述函数名功能描述axes 坐标轴生成 surface 表面生成figure 图形窗口生成 text 文本生成image 图像生成 unicontrol 生成一个用户接口控制light 光源生成 uimenu 菜单生成line 线生成附录15.4图形函数名功能描述函数名功能描述copyobj 图像对象拷贝 gcbo 获得当前回调对象的句柄delete 对象删除 gco 获得当前对象的句柄drawnow 消除未解决的图像对象事件 get 获得对象属性findobj 查找对象 reset 重新设置对象属性gebf 获得当前回调窗口的句柄 set 设置对象属性附录16 GUI(图形用户接口)附录16.1GUI函数函数名功能描述函数名功能描述ginput 获取鼠标输入 uiresume 继续执行selectmoveresize 对象的选择、移动、大小设置、拷贝 uiwait 中断执行uicontrol 生成图形用户接口对象 waitgorbutterpress 等待按钮输入uimenu 生成菜单对象 waitfor 中断执行附录16.2GUI设计工具函数名功能描述函数名功能描述align 坐标轴与用户接口控制的对齐工具 menuedit 菜单编辑器cbedit 回调函数编辑器 propedit 属性编辑器guide GUI设计工具附录16.3对话框函数名功能描述函数名功能描述dialog 对话框生成 printdlg 打印对话框axlimdig 坐标轴设限对话框 questdlg 请求对话框errordlg 错误对话框 uigetfile 标准的打开文件对话框helpdlg 帮助对话框 uiputfile 标准的保存文件对话框inputdlg 输入对话框 uisetcolor 颜色选择对话框listdlg 列表选择对话框 uisetfont 字体选择对话框msgdlg 消息对话框 waitbar 等待条显示pagedlg 页位置对话框 warndlg 警告对话框附录16.4菜单函数名功能描述函数名功能描述makemenu 生成菜单结构 umtoggle 菜单对象选中状态切换menubar 设置菜单条属性 wimenu 生成window菜单项的子菜单附录16.5组按钮函数名功能描述函数名功能描述btndown 组按钮中的按钮按下 btnstate 查询按钮中的按钮状态btngroup 组按钮生成 btnup 组按钮中的按钮弹起btnpress 组按钮中的按钮按下管理附录16.6自定义窗口属性函数名功能描述函数名功能描述clruprop 清除用户自定义属性 setuprop 设置用户自定义属性getuprop 获取用户自定义属性附录16.7其他应用函数名功能描述函数名功能描述allchild 获取所有子对象 popupstr 获取弹出式菜单选中项的字符串edtext 坐标轴文本对象编辑 remapfig 改变窗口中对象的位置findall 查找所有对象 setptr 设置窗口指针getptr 获得窗口指针 setstatus 设置窗口中文本传状态getstatus 获取窗口中文本状态附录17 声音处理函数名功能描述函数名功能描述soond 将向量转换成声音 wavread 读。
雨量预报数学模型及求解代码

赛区评阅编号(由赛区组委会填写):2015高教社杯全国大学生数学建模竞赛承诺书我们仔细阅读了《全国大学生数学建模竞赛章程》和《全国大学生数学建模竞赛参赛规则》(以下简称为“竞赛章程和参赛规则”,可从全国大学生数学建模竞赛网站下载)。
我们完全明白,在竞赛开始后参赛队员不能以任何方式(包括电话、电子邮件、网上咨询等)9月6日编号专用页全国评阅随机编号(由全国组委会填写):雨量预报方法的评价模型摘要本文建立了一个关于雨量预报方法的评价模型。
首先,通过给定的大量数据(预测数据和实测数据)利用Matlab图形处理功能的基本绘图命令plot画出2491个网格点和91个观测点的位置。
在可接受范围内,计算各观测站点和等距网格点之间的距离,并按升序排序。
取其前5个到观测站点距离最小的等距网格点,再根据欧拉公式距离倒数加权的方法对它们赋权重,取其前5个网格点的雨量,分别乘以它们各自对应的权并求和,就是相对应观测站点的雨量。
分别对两种S221FORECAST中,其余文件名为<f日期i>_dis1和<f日期i>_dis2表示该日期用的第一或第二种方法。
题目中有如下假设:1、雨量用毫米作单位,小于0.1毫米的视为无雨。
2、气象部门将6小时降雨量分为6等:0.1—2.5毫米为小雨,2.6—6毫米为中雨,6.1—12毫米为大雨,12.1—25毫米为暴雨,25.1—60毫米为大暴雨,大于60.1毫米为特大暴雨。
题目的问题如下:问题一:请建立数学模型来评价两种6小时雨量预报方法的准确性;问题二:若按此分级向公众预报,如何在评价方法中考虑公众的感受?二、问题分析我们从题目中了解分析得到:气象台每天晚上20点预报从21点开始的4个时段(21点至次日3点,次日3点至9点,9点至15点,15点至21点)在某些位置的雨量,这些位置位于东经120度,北纬32度附近的53 47的等距网格点上。
同时设立91个分布不均匀的观测站点实测这些时段的实际雨量。
完整word版,matlab代码大全
完整word版,matlab代码大全MATLAB主要命令汇总MATLAB函数参考附录1.1 管理用命令函数名功能描述函数名功能描述addpath 增加一条搜索路径 rmpath 删除一条搜索路径demo 运行Matlab演示程序 type 列出.M文件doc 装入超文本文档 version 显示Matlab的版本号help 启动联机帮助 what 列出当前目录下的有关文件lasterr 显示最后一条信息 whatsnew 显示Matlab的新特性lookfor 搜索关键词的帮助 which 造出函数与文件所在的目录path 设置或查询Matlab路径附录1.2管理变量与工作空间用命令函数名功能描述函数名功能描述clear 删除内存中的变量与函数 pack 整理工作空间内存disp 显示矩阵与文本 save 将工作空间中的变量存盘length 查询向量的维数 size 查询矩阵的维数load 从文件中装入数据 who,whos 列出工作空间中的变量名附录1.3文件与操作系统处理命令函数名功能描述函数名功能描述cd 改变当前工作目录 edit 编辑.M文件delete 删除文件 matlabroot 获得Matlab的安装根目录diary 将Matlab运行命令存盘 tempdir 获得系统的缓存目录dir 列出当前目录的内容 tempname 获得一个缓存(temp)文件! 执行操作系统命令附录1.4窗口控制命令函数名功能描述函数名功能描述echo 显示文件中的Matlab中的命令 more 控制命令窗口的输出页面format 设置输出格式附录1.5启动与退出命令函数名功能描述函数名功能描述matlabrc 启动主程序 quit 退出Matlab环境startup Matlab自启动程序附录2 运算符号与特殊字符附录2.1运算符号与特殊字符函数名功能描述函数名功能描述+ 加 ... 续行标志- 减 , 分行符(该行结果不显示)* 矩阵乘 ; 分行符(该行结果显示).* 向量乘 % 注释标志^ 矩阵乘方 ! 操作系统命令提示符.^ 向量乘方矩阵转置kron 矩阵kron积 . 向量转置\ 矩阵左除 = 赋值运算/ 矩阵右除 == 关系运算之相等.\ 向量左除 ~= 关系运算之不等./ 向量右除 < 关系运算之小于: 向量生成或子阵提取 <= 关系运算之小于等于() 下标运算或参数定义 > 关系运算之大于[] 矩阵生成 >= 关系运算之大于等于{} & 逻辑运算之与. 结构字段获取符 | 逻辑运算之或. 点乘运算,常与其他运算符联合使用(如.\) ~ 逻辑运算之非xor 逻辑运算之异成附录2.2逻辑函数函数名功能描述函数名功能描述all 测试向量中所用元素是否为真is*(一类函数) 检测向量状态.其中*表示一个确定的函数(isinf)any 测试向量中是否有真元素*isa 检测对象是否为某一个类的对象exist 检验变量或文件是否定义 logical 将数字量转化为逻辑量find 查找非零元素的下标附录3 语言结构与调试附录3.1编程语言函数名功能描述函数名功能描述builtin 执行Matlab内建的函数 global 定义全局变量eval 执行Matlab语句构成的字符串 nargchk 函数输入输出参数个数检验feval 执行字符串指定的文件 script Matlab语句及文件信息function Matlab函数定义关键词附录3.2控制流程函数名功能描述函数名功能描述break 中断循环执行的语句 if 条件转移语句case 与switch结合实现多路转移otherwise 多路转移中的缺省执行部分else 与if一起使用的转移语句 return 返回调用函数elseif 与if一起使用的转移语句 switch 与case结合实现多路转移end 结束控制语句块 warning 显示警告信息error 显示错误信息 while 循环语句for 循环语句附录3.3交互输入函数名功能描述函数名功能描述input 请求输入 menu 菜单生成keyboard 启动键盘管理 pause 暂停执行附录3.4面向对象编程函数名功能描述函数名功能描述class 生成对象 isa 判断对象是否属于某一类double 转换成双精度型 superiorto 建立类的层次关系inferiorto 建立类的层次关系unit8 转换成8字节的无符号整数inline 建立一个内嵌对象附录3.5调试函数名功能描述函数名功能描述dbclear 清除调试断点 dbstatus 列出所有断点情况dbcont 调试继续执行 dbstep 单步执行dbdown 改变局部工作空间内存 dbstop 设置调试断点dbmex 启动对Mex文件的调试sbtype 列出带命令行标号的.M 文件dbquit 退出调试模式 dbup 改变局部工作空间内容dbstack 列出函数调用关系附录4 基本矩阵与矩阵处理附录4.1基本矩阵函数名功能描述函数名功能描述eye 产生单位阵 rand 产生随机分布矩阵linspace 构造线性分布的向量 randn 产生正态分布矩阵logspace 构造等对数分布的向量 zeros 产生零矩阵ones 产生元素全部为1的矩阵 : 产生向量附录4.2特殊向量与常量函数名功能描述函数名功能描述ans 缺省的计算结果变量 non 非数值常量常由0/0或Inf/Inf获得computer 运行Matlab的机器类型 nargin 函数中参数输入个数eps 精度容许误差(无穷小) nargout 函数中输出变量个数flops 浮点运算计数 pi 圆周率i 复数单元 realmax 最大浮点数值inf 无穷大 realmin 最小浮点数值inputname 输入参数名 varargin 函数中输入的可选参数j 复数单元 varargout 函数中输出的可选参数附录4.3时间与日期函数名功能描述函数名功能描述calender 日历 eomday 计算月末clock 时钟 etime 所用时间函数cputime 所用的CPU时间 now 当前日期与时间date 日期 tic 启动秒表计时器datenum 日期(数字串格式) toc 读取秒表计时器datestr 日期(字符串格式) weekday 星期函数datevoc 日期(年月日分立格式)附录4.4矩阵处理函数名功能描述函数名功能描述cat 向量连接 reshape 改变矩阵行列个数diag 建立对角矩阵或获取对角向量 rot90 将矩阵旋转90度fliplr 按左右方向翻转矩阵元素 tril 取矩阵的下三角部分flipud 按上下方向翻转矩阵元素 triu 取矩阵的上三角部分repmat 复制并排列矩阵函数附录5 特殊矩阵函数名功能描述函数名功能描述compan 生成伴随矩阵 invhilb 生成逆hilbert矩阵gallery 生成一些小的测试矩阵 magic 生成magic矩阵hadamard 生成hadamard矩阵 pascal 生成pascal矩阵hankel 生成hankel矩阵 toeplitz 生成toeplitz矩阵hilb 生成hilbert矩阵 wilkinson 生成wilkinson特征值测试矩阵附录6 数学函数附录6.1三角函数函数名功能描述函数名功能描述sin/asin 正弦/反正弦函数 sec/asec 正割/反正割函数sinh/asinh 双曲正弦/反双曲正弦函数 sech/asech 双曲正割/反双曲正割函数cos/acos 余弦/反余弦函数 csc/acsc 余割/反余割函数cosh/acosh 双曲余弦/反双曲余弦函数csch/acsch 双曲余割/反双曲余割函数tan/atan 正切/反正切函数 cot/acot 余切/反余切函数tanh/atanh 双曲正切/反双曲正切函数coth/acoth 双曲余切/反双曲余切函数atan2 四个象限内反正切函数附录6.2指数函数函数名功能描述函数名功能描述exp 指数函数 log10 常用对数函数log 自然对数函数 sqrt 平方根函数附录6.3复数函数函数名功能描述函数名功能描述abs 绝对值函数 imag 求虚部函数angle 角相位函数 real 求实部函数conj 共轭复数函数附录6.4数值处理函数名功能描述函数名功能描述fix 沿零方向取整 round 舍入取整floor 沿-∞方向取整 rem 求除法的余数ceil 沿+∞方向取整 sign 符号函数附录6.5其他特殊数学函数函数名功能描述函数名功能描述airy airy函数 erfcx 比例互补误差函数besselh bessel函数(hankel函数) erfinv 逆误差函数bessili 改进的第一类bessel函数 expint 指数积分函数besselk 改进的第二类bessel函数 gamma gamma函数besselj 第一类bessel函数 gammainc 非完全gamma函数bessely 第二类bessel函数 gammaln gamma对数函数beta beta函数 gcd 最大公约数betainc 非完全的beta函数 lcm 最小公倍数betaln beta对数函数 log2 分割浮点数elipj Jacobi椭圆函数 legendre legendre伴随函数ellipke 完全椭圆积分 pow2 基2标量浮点数erf 误差函数 rat 有理逼近erfc 互补误差函数 rats 有理输出附录7 坐标转换函数名功能描述函数名功能描述cart2pol 笛卡儿坐标到极坐标转换 pol2cart 极坐标到笛卡儿坐标转换cart2sph 笛卡儿坐标到球面坐标转换sph2cart 球面坐标到笛卡儿坐标转换附录8 矩阵函数附录8.1矩阵分析函数名功能描述函数名功能描述cond 求矩阵的条件数 rcond LINPACK倒数条件估计det 求矩阵的行列式 rref 矩阵的行阶梯型实现norm 求矩阵的范数 rrefmovie 消元法解方程演示null 右零空间 subspace 子空间orth 正交空间 trace 矩阵的迹rank 求矩阵的秩附录8.2线性方程函数名功能描述函数名功能描述/,\ 线性方程求解 nnls 非零最小二乘chol Cholesky分解 pinv 求伪逆矩阵inv 矩阵求逆 qr 矩阵的QR分解lscov 最小二乘方差 qrdelete QR分解中删除一行lu 矩阵的LU三角分解 qrinsert QR分解中插入一行附录8.3特征值与奇异值函数名功能描述函数名功能描述banlance 改进特征值精度的均衡变换 qz QZ算法求矩阵特征值cdf2rdf 复块对角阵到实块对角阵转换 rdf2cdf 实块对角阵到复块对角阵转换eig 求矩阵的特征值和特征向量 schur Schur分解hess 求Hessenberg矩阵 svd 奇异值分解poly 求矩阵的特征多项式附录8.4矩阵函数函数名功能描述函数名功能描述expm 矩阵指数函数 logm 矩阵对数函数funm 矩阵任意函数 sqrtm 矩阵平方根附录9 数据分析与Fourier变换函数附录9.1基本运算函数名功能描述函数名功能描述cumprod 向量累积 prod 对向量中各元素求积cumsum 向量累加 sort 对向量中各元素排序max 求向量中最大元素 sortrows 对矩阵中各行排序min 求向量中最小元素 std 求向量中各元素标准差mean 求向量中各元素均值 sum 对向量中各元素求和median 求向量中中间元素 trapz 梯形法求数值积分附录9.2微分计算函数名功能描述函数名功能描述del2 离散Laplace变换 gradient 梯度计算diff 差分于近视微分附录9.3滤波与卷积函数名功能描述函数名功能描述Conv 卷给与多项式乘法 filter 一维数字滤波conv2 二维卷积 filter2 二维数字滤波Deconv 因式分解与多项式乘法附录9.4方差处理函数名功能描述函数名功能描述corrcoef 相关系数计算 cov 协方差计算附录9.5Fourier变换函数名功能描述函数名功能描述abs 绝对值函数 fftshift fft与fft2输出重排angle 相角函数 ifft 离散Fourier逆变换cplxpair 依共轭复数对重新排序 ifft2 二维离散Fourier逆变换fft 离散Fourier变换 unwrap 相角矫正fft2 二维离散Fourier变换附录10 多项式处理函数附录10.1多项式处理函数名功能描述函数名功能描述conv 卷机与多项式乘法 polyfit 数据的多项式拟合deconv 因式分解与多项式乘法 polyval 多项式求值poly 求矩阵的特征多项式 polyvalm 多项式矩阵求值polyder 多项式求导 residue 部分分式展开polyeig 多项式特征值 roots 求多项式的根附录10.2数据插值函数名功能描述函数名功能描述griddata 数据网络的插值生成 interpft 一维插值(FFT方法)interp1 一维插值(查表) interpn 多维插值(查表)interp2 二维插值(查表) meshgrid 构造三维图形用x,y阵列interp3 三维插值(查表) spline 三次样条插值附录11 非线性数值方法函数名功能描述函数名功能描述dblquad 双重积分 odeget 获得微分方程求解的可选参数fmin 单变量最优化函数 odeset 设置微分方程求解的可选参数fmins 多变量最优化函数 quad 低阶数值积分方法ode45,ode23,ode113,ode15s,ode23s 微分方程数值解法 quad8 高阶数值积分方法odefile 对文件定义的微分方程求解附录12 稀疏矩阵函数附录12.1基本稀疏矩阵函数名功能描述函数名功能描述spdiags 稀疏对角矩阵 sprandn 稀疏正态分布随机矩阵speye 稀疏单位矩阵 sprandsym 稀疏对称随机矩阵sprand 稀疏均匀分布随机矩阵附录12.2稀疏矩阵转换函数名功能描述函数名功能描述find 查找非零元素下标 sparse 常规矩阵转换为稀疏矩阵full 稀疏矩阵转换为常规矩阵spconvert 由外部格式引入稀疏矩阵附录12.3处理非零元素函数名功能描述函数名功能描述issparse 判断元素是否为稀疏矩阵 nzmax 允许的非零元素空间mmz 稀疏矩阵的非零元素个数 spalloc 为非零元素定位存储空间nonzeros 稀疏矩阵的非零元素 spfun 为非零元素定义处理函数附录12.4稀疏矩阵可视化函数名功能描述函数名功能描述gplot 绘制图论图形 spy 绘制稀疏矩阵结构附录12.5排序算法函数名功能描述函数名功能描述colmmd 列最小度排序 randperm 产生随机置换向量colperm 由非零元素的个数排序各列symmd 对称最小度排序dmperm Dulmage-Mendelsohn分解 symrcm 反向Cuthill-McKee 排序附录12.6范数、条件数函数名功能描述函数名功能描述condest 估算||*||1范数 normest 估算||*||2范数sprank 计算结构秩附录12.7特征值与奇异值函数名功能描述函数名功能描述eigs 求稀疏矩阵特征值和特征向量 svds 稀疏矩阵奇异值分解附录12.8其他函数名功能描述函数名功能描述spaugment 最小二乘算法形成 symbact 符号因子分解spparms 设置稀疏矩阵参数附录13 图形绘制附录13.1基本二维图形函数名功能描述函数名功能描述fill 填充二维多边形 polar 极坐标图形绘制loglog 全对数二维坐标绘制 semilogx x轴半对数坐标图形绘制plot 线性坐标图形绘制 semilogy y轴半对数坐标图形绘制附录13.2基本三维图形函数名功能描述函数名功能描述fill3 三维多边形填充 plot3 三维线或点型图绘制mesh 三维网格图形绘制 surf 三维表面图形绘制附录13.3三维颜色控制函数名功能描述函数名功能描述brighten 图形亮度调整 hidden 网格图的网格线开关设置caxis 坐标轴伪彩色设置 shading 设置渲染模式colormap 调色板设置附录13.4三维光照模型函数名功能描述函数名功能描述diffuse 图象漫射处理 surf1 带光照的三维表面绘制lighting 光照模式设置 surfnorm 曲面法线specular 设置镜面反射附录13.5标准调色板设置函数名功能描述函数名功能描述bone 带有蓝色调的灰色的调色板 hot 以黑红黄白为基色的调色板cool 以天蓝粉色为基色的调色板hsv 色度饱和度亮度调色板copper 线性铜色调的调色板 pink 粉色色调的调色板flag 以红白蓝黑为基色的调色板 prism 光谱颜色表gray 线性灰度调色板附录13.6三维视点控制函数名功能描述函数名功能描述rotate3d 设置三维旋转开关 viewmtx 求视转换矩阵view 设置视点附录13.7坐标轴控制函数名功能描述函数名功能描述axis 坐标轴标度设置 hold 设置当前图形保护模式axes 坐标轴位置设置 subplot 将图形窗口分成几个区域box 坐标轴盒状显示 zoom 二维图形缩放grid 坐标网格线开关设置附录13.8图形注解函数名功能描述函数名功能描述colorbar 颜色条设置 xlabel 给图形的x轴加文字说明gtext 在鼠标位置加文字说明 ylabel 给图形的y轴加文字说明text 在图形上加文字说明 zlabel 给图形的z轴加文字说明title 给图形加标题附录13.9拷贝与打印函数名功能描述函数名功能描述print 打印图形或将图形存盘 orient 设置纸的方向orintopt 设置打印机为默认值附录14 特殊图形附录14.1特殊二维图形函数名功能描述函数名功能描述area 区域填充 feather 羽状条形图绘制bar 条形图绘制 fplot 给定函数绘制barh 水平条形图绘制 hist 直方图绘制bar3 3维条形图绘制 pareto pareto图绘制bar3h 3维水平条形图绘制 pie 饼状图绘制comet 彗星状轨迹绘制 stem 离散序列图形绘制errorbar 误差条形图绘制 stairs 梯形图绘制附录14.2等高线及其他二维图形函数名功能描述函数名功能描述contour 等高线绘制 pcolor 伪色绘制contourf 等高线填充绘制 quiver 有向图(箭头)绘制contour3 三维等高线绘制 voronoil voronoi图绘制clabel 等高线高程标志附录14.3特殊三维图形函数名功能描述函数名功能描述comet3 三维彗星状轨迹绘制 slice 切片图meshc 带等高线的三维网格绘制surfc 带等高线的三维表面绘制meshz 带零平面的三维网格绘制trisurf 表面图形的三角绘制stem2 杆图绘制 trimesh 网格图形的三角绘制quiver3 三维箭头(有向图)绘制 waterfall 瀑布型图形的绘制附录14.4图象显示与文件I/O函数名功能描述函数名功能描述brighten 图形色调亮化 image 图像显示colorbar 颜色条设置 imfinfo 图形文件信息colormap 调色板设置 imread 从文件读取图形contrast 灰度对比度设置 imwrite 保存图像附录14.5动画处理函数名功能描述函数名功能描述capture 屏幕抓取 movie 播放动画帧getframe 获取动画帧附录14.6实体模型函数名功能描述函数名功能描述cylinder 圆柱体生成 sphere 球体生成附录15 图形处理附录15.1图形窗口生成与控制函数名功能描述函数名功能描述clf 清除当前图形窗口 gcf 获取当前图形的窗口句柄close 关闭图形窗口 refresh 图形窗口刷新figure 生成图形窗口 shg 显示图形窗口附录15.2坐标轴建立与控制函数名功能描述函数名功能描述axes 坐标轴标度设置 gca 获得当前坐标轴句柄axis 坐标轴位置设置 hold 设置当前图形保护模式box 坐标轴盒状显示 ishold 返回hold的状态caxis 为彩色坐标轴刻度 subplot 将图形窗口分为几个区域cla 清除当前坐标轴附录15.3处理图形对象函数名功能描述函数名功能描述axes 坐标轴生成 surface 表面生成figure 图形窗口生成 text 文本生成image 图像生成 unicontrol 生成一个用户接口控制light 光源生成 uimenu 菜单生成line 线生成附录15.4图形函数名功能描述函数名功能描述copyobj 图像对象拷贝 gcbo 获得当前回调对象的句柄delete 对象删除 gco 获得当前对象的句柄drawnow 消除未解决的图像对象事件 get 获得对象属性findobj 查找对象 reset 重新设置对象属性gebf 获得当前回调窗口的句柄 set 设置对象属性附录16 GUI(图形用户接口)附录16.1GUI函数函数名功能描述函数名功能描述ginput 获取鼠标输入 uiresume 继续执行selectmoveresize 对象的选择、移动、大小设置、拷贝 uiwait 中断执行uicontrol 生成图形用户接口对象 waitgorbutterpress 等待按钮输入uimenu 生成菜单对象 waitfor 中断执行附录16.2GUI设计工具函数名功能描述函数名功能描述align 坐标轴与用户接口控制的对齐工具 menuedit 菜单编辑器cbedit 回调函数编辑器 propedit 属性编辑器guide GUI设计工具附录16.3对话框dialog 对话框生成 printdlg 打印对话框axlimdig 坐标轴设限对话框 questdlg 请求对话框errordlg 错误对话框 uigetfile 标准的打开文件对话框helpdlg 帮助对话框 uiputfile 标准的保存文件对话框inputdlg 输入对话框 uisetcolor 颜色选择对话框listdlg 列表选择对话框 uisetfont 字体选择对话框msgdlg 消息对话框 waitbar 等待条显示pagedlg 页位置对话框 warndlg 警告对话框附录16.4菜单函数名功能描述函数名功能描述makemenu 生成菜单结构umtoggle 菜单对象选中状态切换menubar 设置菜单条属性 wimenu 生成window菜单项的子菜单附录16.5组按钮函数名功能描述函数名功能描述btndown 组按钮中的按钮按下btnstate 查询按钮中的按钮状态btngroup 组按钮生成 btnup 组按钮中的按钮弹起btnpress 组按钮中的按钮按下管理附录16.6自定义窗口属性函数名功能描述函数名功能描述clruprop 清除用户自定义属性setuprop 设置用户自定义属性getuprop 获取用户自定义属性附录16.7其他应用函数名功能描述函数名功能描述allchild 获取所有子对象 popupstr 获取弹出式菜单选中项的字符串edtext 坐标轴文本对象编辑remapfig 改变窗口中对象的位置findall 查找所有对象 setptr 设置窗口指针getptr 获得窗口指针 setstatus 设置窗口中文本传状态getstatus 获取窗口中文本状态附录17 声音处理soond 将向量转换成声音 wavread 读。
最大降水量多年一遇计算方法及Matlab实现
文 章 编 号 :1007-0907(2012)01-0075-02
当暴雨洪涝等灾情出现时,“几年一遇” 经常作为标志灾害
强度出现在媒体口中。 那么如何计算和快速计算某一特定气象
要素值究竟是几年一遇呢? 本文通过 Matlab 实例对比分析三种
常见的多年一遇的计算方法。 “几年一遇”在数学上实际上就是
概率与数理统计中极值分布问题。这类问题的解决,在城市建设
灾害防御规划中,有重要的社会和经济意义。
本 文 使 用 的 Matlab 版 本 为 7.10.0 (R2010a), 以 阿 里 河 镇
1961-2009 年 49 年最大日降水量为例,分别通过指数分布法、耿
贝尔分布法及皮尔逊 III 分布法讨论及编程计算。 具体数据如下:
内蒙古农业科技 2012(1):75~76 Inner Mongolia Agricultural Science And Technology
最大降水量多年一遇计算方法及 Matlab 实现
王 涵, 李 玲 (鄂伦春旗气象局,内蒙古 鄂伦春 165450)
中图分类号:S161.6 文献标识码:A 10.3969/j.jssn.1007-0907.2012.01.042
型的,指数分布形式如下:
x=algT+b
根据求解过程,关键部分编程如下:
暴雨强度公式参数提取的Matlab实现
w ih i a e n n n i e r la t s ae p n i l , wa p l d T e p p r u e h e u t o ti e y Ma a ot a e h c s b s d o o l a e s q r r c p e n u i s a p i . h a e s d t e r s l b an d b d b s f r e s w p o r mmi g a h mt au ,t e s d E c ls le o o t z sp r me e . p c le a l h w h t h r cso rga n s te i i v l e h n u e x e ov rt p i e i aa tr A t i a x mp e s o s t a e p e ii n l a mi t y t c l me tn t n t n a d al e ai a sa d r . ol Ke r s tr it n i ; ra p a r d y wo d :som n e st y e p e r p i ;p e i i t n t ; Mal b E c lp g a e o rc pt i i a o me t ; x e r r mmi g s l e a o n ov r
W ANG e hu , L o g n W ANG n Zh n— a ITa —ua g , Ya
( .Istt D t rl i l c nei h ni r ne a u nS a x 00 0 ,C i ; 1 ntu i e ,Me oo gc i c S ax  ̄ic,T i a h ni 30 2 hn e o aSe n P y a
暴雨强度公式是一种 暴雨灾 害管 理的重要基 础模 型 , 是
雨流计数法matlab程序
雨流计数法是一种用于分析汽车零部件疲劳寿命的方法,它可以计算出在给定载荷谱下零部件的疲劳寿命。
下面是一个简单的MATLAB 程序,用于实现雨流计数法:matlabfunction [N, N1] = rainflow(P)# 输入:P - 载荷谱矩阵# 输出:N - 循环次数矩阵# N1 - 最小循环次数矩阵n = size(P, 2);N = zeros(n, n);N1 = zeros(n, n);for i = 1:nfor j = 1:nif P(i, j) > 0N(i, j) = floor(P(i, j));N1(i, j) = floor(P(i, j));elseN(i, j) = ceil(-P(i, j));N1(i, j) = ceil(-P(i, j));endendendN = N + N'; # 对称化循环次数矩阵N1 = N1 + N1'; # 对称化最小循环次数矩阵end这个程序定义了一个名为rainflow 的函数,它接受一个载荷谱矩阵P 作为输入,并返回两个输出矩阵:N 和N1。
N 是循环次数矩阵,表示在给定载荷谱下零部件的循环次数;N1 是最小循环次数矩阵,表示在给定载荷谱下零部件的最小循环次数。
在函数内部,我们首先初始化N 和N1 为零矩阵。
然后,我们使用两个嵌套的循环遍历载荷谱矩阵P 中的每个元素。
如果元素的值大于零,我们将该值向下取整并存储在N 和N1 中;如果元素的值小于零,我们将该值的绝对值向上取整并存储在N 和N1 中。
最后,我们将N 和N1 对称化,以确保它们是对称矩阵。
- 1、下载文档前请自行甄别文档内容的完整性,平台不提供额外的编辑、内容补充、找答案等附加服务。
- 2、"仅部分预览"的文档,不可在线预览部分如存在完整性等问题,可反馈申请退款(可完整预览的文档不适用该条件!)。
- 3、如文档侵犯您的权益,请联系客服反馈,我们会尽快为您处理(人工客服工作时间:9:00-18:30)。
% RAINFLOW cycle counting.
% RAINFLOW counting function allows you to extract
% cycle from random loading.
%
% SYNTAX
% rf = RAINFLOW(ext)
% rf = RAINFLOW(ext, dt)
% rf = RAINFLOW(ext, extt)
%
% OUTPUT
% rf - rainflow cycles: matrix 3xn or 5xn dependend on input,
% rf(1,:) Cycles amplitude,
% rf(2,:) Cycles mean value,
% rf(3,:) Number of cycles (0.5 or 1.0),
% rf(4,:) Begining time (when input includes dt or extt data),
% rf(5,:) Cycle period (when input includes dt or extt data),
%
% INPUT
% ext - signal points, vector nx1, ONLY TURNING POINTS!,
% dt - sampling time, positive number, when the turning points
% spaced equally,
% extt - signal time, vector nx1, exact time of occurrence of turning points. %
%
% See also SIG2EXT, RFHIST, RFMATRIX, RFPDF3D.
% RAINFLOW
% Copyright (c) 1999-2002 by Adam Nieslony,
% MEX function.
function rfdemo1(ext)
% function rfdemo1(ext)
%
% RFDEMO1 shows cycles extracted from signal
% using rainflow algoritm.
%
% INPUT: ext - option, number or vectors with turning
% points or time history. Default ext=16.
%
% OUTPUT: no enable.
%
% SYNTAX:
% >>rfdemo1
% >>rfdemo1(10)
% >>rfdemo1([2 3 2 4 2 5 1 6])
%
% By Adam Nies硂ny
% Revised, 10-Nov-2009
% Visit the MATLAB Central File Exchange for latest version.
error(nargchk(0,2,nargin))
if nargin==0,
% turning points from 16 random numbers
ext=sig2ext(randn(4));
elseif length(ext(:))==1,
% turning points from n random numbers
ext=sig2ext(randn(1,ext));
else
% turning points from vector ext
ext=sig2ext(ext);
end
a=rainflow(ext,1);
[m n]=size(a);
% if n>100,
% button = questdlg(['Rainflow found ' num2str(sum(a(3,:))) ' cycles! Do you want to continue?'],...
% 'Continue Operation','Yes','No','No');
% if strcmp(button,'No')
% error('Function aborted by user.')
% end
% end
col='ymcrgb';
plot(0:length(ext)-1,ext,'k.:')
hold on
wyk=0:0.05:1;
for c=1:n,
colnr=rem(c-1,6)+1;
nr1=round(a(4,c)+1);
nr2=round(a(4,c)+1+a(5,c)*a(3,c));
if a(3,c)==1.0,
if ext(nr1)<ext(nr1+1),
plot(wyk.*a(5,c)+a(4,c),cos(pi+wyk.*2*pi)*a(1,c)+a(2,c),col(colnr))
text(a(4,c),a(2,c)-a(1,c),[int2str(c) '. Cycle, up'],...
'Color',col(colnr),'VerticalAlignment','top')
else
plot(wyk.*a(5,c)+a(4,c),cos( wyk.*2*pi)*a(1,c)+a(2,c),col(colnr))
text(a(4,c),a(2,c)+a(1,c),[int2str(c) '. Cycle, down'],...
'Color',col(colnr),'VerticalAlignment','bottom')
end
else
if ext(nr1)>ext(nr2),
plot(wyk.*a(5,c)*0.5+a(4,c),cos( wyk.*pi)*a(1,c)+a(2,c),col(colnr))
text(a(4,c),a(2,c)+a(1,c),[int2str(c) '. Half-cycle, down'],...
'Color',col(colnr),'VerticalAlignment','bottom')
else
plot(wyk.*a(5,c)*0.5+a(4,c),cos(pi+wyk.*pi)*a(1,c)+a(2,c),col(colnr))
text(a(4,c),a(2,c)-a(1,c),[int2str(c) '. Half-cycle, up'],...
'Color',col(colnr),'VerticalAlignment','top')
end
end
end
xlabel('peaks, counted from 0')
ylabel('value')
title('Rainflow cycles extracted from signal')
legend('peaks from signal',0)
hold off
disp('Row 1: amplitude')
disp('Row 2: mean')
disp('Row 3: number of cycles (cycle or half cycle)')
disp('Row 4: begin time of extracted cycle or half cycle')
disp('Row 5: period of a cycle')
disp(a)。