雅思小作文必背2(柱状)附大作文素材
雅思背范文(通用十三篇)

雅思背范文(通用十三篇)(经典版)编制人:__________________审核人:__________________审批人:__________________编制单位:__________________编制时间:____年____月____日序言下载提示:该文档是本店铺精心编制而成的,希望大家下载后,能够帮助大家解决实际问题。
文档下载后可定制修改,请根据实际需要进行调整和使用,谢谢!并且,本店铺为大家提供各种类型的经典范文,如工作总结、工作计划、合同协议、条据文书、策划方案、句子大全、作文大全、诗词歌赋、教案资料、其他范文等等,想了解不同范文格式和写法,敬请关注!Download tips: This document is carefully compiled by this editor. I hope that after you download it, it can help you solve practical problems. The document can be customized and modified after downloading, please adjust and use it according to actual needs, thank you!Moreover, our store provides various types of classic sample essays for everyone, such as work summaries, work plans, contract agreements, doctrinal documents, planning plans, complete sentences, complete compositions, poems, songs, teaching materials, and other sample essays. If you want to learn about different sample formats and writing methods, please stay tuned!雅思背范文(通用十三篇)雅思背范文(篇一)With the adoption of the quality-education policy, many advanced teaching methods have been introduced to China,Meanwhile,many middle schools still find a good way to publicize to scores and ranks to introduce good candidates to key universities fairly.Competition is part of our modern life.If I know the eXact position where I am, I will spare no effort to catch up with others.Besides, we will face the pressure that making scores publicized applies to us.We, Senior Three students, have no choice but to adapt ourselves to all the pressure, which helps us develop our full personality.Though no one is to blame eXcept myself if the ranks are made known, test scores are private.In many eXperts’ eyes,individual student should have his own right of privacy.It’s time for education authority to create a better environment to promote quality-education, where every student can really improve himself.雅思背范文(篇二)You should spend about 40 minutes on this task.Some people think the university education is to preparestudents for employment,others think it has other functions.Discuss and say what the other functions are?You should write at least 250 words.You should use your own ideas of knowledge and eXperience and support your arguments with eXamples and relevant evidence.Some people think the university education is to prepare students for employment.While we admit that preparation for employment is an important function of education, it is not the only one.We should see this issue with an all-sided view.In the perspective of society,education is for improvement.Students make use of what they have learned to create new theories and tools.This is the way in which our human society develops.And also, through education, government can teach people how to be appropriate citizens, thus in this way,people’s moralities and behaviors are constrained in a value system and the social stability can be maintained.In the perspective of individuals, education can enrich personal lives.Through education, we can eXplore different cultures and customs.Thus in this way education can open our eyes and broaden our mind.And education can also meet interests of each student.While of course, all the functions mentioned above haveone common prerequisite: one can make a living in the first place.For this society is practical, many university students have studied for four years, but their ability to deal with practical things is too low to be acceptable.So education should provide the basic general knowledge to university students, so that they can be get employed and make a living.And if a nation wants to develop and to compete with other nations,it needs skilled workers to support economic development and to maintain the people creative, which can only be achieved through education.So it has some sense to realize that students’ preparation for employment is the function of education, but it has far more function which should not be neglected.(280 words) 雅思写作高分范文:eXaminationYou should spend about 40 minutes on this task.Some people think that eXaminations have some bad effects on both students and teachers.Some people say they do a good job in the evaluation of the students’ performance.What is your opinion?You should write at least 250 wordsYou should use your own ideas of knowledge and eXperience and support your arguments with eXamples and relevant evidence.From elementary schools to universities, students have to take many eXaminations.They even regard eXaminations as an indispensable part of their life.In most schools and colleges,eXaminations are used as a chief means of deciding whether a student succeeds or fails in a subject.However, although they do the job efficiently, their side effects are also enormous.EXaminations are unable to evaluate one’s true ability.They can only test memory or the skill of working rapidly under pressure.Sometimes the future of a candidate may be decided in a single eXamination.How can one do his best when he is under the eXtreme pressure? In other words, it does not mean that all of those who get high scores on eXaminations possess creativity in dealing with various problems.There are many stories that eXaminations failures turn out to be great scientists or successful entrepreneurs.Another effect is that eXaminations encourage bad study habits.Students tend to lay emphasis on the content which will be tested.They are encouraged to memorize rather than to think.Moreover, eXaminations induce cramming during the eXam week.However after the eXamination,most children forget nearly all the information and facts they stuff into their heads.EXaminations lower the standards of teaching as well.Theydeprive teachers of all freedom.Since teachers themselves are often judged by eXamination results,they have to train students in eXam techniques instead of teaching their subjects.Furthermore, students are required to learn only what teachers tell them.In conclusion, even though eXaminations have been used in the past, they should no longer be used as the only means of evaluation.They cannot assess a student’s performance in learning and they also have negative impacts on both students and teachers.(290 words)雅思背范文(篇三)The pie charts below show how dangerous waste products are dealt with in three countries.雅思小作文范文:The charts compare Korea, Sweden and the UK in terms of the methods used in each country to dispose of harmful waste.It is clear that in both the UK and Sweden, the majority of dangerous waste products are buried underground.By contrast,most hazardous materials in the Republic of Korea are recycled.Looking at the information in more detail, we can see that 82% of the UK’s dangerous waste is put into landfill sites.This disposal technique is used for 55% of the harmful waste inSweden and only 22% of similar waste in Korea.The latter country recycles 69% of hazardous materials, which is far more than the other two nations.While 25% of Swedens dangerous waste is recycled, the UK does not recycle at all.Instead, it dumps waste at sea or treats it chemically.These two methods are not employed in Korea or Sweden, which favour incineration for 9% and 20% of dangerous waste respectively.(15(9)雅思背范文(篇四)Dear Mr.Wang,I am much grateful to be employed by you two months ago as an editor for your magazine Design & Fashions.I appreciate the opportunity of having worked here with you and other colleagues.The eXperiences will be unforgettable throughout my life.However, as a young man whose primary interest is in computer science rather than fashion designing, I find my present job doesnt fall in with my previous training and strength.I therefore decide to quit this job for something else that may conform to my former preparation.Please accept my sincere apologies for any inconvenience my leaving may cause.Yours truly,Li Ming雅思背范文(篇五)释义:给…加插图( illustrate的第三人称单数 ); 说明; 表明;(用示例、图画等)说明;Throughout, she illustrates her analysis with eXcerpts from discussions.自始至终,她摘引讨论内容来阐明她的分析。
雅思小作文范文柱状图
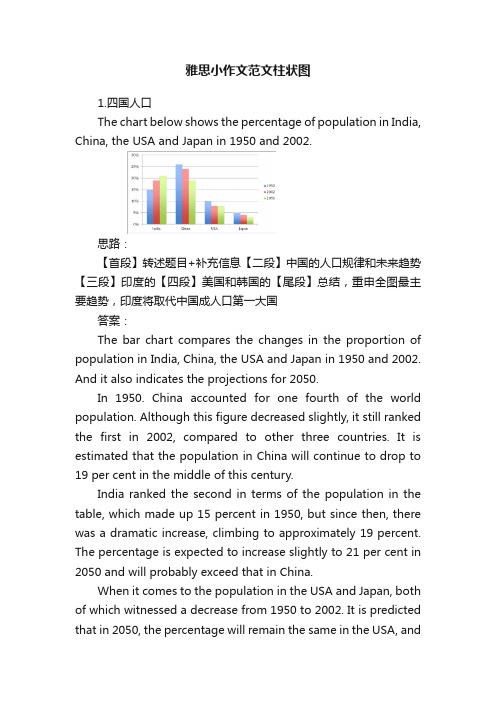
雅思小作文范文柱状图1.四国人口The chart below shows the percentage of population in India, China, the USA and Japan in 1950 and 2002.思路:【首段】转述题目+补充信息【二段】中国的人口规律和未来趋势【三段】印度的【四段】美国和韩国的【尾段】总结,重申全图最主要趋势,印度将取代中国成人口第一大国答案:The bar chart compares the changes in the proportion of population in India, China, the USA and Japan in 1950 and 2002. And it also indicates the projections for 2050.In 1950. China accounted for one fourth of the world population. Although this figure decreased slightly, it still ranked the first in 2002, compared to other three countries. It is estimated that the population in China will continue to drop to 19 per cent in the middle of this century.India ranked the second in terms of the population in the table, which made up 15 percent in 1950, but since then, there was a dramatic increase, climbing to approximately 19 percent. The percentage is expected to increase slightly to 21 per cent in 2050 and will probably exceed that in China.When it comes to the population in the USA and Japan, both of which witnessed a decrease from 1950 to 2002. It is predicted that in 2050, the percentage will remain the same in the USA, andin Japan, the percentage is likely to keep falling.Overall, it seems that India will become the country with the largest population although there is still a huge number of people in China.2.通勤工具Different modes of transport used to travel to and from work in one European city in 1960, 1980 and 2000.思路:1. 分段原则为:上升的一段,下降的一段,波动的一段。
雅思小作文技巧及范文
雅思小作文写作技巧及范文一.图表类型饼状图,直方图或柱形图趋势曲线图表格图流程图或过程图程序图二.解题技巧A. 表格图1 横向比较: 介绍横向各个数据的区别,变化和趋势2 纵向比较:介绍横向各个数据的区别,变化和趋势3 无需将每一个数据分别说明,突出强调数据最大值和最小值,对比时要总结出数据对比最悬殊的和最小的说明:考察例举数字的能力和方法。
注意怎样通过举一些有代表性的数据来有效地说明问题。
B. 曲线图1 极点说明: 对图表当中最高的,最低的点要单独进行说明2 趋势说明: 对图表当中曲线的连续变化进行说明,如上升,下降,波动,持平3 交点说明: 对图表当中多根曲线的交点进行对比说明说明:关键是把握好曲线的走向和趋势,学会 general classification, 即在第二段的开头部分对整个曲线进行一个阶段式的总分类,使写作层次清晰。
接下来在分类描述每个阶段的 specific trend, 同时导入数据作为你分类的依据。
注意不要不做任何说明就机械性的导入数据!可以使用一些比较 native 的单词和短语来描述 trend。
C. 饼状图1 介绍各扇面及总体的关系2 各个扇面之间的比较,同类扇面在不同时间,不同地点的比较3 重点突出特点最明显的扇面:最大的,最小的,互相成倍的D. 柱状图1. 比较 : similarity2.对比 : difference)3.横向总结所有柱状图表的共性特征 & 分别描写各个柱子的个性特征E.流程图1.首先说明:做什么工作的过程,目的是什么 2.准备工作 3.按时间/过程先后描述4.结果 5.简单总结说明:注意流程图里的“因果关系” 或每一流程的“承前启后” 关系;表达每一流程的主体内容,阐明这种关系;揭示其内在联系或规律;最后,给予简要归纳和总结。
F. 实物/器具工作过程 1.实物的名称,功能 2.基本结构 3.工作过程 4.简单总结G. 综合图1 不求甚解,不拘泥于细节2 分门别类,分段落详细介绍各个图表3 不画蛇添足,主观臆断或猜测图表之间的关系三.写作结构框架结构1.开头:该图阐述的是______ 的______.共有以下几个部分组成。
雅思英语图表作文范文(必备3篇)

雅思英语图表作文范文第1篇A类雅思各类图表作文要点及范文一.曲线图解题关键1曲线图和柱状图都是动态图,解题的切入点在于描述趋势。
2在第二段的开头部分对整个曲线进行一个阶段式的总分类,使写作层次清晰,同时也方便考官阅卷。
接下来再分类描述每个阶段的specifictrend,同时导入数据作为分类的依据。
3趋势说明。
即,对曲线的连续变化进行说明,如上升、下降、波动、持平。
以时间为比较基础的应抓住“变化”:上升、下降、或是波动。
题中对两个或两个以上的变量进行描述时应在此基础上进行比较,如变量多于两个应进行分类或有侧重的比较。
4极点说明。
即对图表中最高的、最低的点单独进行说明。
不以时间为比较基础的应注意对极点的描述。
5交点说明。
即对图表当中多根曲线的交点进行对比说明。
6不要不做任何说明就机械地导入数据,这不符合雅思的考试目的。
曲线图常用词汇动词—九大运动趋势一:表示向上:increase,rise,improve,grow,ascend,mount,aggrandize,goup,climb, take off, jump,shoot up暴涨,soar,rocket, skyrocket雅思英语图表作文范文第2篇It is said that countries are becoming similar to each other because of the global spread of the same products, which are now available for purchase almost anywhere. I strongly believe that this modern development is largely detrimental to culture and traditions worldwide.A country’s history, language and ethos are all inextricably bound up in its manufactured artefacts. If the relentless advance of international brands into every corner of the world continues, these bland packages might one day completely oust the traditional objects of a nation, which would be a loss of richness and diversity in the world, as well as the sad disappearance of t he manifestations of a place’s character. What would a Japanese tea ceremony be without its specially crafted teapot, or a Fijian kava ritual without its bowl made from a certain type of tree bark?Let us not forget either that traditional products, whether these be medicines, cosmetics, toy, clothes, utensils or food, provide employment for local people. The spread of multinational products can often bring in its wake a loss of jobs, as people urn to buying the new brand,perhaps thinking it more glamorous than the one they are used to. This eventually puts old-school craftspeople out of work.Finally, tourism numbers may also be affected, as travelers become disillusioned with finding every place just the same as the one they visited previously. To see the same products in shops the world over is boring, and does not impel visitors to open their wallets in the same way that trinkets or souvenirs unique to the particular area too.Some may argue that all people are entitled to have access to the same products, but I say that local objects suit local conditions best, and that faceless uniformity worldwide is an unwelcome and dreary prospect.Heres my full answer:The line graphs show the average monthly amount that parents in Britain spent on their children’s s porting activities and the number of British children who took part in three different sports from 2008 to is clear that parents spent more money each year on their children’s participation in sports over the six-year period. In terms of the number of children taking part, football was significantly more popular than athletics and 2008, British parents spent an average of around £20 per month on their children’s sporting activities. Parents’ spending on children’s sports increased gradually over the followi ng six years, and by 2014 the average monthly amount had risen to just over £ at participation numbers, in 2008 approximately 8 million British children played football, while only 2 million children were enrolled in swimming clubs and less than 1 million practised athletics. The figures for football participation remained relatively stable over the following 6 years. By contrast, participation in swimming almost doubled, to nearly 4 million children, and there was a near fivefold increase in the number of children doing athletics.剑桥雅思6test1大作文范文,剑桥雅思6test1大作文task2高分范文+真题答案实感。
雅思小作文模板
第 1 页中公留学无忧,让留学更简单小作文模板素材雅思小作文很多人不要模板, 拒绝套用雅思作文模板。
但是对于初试者, 或者目 标分是雅思 6 分的学生而言, 作文模板是必要而且也确实有效的。
关键是要有逻 辑性。
只要具备一定的逻辑性,模板一样会非常出彩!雅思小作文总体分为两种: 线状图/饼状图/柱状图/柱状图/表格题/地图题/流程 图万能开头与结尾模板:(6.0 分以下均可适用,6.5 分以上参考使用) 开头1.This graph/pie chart/table/bar chart reflects the (rate/percentage/proportion/number … ) of ( 对 象 ) in(place/country) from …to …2.According to the figure , it is not spurring findings that there was/were 总体趋势的描述(the overall trend tended to indicate …/the general trend is …/其他) 结尾1.In conclude , the overall trend tended to illustrate ……during this XX year period2.the data/statistics/figures lead us to the conclusion that ……这些数 据资料令我们得出结论……按题型类别:(提供很多句式请自选)①线状图1.先(上升/下降)后(下降/上升),之后便平稳(1)According to the data , the years from … to … saw/witness a rise/climb/drop in the number/rate/percentage/proportion of 对象 from 数据 to 数据,which was followed by a rapid decrease/reduce/increase over the **years.(2)The number/rate…dropped/went up again from…in ** year to…in ** year第 1 页第 2 页中公留学无忧,让留学更简单and then went up gradually until ** year ,when there was a leveling off/leveling out at 数据 for 一段时间。
雅思作文背诵材料模板范文
雅思作文背诵材料模板范文英文回答:Essay 1。
Topic: Discuss the advantages and disadvantages of technology in education.Introduction:Technology has become an integral part of modern education, offering numerous advantages and disadvantages. This essay will delve into both the benefits and drawbacks of technology in the educational realm.Advantages:Enhanced accessibility: Technology provides greater access to educational resources and opportunities, allowing students from diverse backgrounds and locations to engagein learning.Personalized learning: Digital tools enable educators to tailor instruction to individual student needs, aligning content and pacing to their unique learning styles.Interactive experiences: Technology facilitates interactive and engaging learning experiences through simulations, virtual reality, and online games, making lessons more dynamic and captivating.Collaboration and communication: Technology fosters collaboration among students and between students and teachers, facilitating knowledge-sharing and peer learning.Efficiency and organization: Digital platforms streamline administrative tasks, such as grading, record-keeping, and scheduling, freeing up teachers' time for more meaningful interactions with students.Disadvantages:Equity concerns: Access to technology and digital literacy vary widely, creating potential disparities in educational opportunities for students from disadvantaged backgrounds.Distractions and misuse: Technology can be a distracting element in the classroom if not properly managed, leading to reduced attention spans and decreased focus on learning.Reduced social interaction: Overuse of technology may limit face-to-face interactions and impair social development, especially among younger students.Dependence on technology: Students may become overly reliant on digital tools, which can hinder their ability to develop critical thinking and problem-solving skills.Cost and maintenance: Implementing and maintaining technology in schools can be expensive and may strain school budgets.Conclusion:Technology in education offers both advantages and disadvantages. While it has the potential to enhance accessibility, personalize learning, and facilitate interactive experiences, concerns exist about equity, distractions, social isolation, dependence, and cost. To maximize the benefits of technology while mitigating its drawbacks, educators must carefully consider its implementation and integration into the educational system.Essay 2。
雅思小作文-柱状图
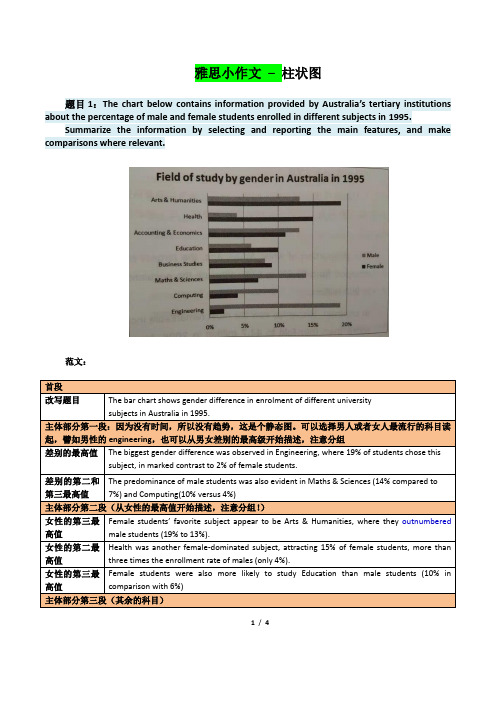
雅思小作文–柱状图题目1:The chart below contains information provided by Australia’s tertiary institutions about the percentage of male and female students enrolled in different subjects in 1995.Summarize the information by selecting and reporting the main features, and make comparisons where relevant.范文:1/ 4题目2:The chart below contains information about USA marriage and divorce rates between 1970 and 2000, and the marital status of adult Americans in two of the years.Summarize the information by selecting and reporting the main features, and make comparisons where relevant.2/ 4读图:动态图【因为有时间】,需要描述变化趋势These two graphs illustrate the change of marital status of American between 1970 and 2000.【改写题目】According to the first graph,there were 2.5m marriages in both 1970 and 1980, and then this figure decreased gradually during the next two decades, reaching to 2m in 2000. By comparison, the number of divorces first increased from 1m in 1970 to around 1.4 in 1980 and then slowly declined back to 1m in 2000.【分类描述第一幅柱状图,时态:一般过去时】As can be seen from the second bar chart,the percentage of married American adults dropped by more than 10% , from 70% in 1970 to less than 60% in 2000. Meanwhile, the percentage of adult Americans who were never married increased from about 15% in 1970 to20% in 2000, and despite still less than 10% , the proportion of divorced adults significantly went up from 1970 to 2000. Moreover, the percentages of the widowed in 1970 and 2000 accounted for less than 10% respectively, and showed a slight drop.【分类描述第二幅柱状图,时态:一般过去时】In conclusion, marital status of Americans in 2000 was not as optimistic as that of three decades ago. (1781.如果有两幅图表,则分成2段分别一一描述2.表示数值上升下降的常用句式有:•The number of …dropped from … to …•The percentage of …increased from about … to less than…•The proportion of … significantly went up from … to …3.切忌没有结论。
英语考试作文-24日雅思写作小作文范文:柱状图+表格
英语考试作文24日雅思写作小作文范文:柱状图+表格2018年5月的最后一场雅思考试已经结束,一起来回顾本场雅思考试的小作文吧。
本场雅思写作小作文题目为:The chart and table show the population size and life expectancy of three countries.题型为柱状图与表格题混合模式。
总体来说难度不大,建议考生将柱状图与表格的数据分开描述,并注意时态。
雅思小作文真题: The chart and table show the population size and life expectancy of three countries.Summarize the information by selecting key features and making comparison where is relevant.小作文范文解析:改题目属于柱状图和表格的混合型,要求描述三个国家在过去和将来人口数量和寿命的变化趋势。
建议把柱状图和表格分开来写,柱状图按照国家主体进行描述在,注意时态。
而寿命都是上升,国家之间也要对比。
范文共计9句话。
雅思小作文范文: The bar chart and the table illustrate variations in the demographic size and life span in 1950, 2000 and projections for 2050 in three countries including China, the United States and Spain.It is striking to note that China is always the most populous country, with its population accounting for more than 400 million in 1950. After 5 decades, this figure tripled and then is projected to keep rising to almost 1600 million in 2050. Meanwhile, a similar trend could be spotted in American population, quadrupling to nearly 400 million over the centenary. The Spanish remained the least and the most stable at around 80 million.As reflected from table, Life expectancy in all the countries is on a rise especially in China where it is projected to double from the initial 40.1 to 79 in 2050. Also noticeable is life of the Spanish is mostly the longest one, growing from 69 to 82.8 years old over this period except in 2000 when it was surpassed by that of Americans who lived 79 years old. American people will also enjoy rising longevity, approaching 82 years old.In summary, the Chinese always tremendously outnumber Americans and the Spanish and life span is predictedto improve and become almost equal in these countries.范文原创自小站老师Alice.Hua 字数 213 words以上就是2018年4月24日雅思写作真题范文,。
- 1、下载文档前请自行甄别文档内容的完整性,平台不提供额外的编辑、内容补充、找答案等附加服务。
- 2、"仅部分预览"的文档,不可在线预览部分如存在完整性等问题,可反馈申请退款(可完整预览的文档不适用该条件!)。
- 3、如文档侵犯您的权益,请联系客服反馈,我们会尽快为您处理(人工客服工作时间:9:00-18:30)。
You should spend about 20 minutes on this task.The charts below show the levels of participation in education and science in developing and industrialized countries in 1980 and 1990.Write a report a university lecturer describing the information shown below.You should write at least 150 words.1.The data shows the differences between developing and industrialized countries’ participation in education and science.2.In terms of the number of years of schooling received, we see that the length of time people spend at school in industrialized countries was much greater at 8.5 years in 1980, compared to 2.5 years in developing countries. The gap was increased further in 1900 when the figures rose to 10.5 years and3.5 years respectively.3.We can see a similar pattern in the second graph, which shows that the number of people working as scientists and technicians in industrialized countries increased from 55 to 85 per 1,000 people between 1980 and 1990, while the number in developing countries went from 12 to 20.4.Finally, the figures for spending on research and development show that industrialized countries more than doubled their spending, from $200bn to$420bn, while developing countries decreased theirs , from$75bn down to $25bn.5.Overall we can see that not only are there very large differences between the two economies but that there gaps are widening.分析第一段:1 The data shows the differences between developing and industrialized countries’ participation in education and science.本句话依旧是对题干进行改写。
Data是“数据”,相当于figure,number,percentage,proportion等。
第二段:1 In terms of the number of years of schooling received, we see that the length of time people spend at school in industrialized countries was much greater at 8.5 years in 1980, compared to 2.5 years in developing countries.这一段讨论第一组图,in terms of “在---方面”,引出所要讨论的东西。
Received是过去分词做后置定语,we see that是常用句式。
Compared to这里等同于compared with,与---比起来,相当于than。
2 The gap was increased further in 1900 when the figures rose to 10.5 years and 3.5 years respectively.本句讨论两个柱状之间的差距。
When引导状语从句,respectively是“分别地”,引出两组数据。
第三段:1 We can see a similar pattern in the second graph, which shows that the number of people working as scientists and technicians in industrialized countries increased from 55 to 85 per 1,000 people between 1980 and 1990, while the number in developing countries went from 12 to 20.We can see a similar pattern in the second graph是常用句型,which引导定语从句,which代替上文的整个句子或pattern这个名词,working是现在分词做后置定语,相当于who work。
While连接两个变化趋势相反的句子,作对比。
第五段:1 Overall we can see that not only are there very large differences between the two economies but that there gaps are widening.本句依然是对总体趋势进行总结。
That后面引导宾语从句。
Not only --- but also不但而且。
但同时作为that的宾语从句,又因为not only位于句首,而采用的倒装形式。
Not only部分倒装are there,but also部分不倒装。
大作文素材CompetitionsIt is a plain fact that we are in a world where competition is going on in all areas and at all levels. This is exciting. Yet, on the other hand, competition breeds a pragmatic attitude. People choose to learn things that are useful, and do things that are profitable. Today’s college education is also affected by this general sense of utilitarianism.Many college students choose business law or computer programming as their majors convinced that these professions are where the big money is. It is not unusual to see college students taking part-time jobs as a warming-up for the real battle. I often see my friends taking GRE tests, working on English or computer certificates and taking the driving lessons to get a license. Well, I have nothing against being practical. As the competition in the job market gets more and more intense, students do have reasons tobe practical. However, we should never forget that college education is much more than skill training.Just imagine if your utilitarianism prevails on campus, living no space for the cultivation of students' minds, or the nurturing of their soul. We will see universities churning out well-trained yet spiritless working machines. If utilitarianism prevails in society, we will see people bound by mind-forged medicals lost in the moneymaking ventures; we will see humility losing its grace and dignity. And that would be disastrous.I'd like to think of society as a carriage and people’s pursuit for profit or fame as the horse that pulls the carriage. Yet without the driver taking direction, the carriage would go straight and may even end out in a precarious situation.A certificate may give you some advantage, but broad horizons, positive attitudes and personal integrities. These are assets you cannot acquire through any quick fixed way. In today's world, where the highest level of competition is not of skills or expertise, but of vision and strategy, your intellectual quality largely determines how far you can go in your career.。